| Param | Original file | Final file |
|---|---|---|
| Filename | modeM0/AS1A07_010T12_9000003582cztM0_level2.fits | modeM0/AS1A07_010T12_9000003582cztM0_level2_quad_clean.evt |
| Size (bytes) | 646,868,160 | 556,776,000 |
| Size | 616.9 MB | 531.0 MB |
| Events in quadrant A | 4,048,906 | 3,281,797 |
| Events in quadrant B | 3,842,806 | 3,266,428 |
| Events in quadrant C | 3,934,950 | 3,133,008 |
| Events in quadrant D | 3,438,780 | 2,854,218 |
| Mode M0 | |||
|---|---|---|---|
| Quadrant | BADHDUFLAG | Total packets | Discarded packets |
| A | 0 | 131951 | 0 |
| B | 0 | 136830 | 0 |
| C | 0 | 141223 | 0 |
| D | 0 | 178171 | 0 |
| Mode SS | |||
|---|---|---|---|
| Quadrant | BADHDUFLAG | Total packets | Discarded packets |
| A | 0 | 1288 | 0 |
| B | 0 | 1288 | 0 |
| C | 0 | 1288 | 0 |
| D | 0 | 1288 | 0 |
| Mode M9 | |||
|---|---|---|---|
| Quadrant | BADHDUFLAG | Total packets | Discarded packets |
| A | 0 | 111 | 0 |
| B | 0 | 111 | 0 |
| C | 0 | 111 | 0 |
| D | 0 | 111 | 0 |
| Quadrant | Total seconds | Saturated seconds | Saturation percentage |
|---|---|---|---|
| A | 63050 | 781 | 1.238699% |
| B | 63050 | 1172 | 1.858842% |
| C | 63050 | 1335 | 2.117367% |
| D | 63050 | 1863 | 2.954798% |
Noise dominated data is calculated using 1-second bins in cleaned event files. If a bin has >2000 counts, and if more than 50% of those come from <1% of pixels, then it is considered to be noise-dominated and hence unusable.
| Quadrant | # 1 sec bins | Bins with >0 counts | Bins with >2000 counts | High rate bins dominated by noise | Noise dominated (total time) | Noise dominated (detector-on time) | Marked lightcurve |
|---|---|---|---|---|---|---|---|
| A | 74300 | 63043 | 0 | 0 | 0.00% | 0.00% |  |
| B | 74300 | 63039 | 0 | 0 | 0.00% | 0.00% |  |
| C | 74300 | 63043 | 0 | 0 | 0.00% | 0.00% | 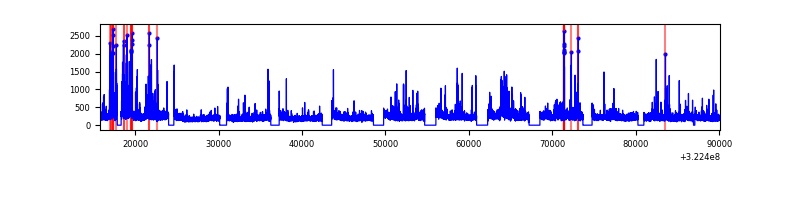 |
| D | 74300 | 63040 | 0 | 0 | 0.00% | 0.00% |  |
Top three noisy pixels from each quadrant. If the there are fewer than three noisy pixels in the level2.evt file, extra rows are filled as -1
| Pixel properties | Quadrant properties | ||||||
|---|---|---|---|---|---|---|---|
| Quadrant | DetID | PixID | Counts | Sigma | Mean | Median | Sigma |
| A | 0 | 29 | 3840 | 10.94 | 1055 | 996 | 259.9 |
| A | 7 | 110 | 3177 | 8.39 | 1055 | 996 | 259.9 |
| A | 0 | 30 | 3019 | 7.78 | 1055 | 996 | 259.9 |
| B | 2 | 9 | 3188 | 11.14 | 1019 | 979 | 198.4 |
| B | 2 | 8 | 2717 | 8.76 | 1019 | 979 | 198.4 |
| B | 3 | 80 | 2521 | 7.77 | 1019 | 979 | 198.4 |
| C | 1 | 80 | 3099 | 8.17 | 1038 | 978 | 259.6 |
| C | 1 | 81 | 2998 | 7.78 | 1038 | 978 | 259.6 |
| C | 12 | 241 | 2729 | 6.74 | 1038 | 978 | 259.6 |
| D | 10 | 189 | 2497 | 6.16 | 981 | 898 | 259.4 |
| D | 7 | 3 | 2466 | 6.04 | 981 | 898 | 259.4 |
| D | 6 | 67 | 2432 | 5.91 | 981 | 898 | 259.4 |
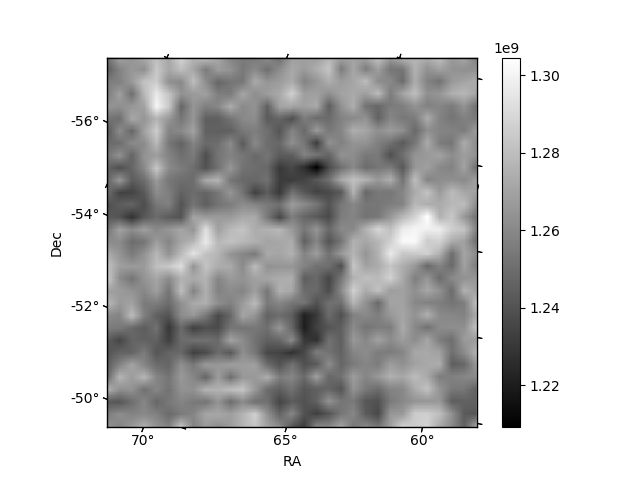
Histogram calculated using DETX and DETY for each event in the final _common_clean file
| Quadrant A |  |
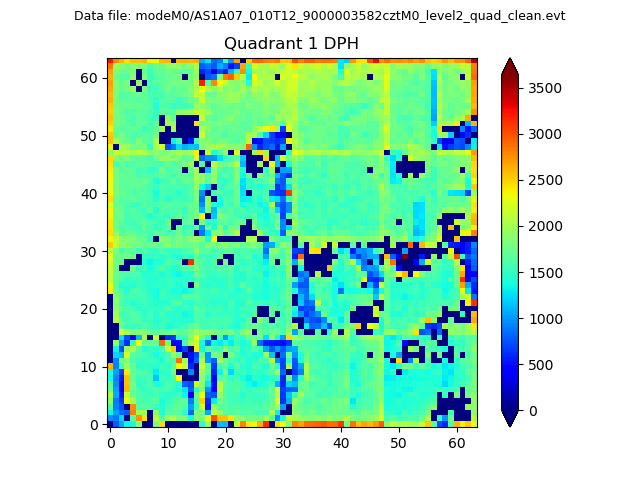 |
Quadrant B |
|---|---|---|---|
| Quadrant D |  |
 |
Quadrant C |
| Plot type | Count rate plots | Images |
|---|---|---|
| Comparison with Poisson distribution Blue bars denote a histogram of data divided into 1 sec bins. Red curve is a Poisson curve with rate = median count rate of data. |
 |
 |
| Quadrant-wise count rates Data is divided into 100 sec bins |
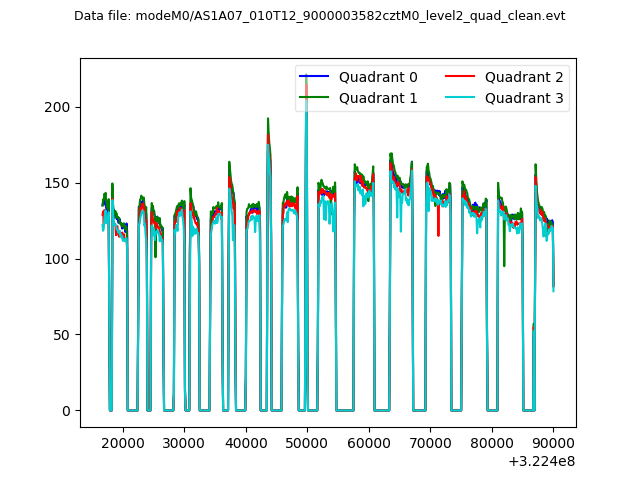 |
|
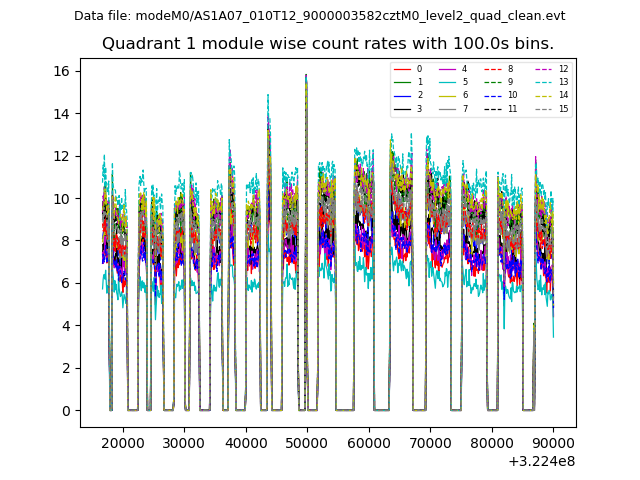
| Module-wise count rates for Quadrant A Data is divided into 100 sec bins |
 |
 |
| Module-wise count rates for Quadrant B Data is divided into 100 sec bins |
 |
 |
| Module-wise count rates for Quadrant C Data is divided into 100 sec bins |
 |
 |
| Module-wise count rates for Quadrant D Data is divided into 100 sec bins |
 |
 |
| Parameter | Plot |
|---|---|
| CZT HV Monitor |  |
| D_VDD | 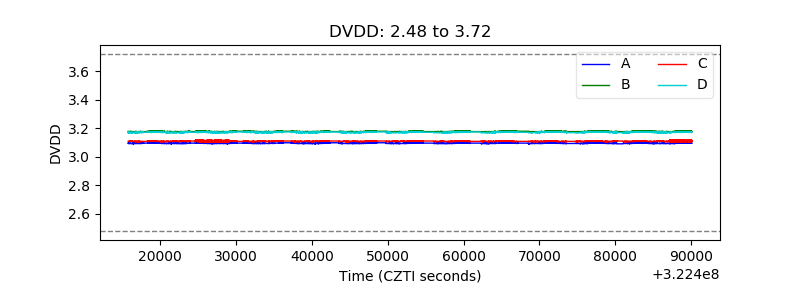 |
| Temperature 1 |  |
| Veto HV Monitor |  |
| Veto LLD |  |
| Alpha Counter |  |
| _CPM_Rate |  |
| CZT Counter |  |
| +2.5 Volts monitor |  |
| +5 Volts monitor |  |
| _ROLL_ROT |  |
| _Roll_DEC |  |
| _Roll_RA | 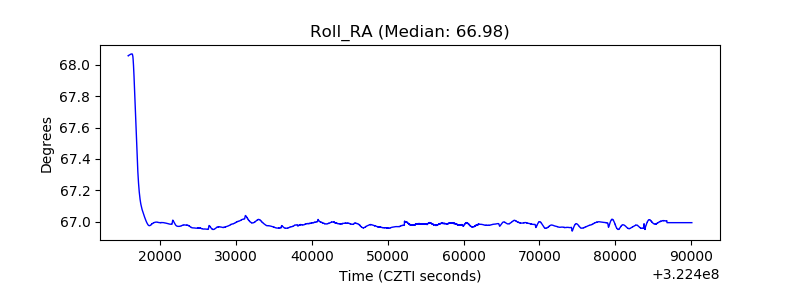 |
| Veto Counter |  |