| Param | Original file | Final file |
|---|---|---|
| Filename | modeM0/AS1A07_010T12_9000003582_24210cztM0_level2.evt | modeM0/AS1A07_010T12_9000003582_24210cztM0_level2_quad_clean.evt |
| Size (bytes) | 1,161,613,440 | 205,565,760 |
| Size | 1.1 GB | 196.0 MB |
| Events in quadrant A | 6,952,806 | 1,336,681 |
| Events in quadrant B | 7,207,006 | 1,352,412 |
| Events in quadrant C | 8,321,325 | 1,281,398 |
| Events in quadrant D | 11,704,388 | 1,239,163 |
| Mode M0 | |||
|---|---|---|---|
| Quadrant | BADHDUFLAG | Total packets | Discarded packets |
| A | 0 | 30199 | 3 |
| B | 0 | 30721 | 3 |
| C | 0 | 34284 | 3 |
| D | 0 | 44861 | 4 |
| Mode SS | |||
|---|---|---|---|
| Quadrant | BADHDUFLAG | Total packets | Discarded packets |
| A | 0 | 300 | 0 |
| B | 0 | 300 | 0 |
| C | 0 | 300 | 0 |
| D | 0 | 300 | 0 |
| Mode M9 | |||
|---|---|---|---|
| Quadrant | BADHDUFLAG | Total packets | Discarded packets |
| A | 0 | 19 | 0 |
| B | 0 | 19 | 0 |
| C | 0 | 19 | 0 |
| D | 0 | 19 | 0 |
| Quadrant | Total seconds | Saturated seconds | Saturation percentage |
|---|---|---|---|
| A | 14727 | 63 | 0.427786% |
| B | 14727 | 117 | 0.794459% |
| C | 14727 | 301 | 2.043865% |
| D | 14726 | 490 | 3.327448% |
Noise dominated data is calculated using 1-second bins in cleaned event files. If a bin has >2000 counts, and if more than 50% of those come from <1% of pixels, then it is considered to be noise-dominated and hence unusable.
| Quadrant | # 1 sec bins | Bins with >0 counts | Bins with >2000 counts | High rate bins dominated by noise | Noise dominated (total time) | Noise dominated (detector-on time) | Marked lightcurve |
|---|---|---|---|---|---|---|---|
| A | 16642 | 14730 | 8 | 8 | 0.05% | 0.05% |  |
| B | 16642 | 14730 | 50 | 50 | 0.30% | 0.34% |  |
| C | 16642 | 14730 | 74 | 74 | 0.44% | 0.50% |  |
| D | 16641 | 14729 | 367 | 367 | 2.21% | 2.49% |  |
Top three noisy pixels from each quadrant. If the there are fewer than three noisy pixels in the level2.evt file, extra rows are filled as -1
| Pixel properties | Quadrant properties | ||||||
|---|---|---|---|---|---|---|---|
| Quadrant | DetID | PixID | Counts | Sigma | Mean | Median | Sigma |
| A | 6 | 16 | 90592 | 247.15 | 1779 | 1737 | 359.5 |
| A | 13 | 254 | 23452 | 60.4 | 1779 | 1737 | 359.5 |
| A | 3 | 137 | 16125 | 40.02 | 1779 | 1737 | 359.5 |
| B | 5 | 172 | 147044 | 429.35 | 1768 | 1726 | 338.5 |
| B | 0 | 229 | 89966 | 260.71 | 1768 | 1726 | 338.5 |
| B | 12 | 111 | 41026 | 116.11 | 1768 | 1726 | 338.5 |
| C | 2 | 16 | 711486 | 1804.28 | 1687 | 1697 | 393.4 |
| C | 7 | 247 | 498596 | 1263.11 | 1687 | 1697 | 393.4 |
| C | 14 | 238 | 268708 | 678.74 | 1687 | 1697 | 393.4 |
| D | 8 | 195 | 3809980 | 9209.51 | 1701 | 1653 | 413.5 |
| D | 7 | 238 | 849677 | 2050.74 | 1701 | 1653 | 413.5 |
| D | 1 | 52 | 480048 | 1156.88 | 1701 | 1653 | 413.5 |
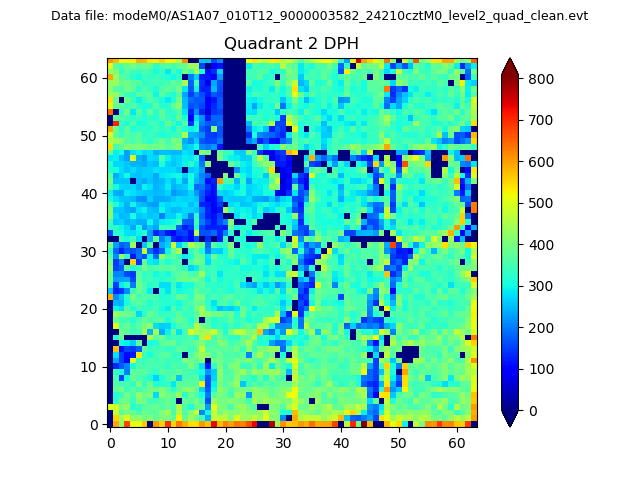
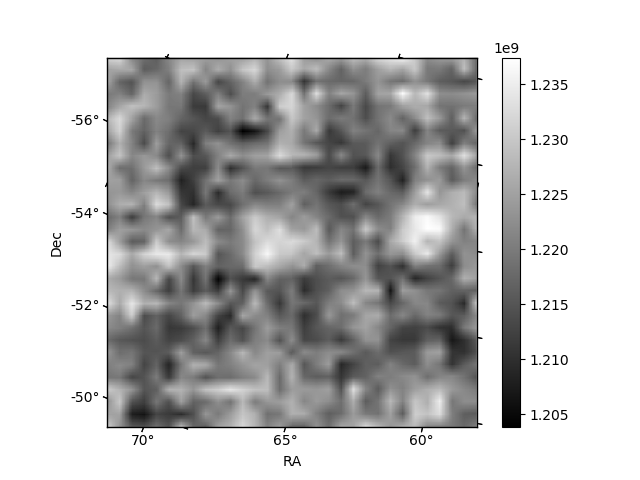
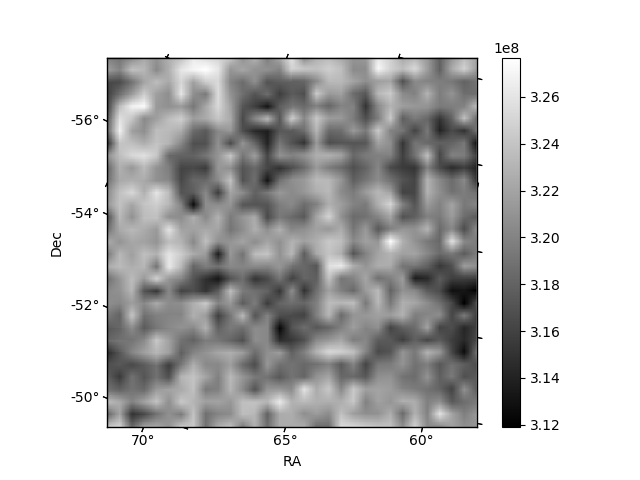
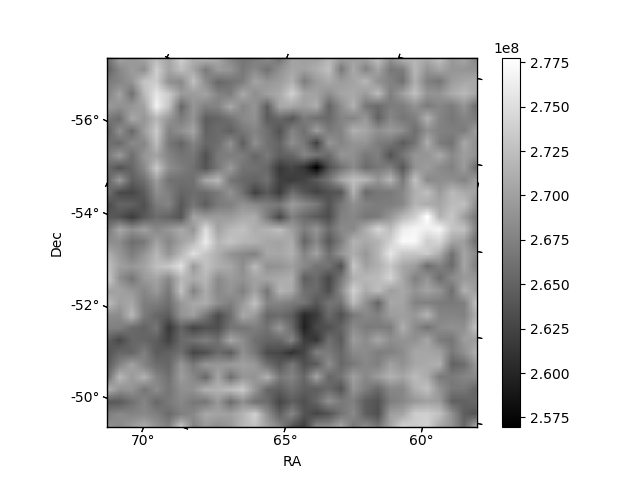
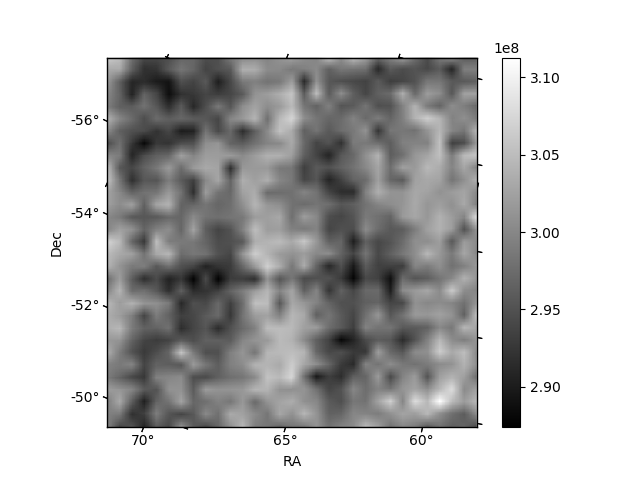
Histogram calculated using DETX and DETY for each event in the final _common_clean file
| Quadrant A | 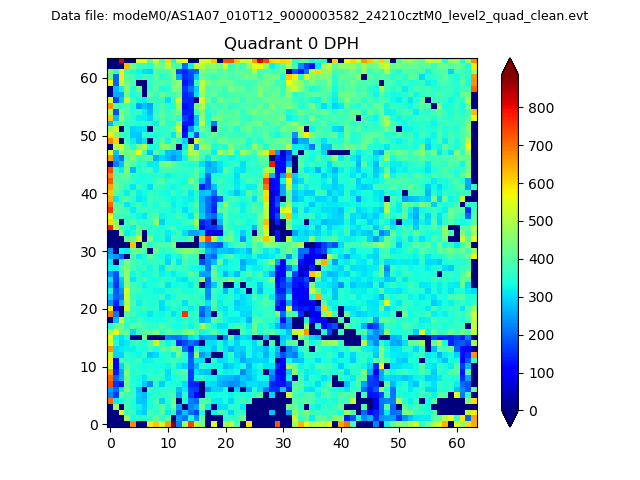 |
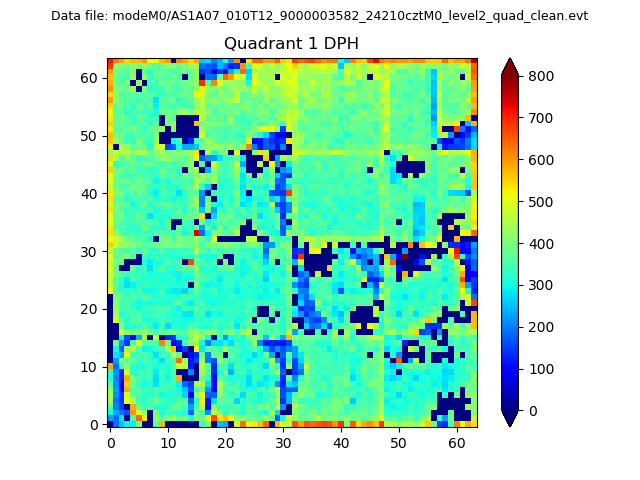 |
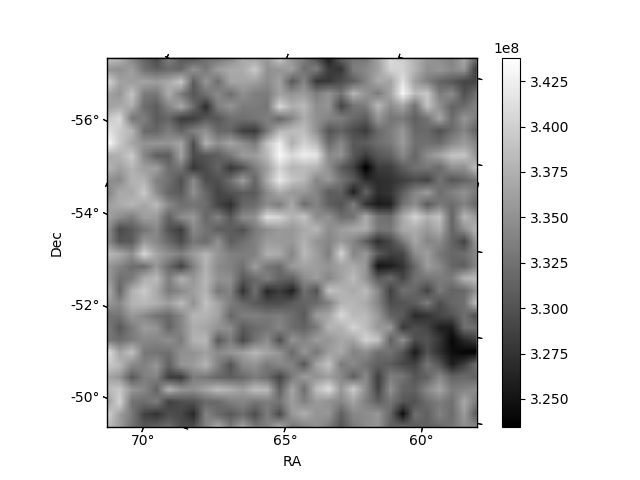
Quadrant B |
|---|---|---|---|
| Quadrant D | 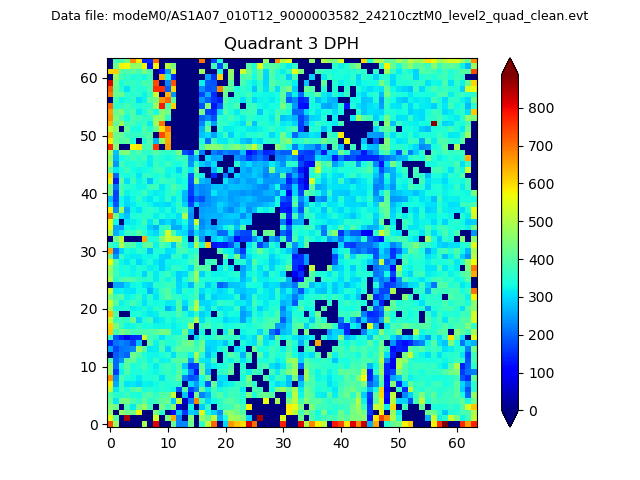 |
 |
Quadrant C |
| Plot type | Count rate plots | Images |
|---|---|---|
| Comparison with Poisson distribution Blue bars denote a histogram of data divided into 1 sec bins. Red curve is a Poisson curve with rate = median count rate of data. |
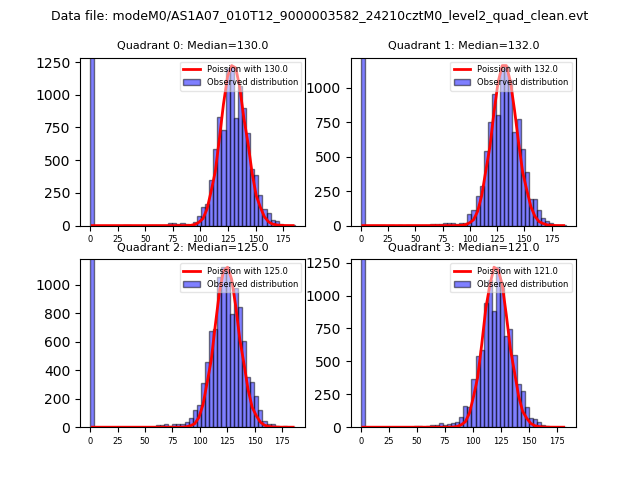 |
 |
| Quadrant-wise count rates Data is divided into 100 sec bins |
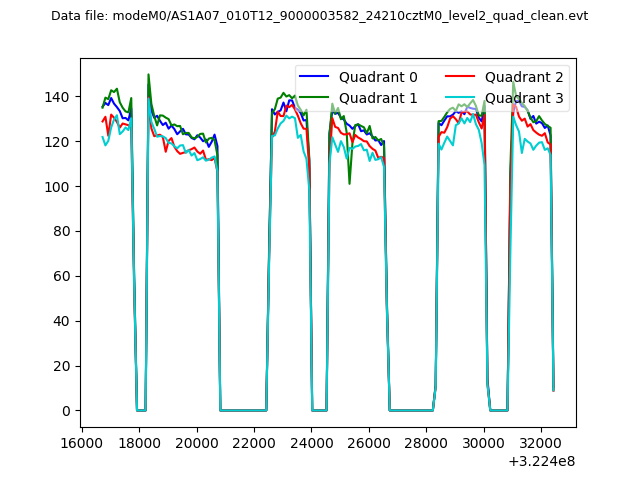 |
|
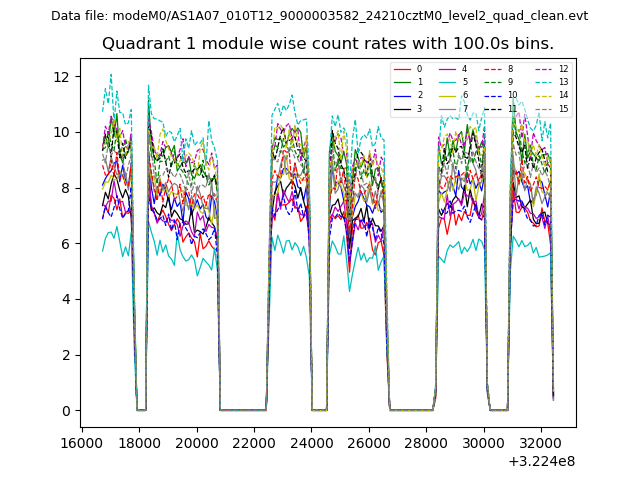
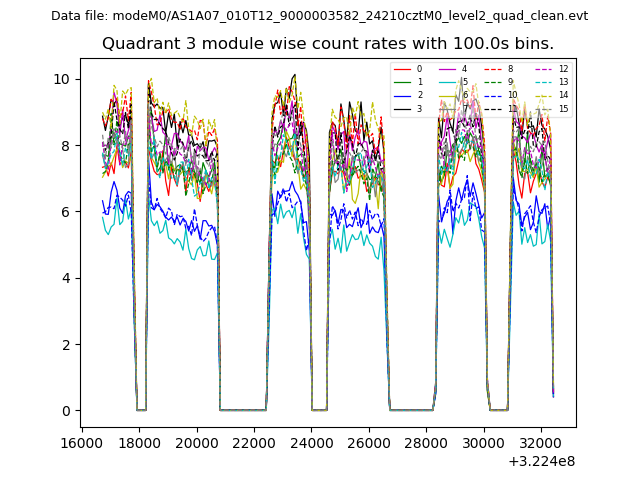
| Module-wise count rates for Quadrant A Data is divided into 100 sec bins |
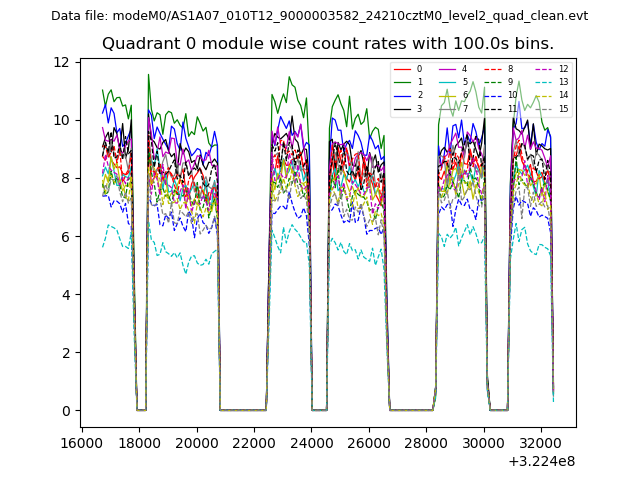 |
 |
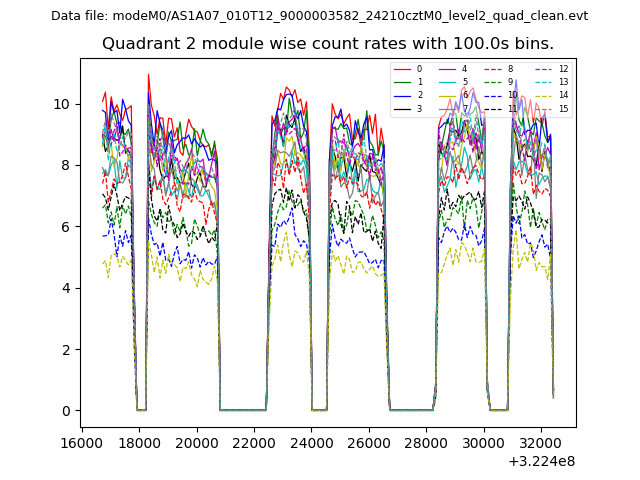
| Module-wise count rates for Quadrant B Data is divided into 100 sec bins |
 |
 |
| Module-wise count rates for Quadrant C Data is divided into 100 sec bins |
 |
 |
| Module-wise count rates for Quadrant D Data is divided into 100 sec bins |
 |
 |
| Parameter | Plot |
|---|---|
| CZT HV Monitor | 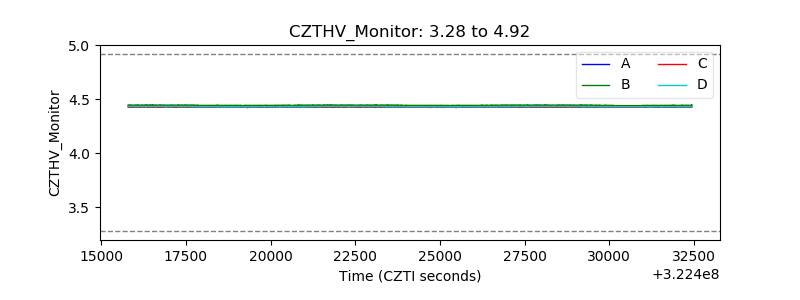 |
| D_VDD | 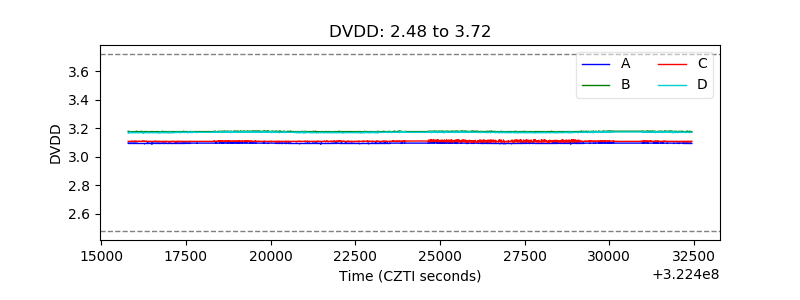 |
| Temperature 1 | 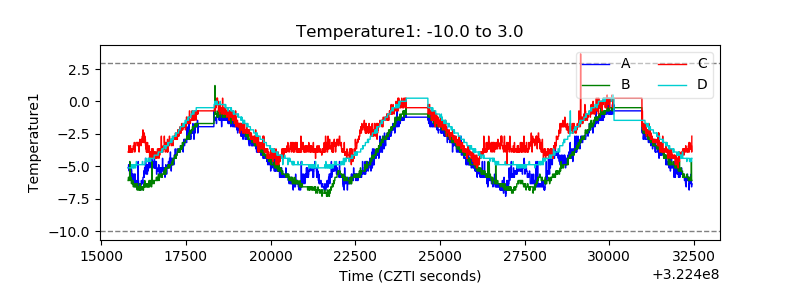 |
| Veto HV Monitor | 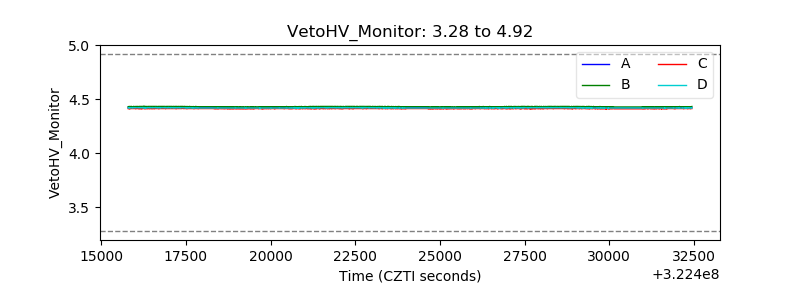 |
| Veto LLD | 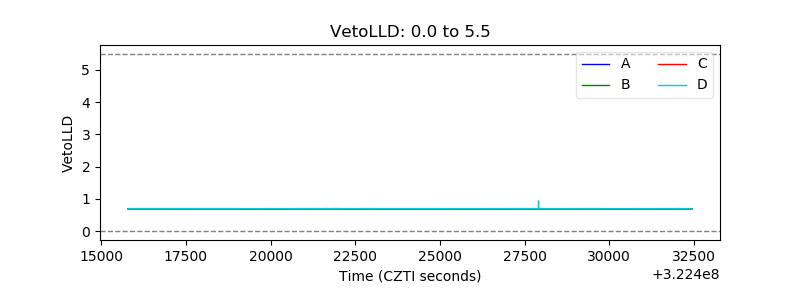 |
| Alpha Counter | 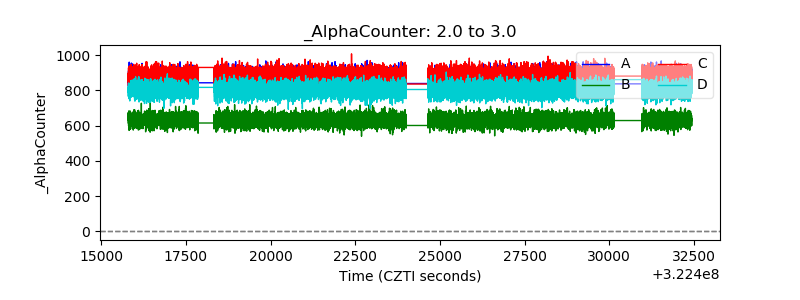 |
| _CPM_Rate | 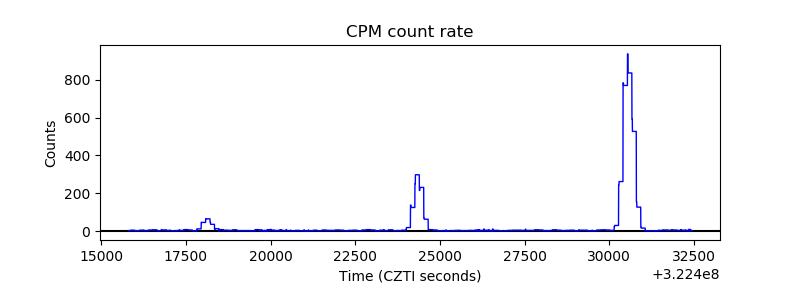 |
| CZT Counter | 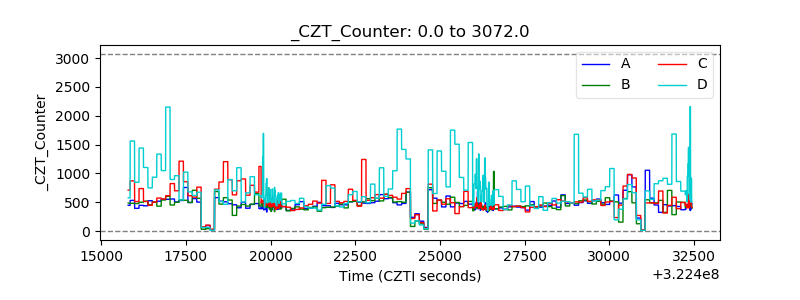 |
| +2.5 Volts monitor |  |
| +5 Volts monitor |  |
| _ROLL_ROT | 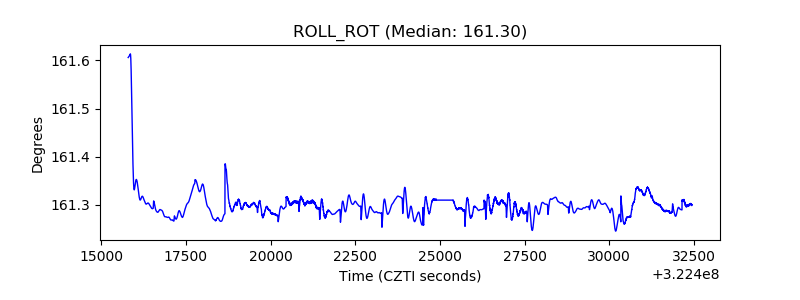 |
| _Roll_DEC | 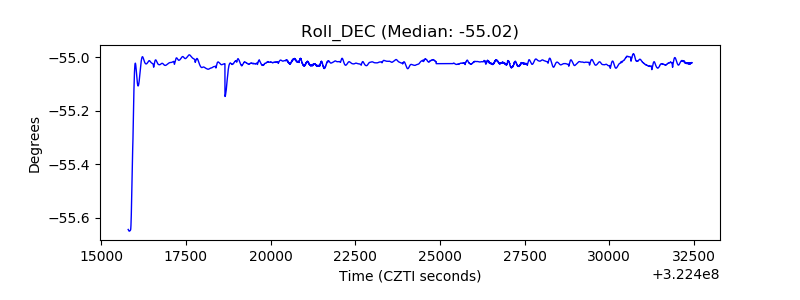 |
| _Roll_RA | 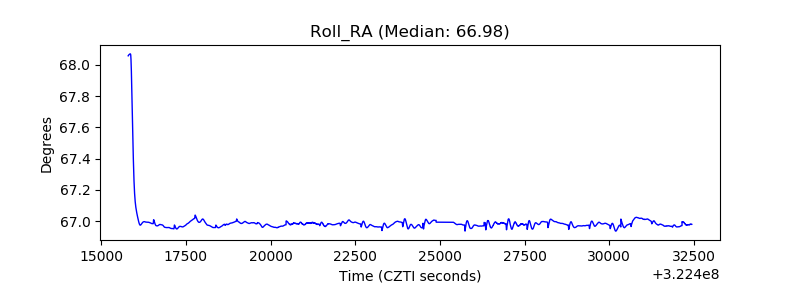 |
| Veto Counter | 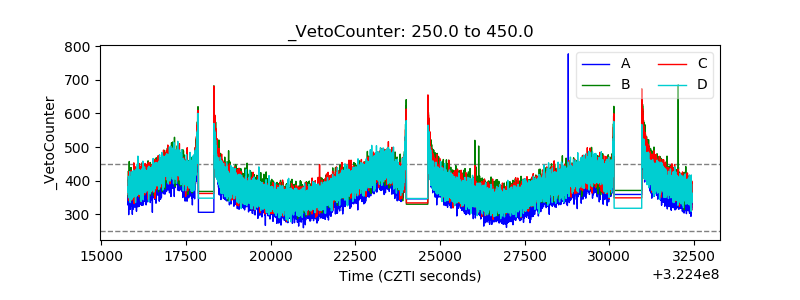 |