| Param | Original file | Final file |
|---|---|---|
| Filename | modeM0/AS1A07_010T12_9000003582_24213cztM0_level2.evt | modeM0/AS1A07_010T12_9000003582_24213cztM0_level2_quad_clean.evt |
| Size (bytes) | 496,823,040 | 93,407,040 |
| Size | 473.8 MB | 89.1 MB |
| Events in quadrant A | 3,188,547 | 601,927 |
| Events in quadrant B | 3,307,222 | 616,172 |
| Events in quadrant C | 3,305,131 | 588,007 |
| Events in quadrant D | 4,795,462 | 560,206 |
| Mode M0 | |||
|---|---|---|---|
| Quadrant | BADHDUFLAG | Total packets | Discarded packets |
| A | 0 | 13616 | 2 |
| B | 0 | 13966 | 2 |
| C | 0 | 13917 | 2 |
| D | 0 | 18679 | 2 |
| Mode SS | |||
|---|---|---|---|
| Quadrant | BADHDUFLAG | Total packets | Discarded packets |
| A | 0 | 138 | 0 |
| B | 0 | 138 | 0 |
| C | 0 | 138 | 0 |
| D | 0 | 138 | 0 |
| Mode M9 | |||
|---|---|---|---|
| Quadrant | BADHDUFLAG | Total packets | Discarded packets |
| A | 0 | 21 | 0 |
| B | 0 | 21 | 0 |
| C | 0 | 21 | 0 |
| D | 0 | 21 | 0 |
| Quadrant | Total seconds | Saturated seconds | Saturation percentage |
|---|---|---|---|
| A | 6624 | 39 | 0.588768% |
| B | 6625 | 52 | 0.784906% |
| C | 6625 | 68 | 1.026415% |
| D | 6625 | 217 | 3.275472% |
Noise dominated data is calculated using 1-second bins in cleaned event files. If a bin has >2000 counts, and if more than 50% of those come from <1% of pixels, then it is considered to be noise-dominated and hence unusable.
| Quadrant | # 1 sec bins | Bins with >0 counts | Bins with >2000 counts | High rate bins dominated by noise | Noise dominated (total time) | Noise dominated (detector-on time) | Marked lightcurve |
|---|---|---|---|---|---|---|---|
| A | 8774 | 6625 | 0 | 0 | 0.00% | 0.00% | 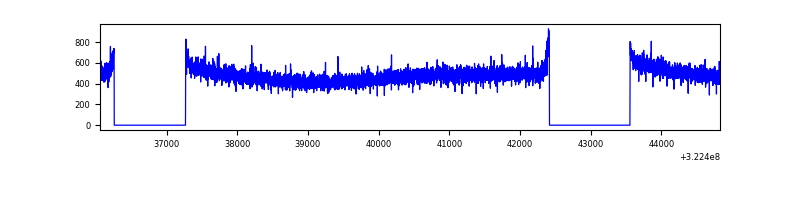 |
| B | 8775 | 6626 | 2 | 2 | 0.02% | 0.03% | 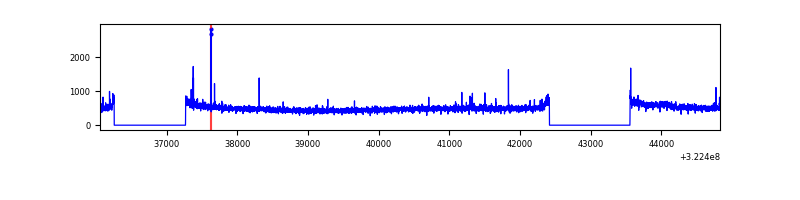 |
| C | 8775 | 6626 | 1 | 1 | 0.01% | 0.02% |  |
| D | 8775 | 6626 | 228 | 228 | 2.60% | 3.44% | 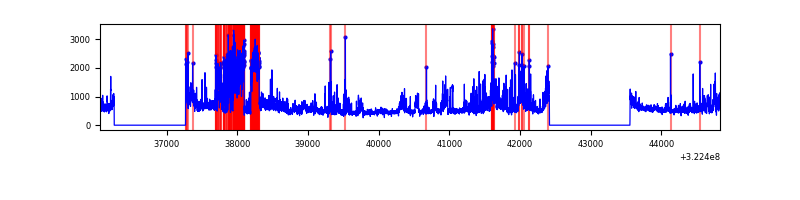 |
Top three noisy pixels from each quadrant. If the there are fewer than three noisy pixels in the level2.evt file, extra rows are filled as -1
| Pixel properties | Quadrant properties | ||||||
|---|---|---|---|---|---|---|---|
| Quadrant | DetID | PixID | Counts | Sigma | Mean | Median | Sigma |
| A | 13 | 254 | 10742 | 60.24 | 826 | 809 | 164.9 |
| A | 0 | 226 | 7172 | 38.59 | 826 | 809 | 164.9 |
| A | 3 | 137 | 7117 | 38.26 | 826 | 809 | 164.9 |
| B | 0 | 245 | 19143 | 117.55 | 830 | 809 | 156.0 |
| B | 12 | 111 | 18260 | 111.89 | 830 | 809 | 156.0 |
| B | 0 | 229 | 17337 | 105.97 | 830 | 809 | 156.0 |
| C | 14 | 238 | 129090 | 700.76 | 794 | 798 | 183.1 |
| C | 3 | 233 | 33527 | 178.77 | 794 | 798 | 183.1 |
| C | 7 | 247 | 25317 | 133.93 | 794 | 798 | 183.1 |
| D | 1 | 52 | 732336 | 3830.14 | 793 | 770 | 191.0 |
| D | 7 | 238 | 669103 | 3499.08 | 793 | 770 | 191.0 |
| D | 8 | 195 | 286872 | 1497.9 | 793 | 770 | 191.0 |
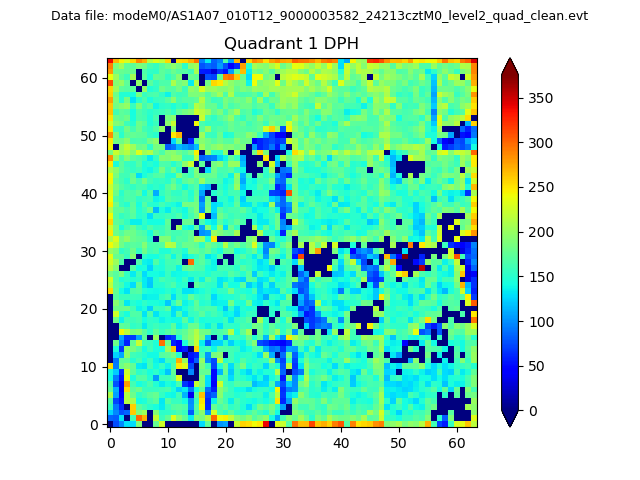
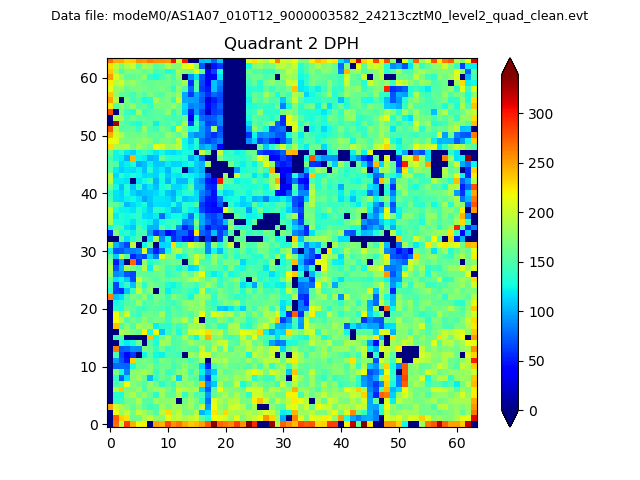
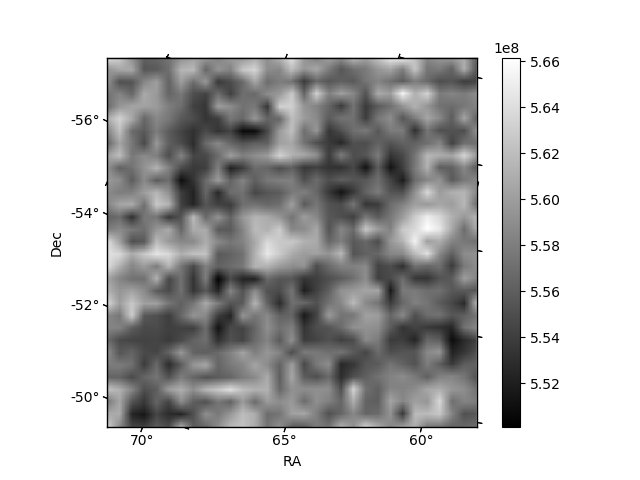
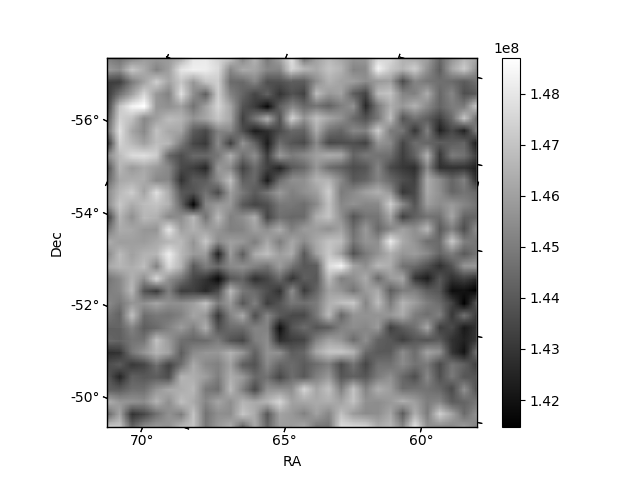
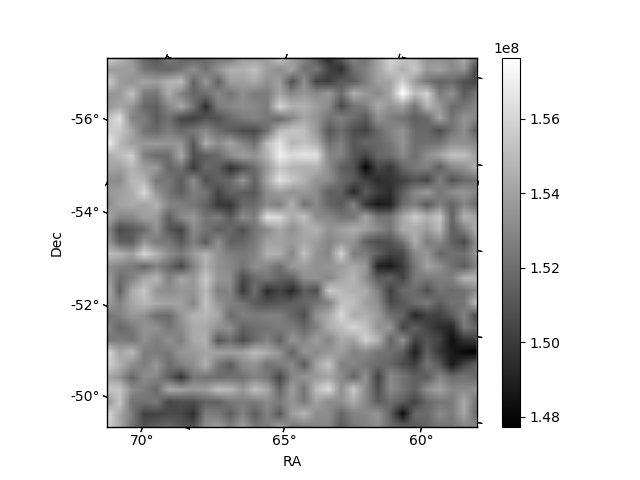
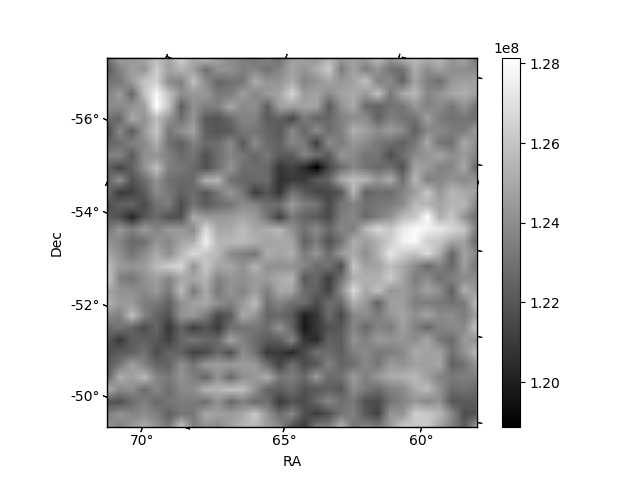
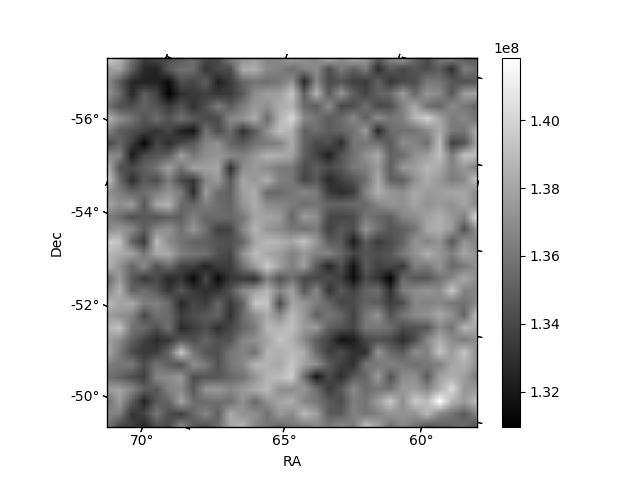
Histogram calculated using DETX and DETY for each event in the final _common_clean file
| Quadrant A | 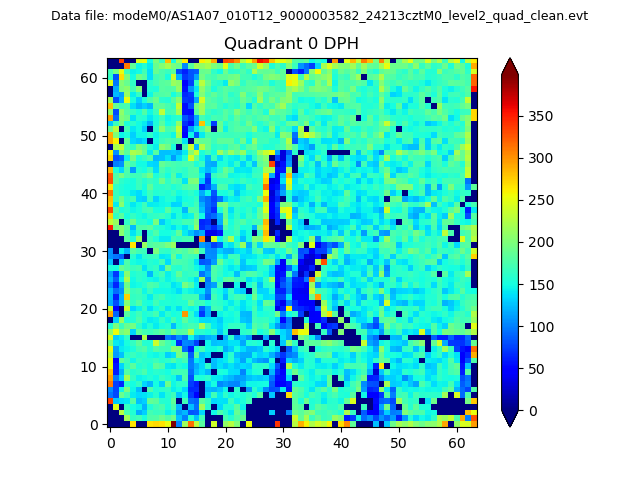 |
 |
Quadrant B |
|---|---|---|---|
| Quadrant D | 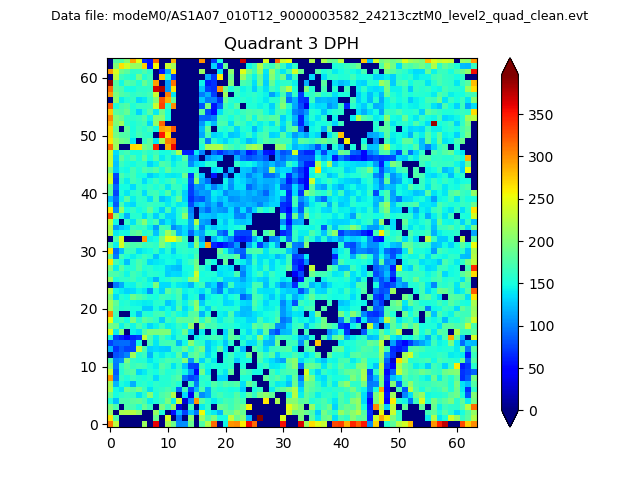 |
 |
Quadrant C |
| Plot type | Count rate plots | Images |
|---|---|---|
| Comparison with Poisson distribution Blue bars denote a histogram of data divided into 1 sec bins. Red curve is a Poisson curve with rate = median count rate of data. |
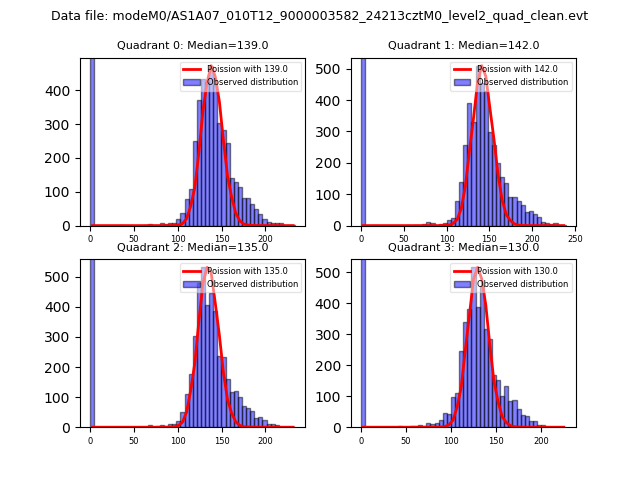 |
 |
| Quadrant-wise count rates Data is divided into 100 sec bins |
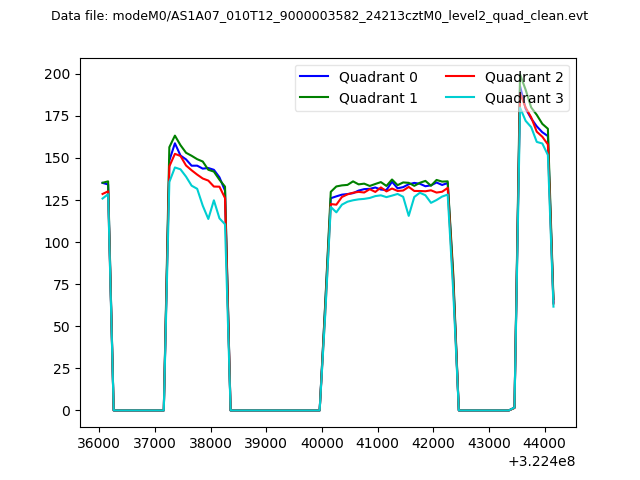 |
|
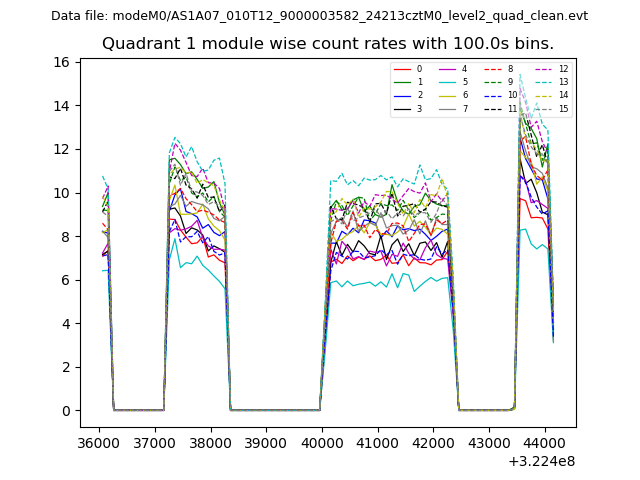
| Module-wise count rates for Quadrant A Data is divided into 100 sec bins |
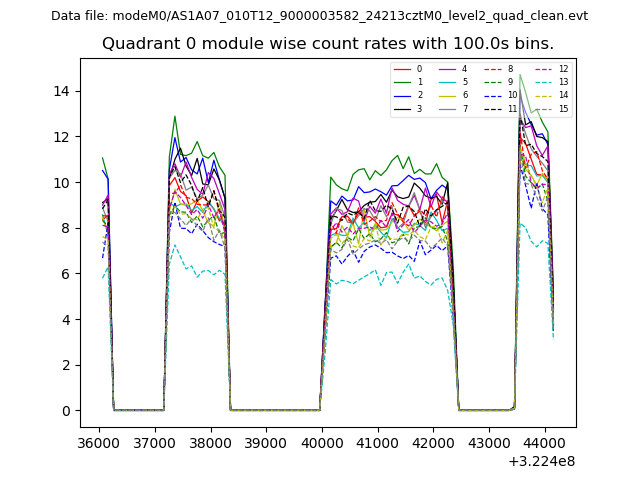 |
 |
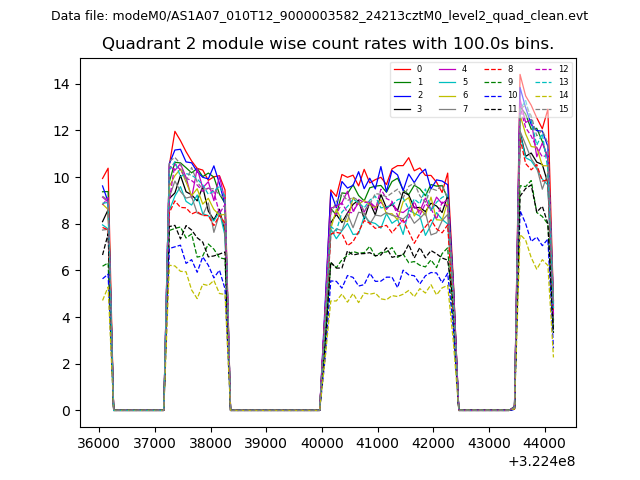
| Module-wise count rates for Quadrant B Data is divided into 100 sec bins |
 |
 |
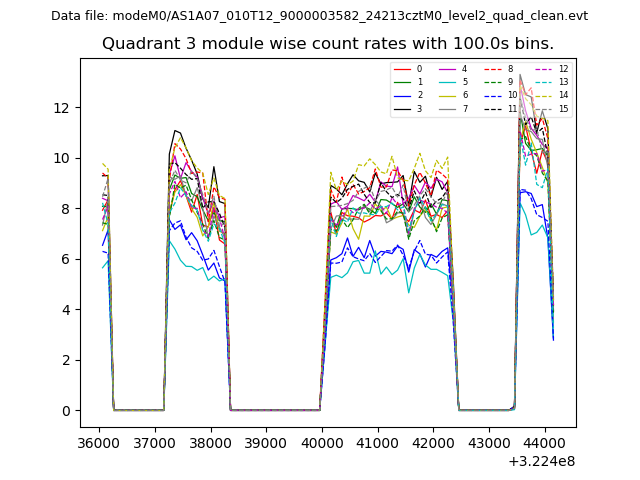
| Module-wise count rates for Quadrant C Data is divided into 100 sec bins |
 |
 |
| Module-wise count rates for Quadrant D Data is divided into 100 sec bins |
 |
 |
| Parameter | Plot |
|---|---|
| CZT HV Monitor | 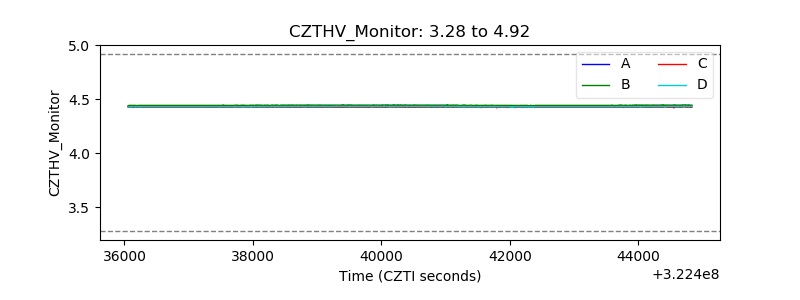 |
| D_VDD | 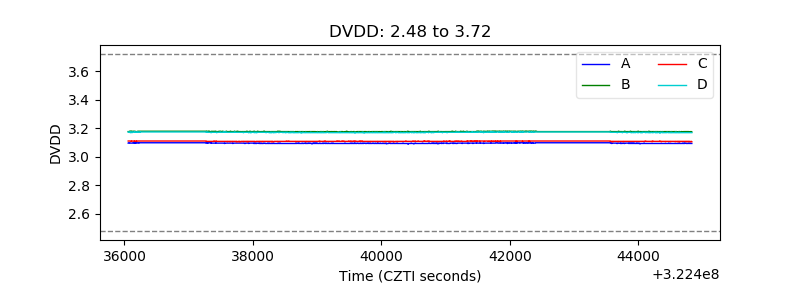 |
| Temperature 1 | 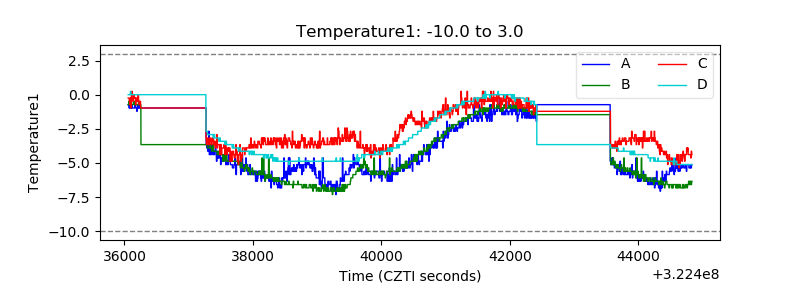 |
| Veto HV Monitor | 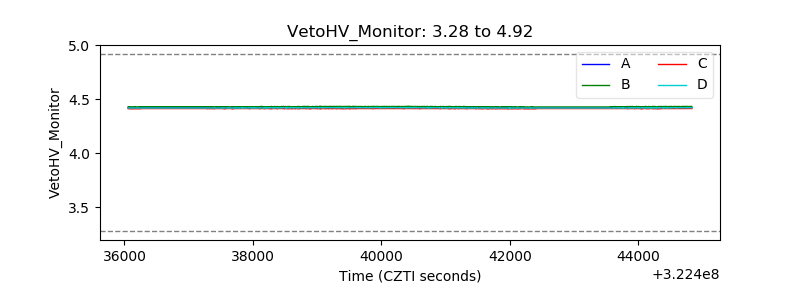 |
| Veto LLD | 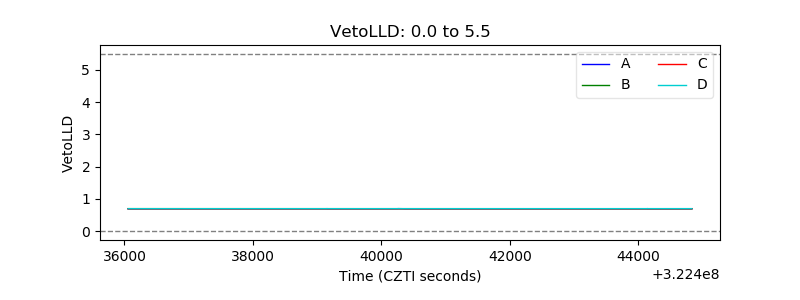 |
| Alpha Counter | 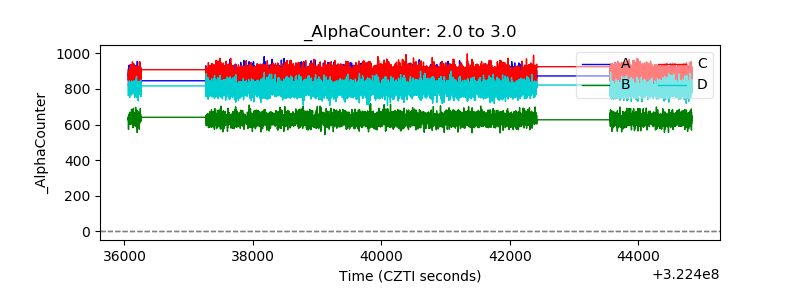 |
| _CPM_Rate | 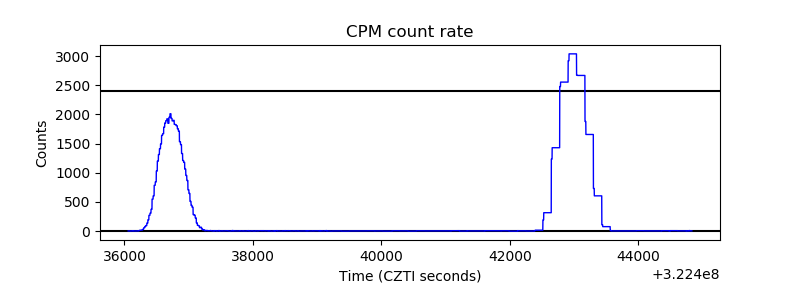 |
| CZT Counter | 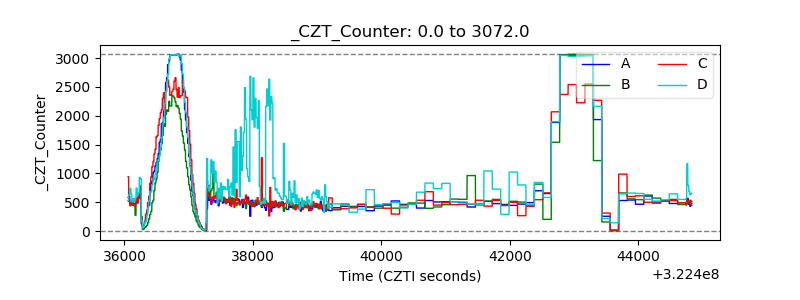 |
| +2.5 Volts monitor |  |
| +5 Volts monitor |  |
| _ROLL_ROT | 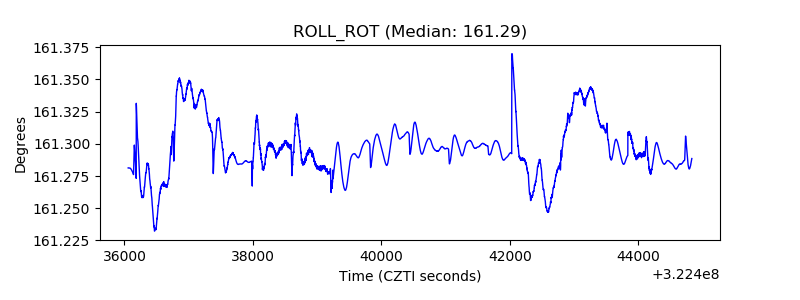 |
| _Roll_DEC | 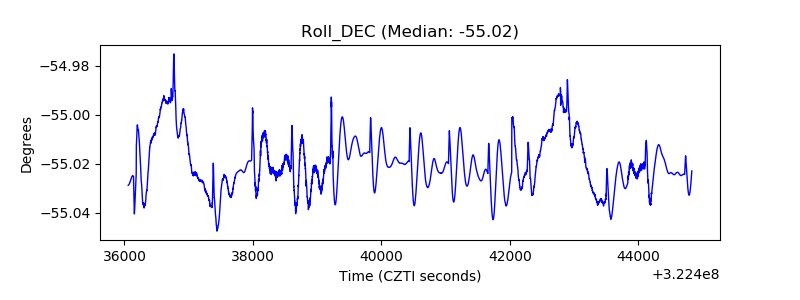 |
| _Roll_RA | 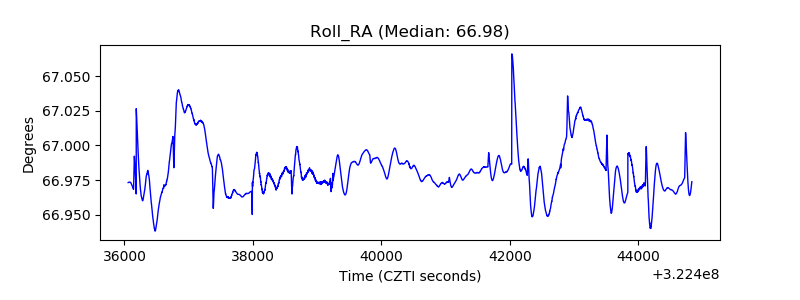 |
| Veto Counter | 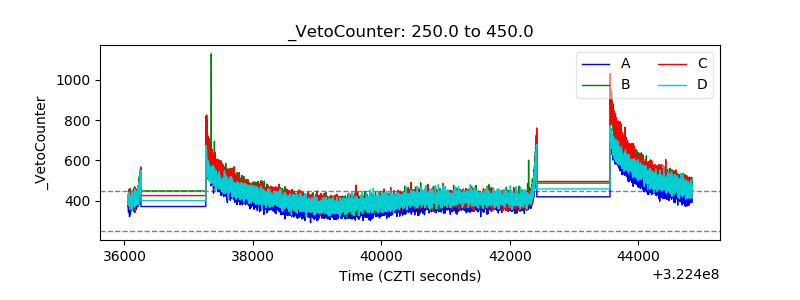 |