| Param | Original file | Final file |
|---|---|---|
| Filename | modeM0/AS1A07_010T12_9000003582_24214cztM0_level2.evt | modeM0/AS1A07_010T12_9000003582_24214cztM0_level2_quad_clean.evt |
| Size (bytes) | 509,970,240 | 83,249,280 |
| Size | 486.3 MB | 79.4 MB |
| Events in quadrant A | 3,314,867 | 522,601 |
| Events in quadrant B | 3,431,862 | 536,647 |
| Events in quadrant C | 3,483,197 | 515,003 |
| Events in quadrant D | 4,772,634 | 491,959 |
| Mode M0 | |||
|---|---|---|---|
| Quadrant | BADHDUFLAG | Total packets | Discarded packets |
| A | 0 | 13771 | 1 |
| B | 0 | 14167 | 1 |
| C | 0 | 14332 | 1 |
| D | 0 | 18811 | 1 |
| Mode SS | |||
|---|---|---|---|
| Quadrant | BADHDUFLAG | Total packets | Discarded packets |
| A | 0 | 132 | 0 |
| B | 0 | 132 | 0 |
| C | 0 | 132 | 0 |
| D | 0 | 132 | 0 |
| Mode M9 | |||
|---|---|---|---|
| Quadrant | BADHDUFLAG | Total packets | Discarded packets |
| A | 0 | 16 | 0 |
| B | 0 | 17 | 0 |
| C | 0 | 17 | 0 |
| D | 0 | 17 | 0 |
| Quadrant | Total seconds | Saturated seconds | Saturation percentage |
|---|---|---|---|
| A | 6519 | 43 | 0.659610% |
| B | 6519 | 61 | 0.935726% |
| C | 6519 | 89 | 1.365240% |
| D | 6519 | 138 | 2.116889% |
Noise dominated data is calculated using 1-second bins in cleaned event files. If a bin has >2000 counts, and if more than 50% of those come from <1% of pixels, then it is considered to be noise-dominated and hence unusable.
| Quadrant | # 1 sec bins | Bins with >0 counts | Bins with >2000 counts | High rate bins dominated by noise | Noise dominated (total time) | Noise dominated (detector-on time) | Marked lightcurve |
|---|---|---|---|---|---|---|---|
| A | 7744 | 6520 | 0 | 0 | 0.00% | 0.00% | 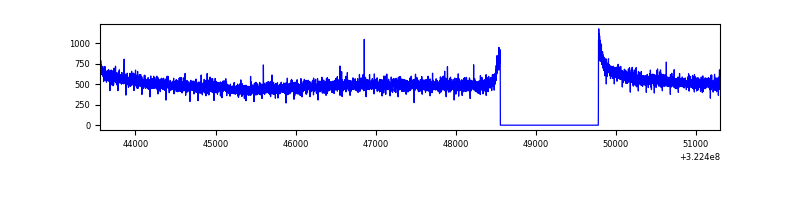 |
| B | 7744 | 6519 | 2 | 2 | 0.03% | 0.03% | 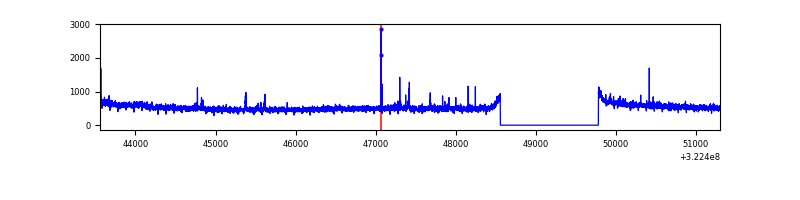 |
| C | 7744 | 6519 | 0 | 0 | 0.00% | 0.00% | 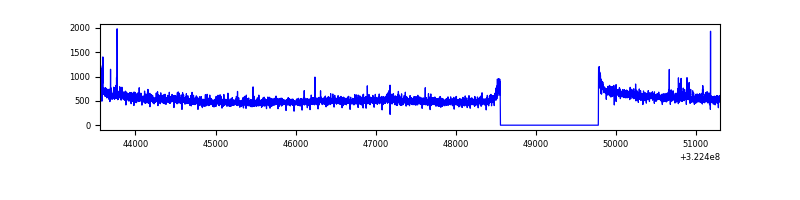 |
| D | 7744 | 6519 | 69 | 69 | 0.89% | 1.06% | 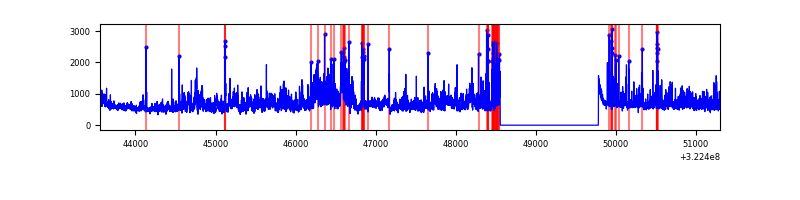 |
Top three noisy pixels from each quadrant. If the there are fewer than three noisy pixels in the level2.evt file, extra rows are filled as -1
| Pixel properties | Quadrant properties | ||||||
|---|---|---|---|---|---|---|---|
| Quadrant | DetID | PixID | Counts | Sigma | Mean | Median | Sigma |
| A | 13 | 254 | 10559 | 57.15 | 858 | 841 | 170.1 |
| A | 0 | 226 | 7359 | 38.33 | 858 | 841 | 170.1 |
| A | 3 | 137 | 6931 | 35.81 | 858 | 841 | 170.1 |
| B | 0 | 229 | 26760 | 162.62 | 863 | 843 | 159.4 |
| B | 12 | 111 | 18297 | 109.52 | 863 | 843 | 159.4 |
| B | 11 | 111 | 16463 | 98.01 | 863 | 843 | 159.4 |
| C | 14 | 238 | 136758 | 712.98 | 835 | 842 | 190.6 |
| C | 7 | 247 | 32892 | 168.13 | 835 | 842 | 190.6 |
| C | 2 | 16 | 29969 | 152.79 | 835 | 842 | 190.6 |
| D | 8 | 195 | 787844 | 3966.2 | 832 | 810 | 198.4 |
| D | 7 | 238 | 735083 | 3700.31 | 832 | 810 | 198.4 |
| D | 1 | 52 | 50421 | 250.01 | 832 | 810 | 198.4 |
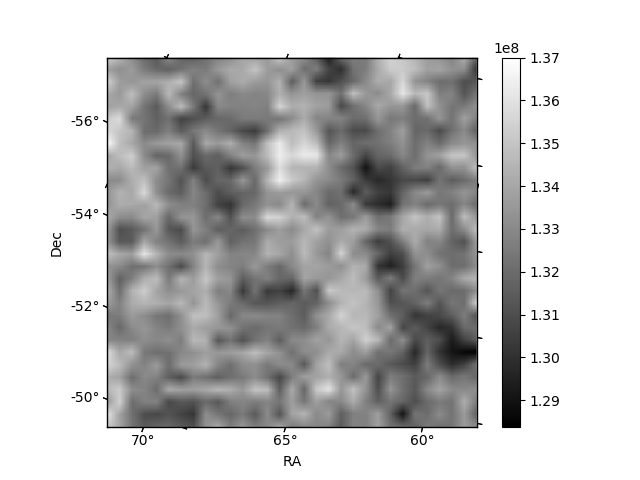
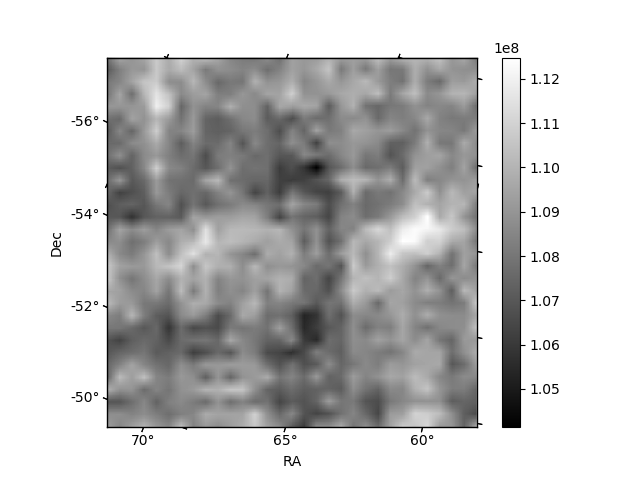
Histogram calculated using DETX and DETY for each event in the final _common_clean file
| Quadrant A | 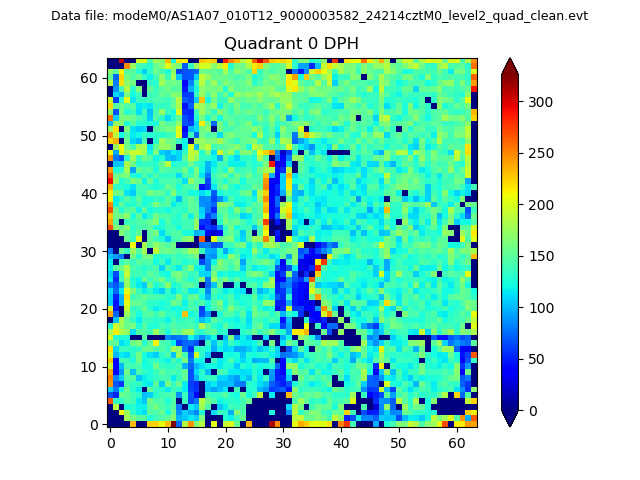 |
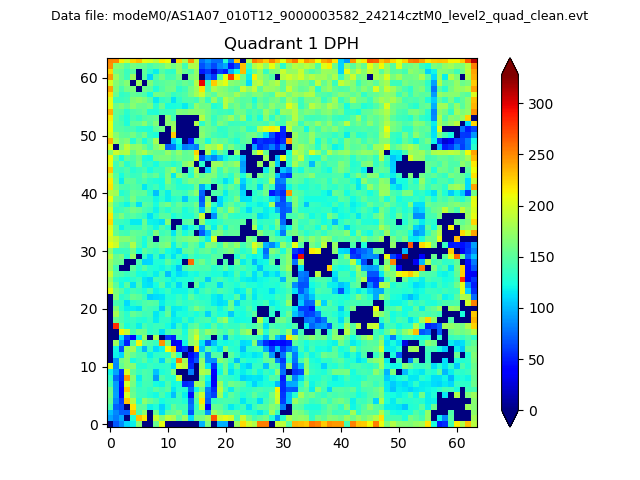 |
Quadrant B |
|---|---|---|---|
| Quadrant D | 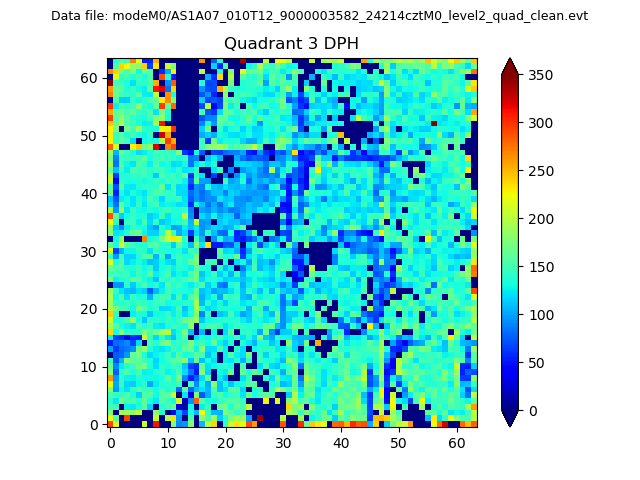 |
 |
Quadrant C |
| Plot type | Count rate plots | Images |
|---|---|---|
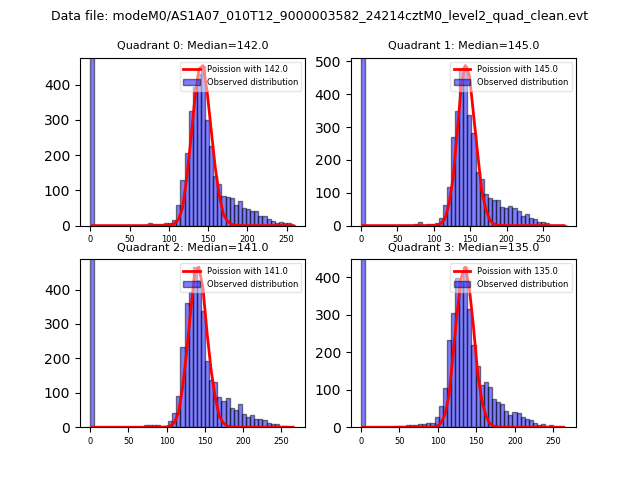
| Comparison with Poisson distribution Blue bars denote a histogram of data divided into 1 sec bins. Red curve is a Poisson curve with rate = median count rate of data. |
 |
 |
| Quadrant-wise count rates Data is divided into 100 sec bins |
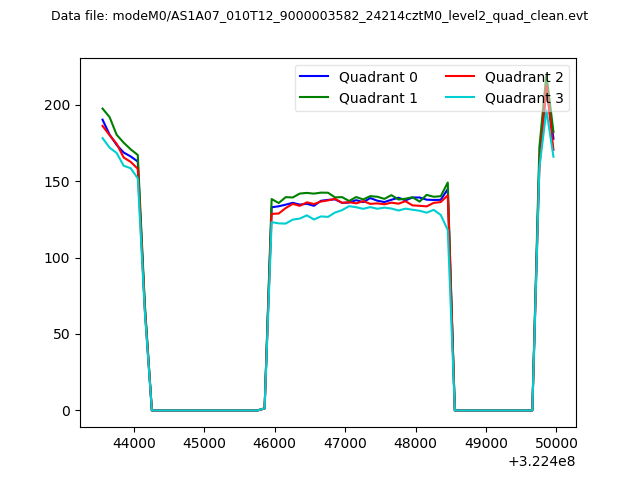 |
|
| Module-wise count rates for Quadrant A Data is divided into 100 sec bins |
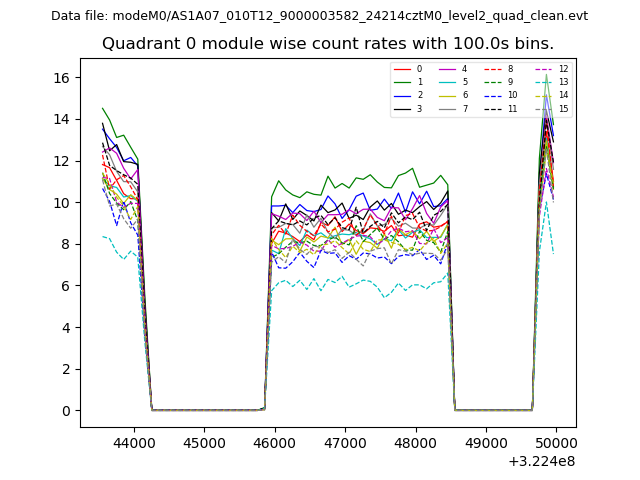 |
 |
| Module-wise count rates for Quadrant B Data is divided into 100 sec bins |
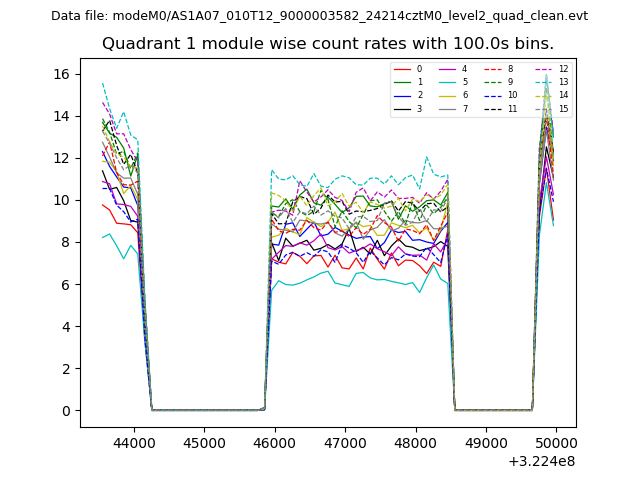 |
 |
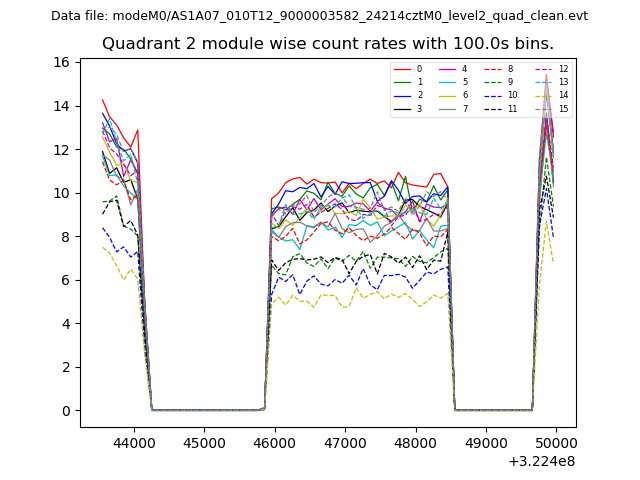
| Module-wise count rates for Quadrant C Data is divided into 100 sec bins |
 |
 |
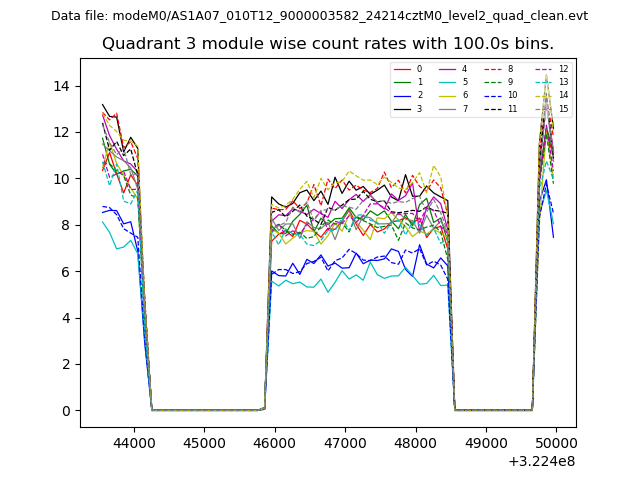
| Module-wise count rates for Quadrant D Data is divided into 100 sec bins |
 |
 |
| Parameter | Plot |
|---|---|
| CZT HV Monitor | 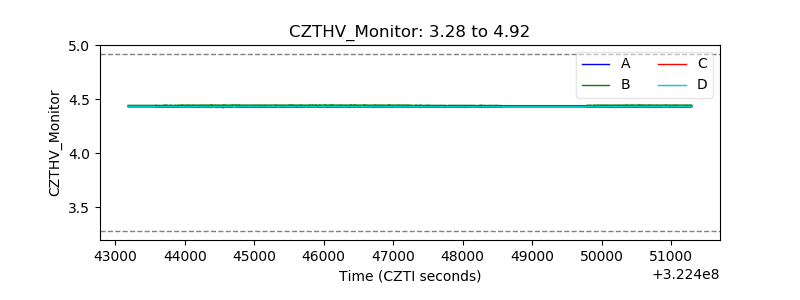 |
| D_VDD |  |
| Temperature 1 | 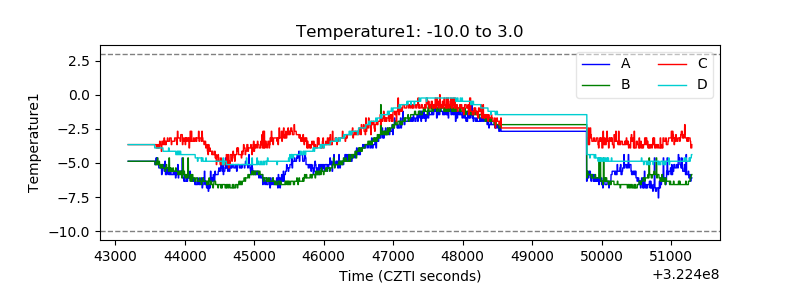 |
| Veto HV Monitor |  |
| Veto LLD | 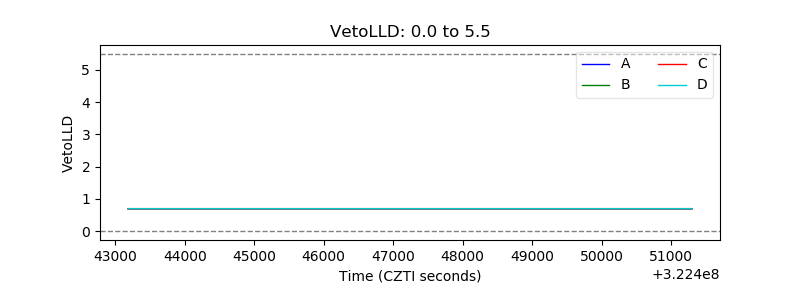 |
| Alpha Counter | 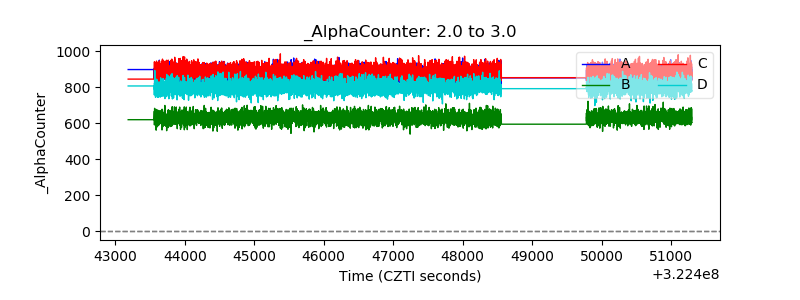 |
| _CPM_Rate | 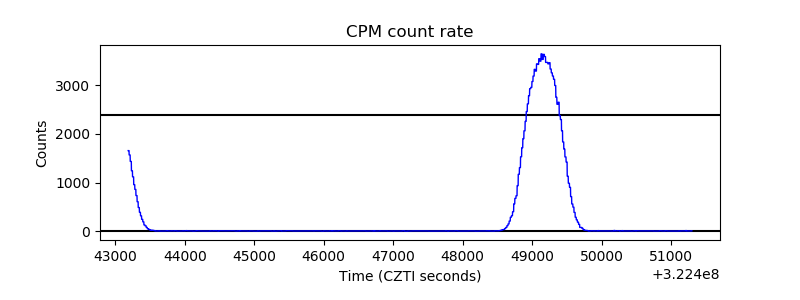 |
| CZT Counter |  |
| +2.5 Volts monitor |  |
| +5 Volts monitor |  |
| _ROLL_ROT | 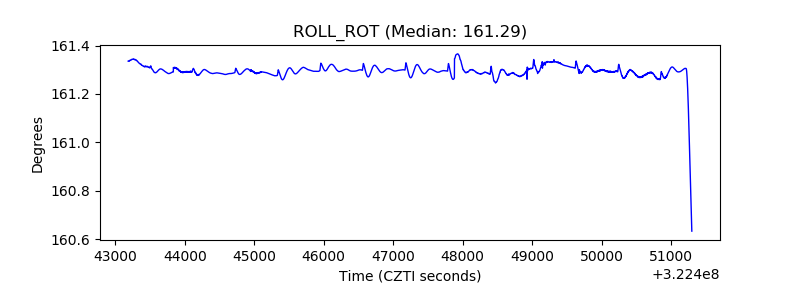 |
| _Roll_DEC | 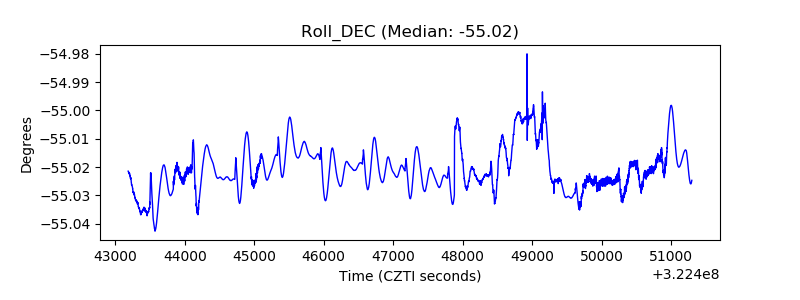 |
| _Roll_RA |  |
| Veto Counter | 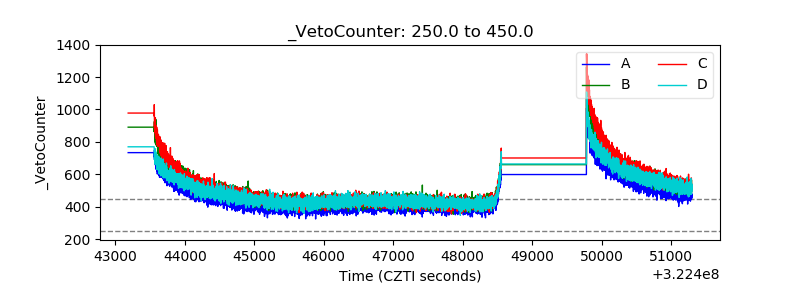 |