| Param | Original file | Final file |
|---|---|---|
| Filename | modeM0/AS1A07_010T12_9000003582_24217cztM0_level2.evt | modeM0/AS1A07_010T12_9000003582_24217cztM0_level2_quad_clean.evt |
| Size (bytes) | 535,763,520 | 99,449,280 |
| Size | 510.9 MB | 94.8 MB |
| Events in quadrant A | 3,448,654 | 652,080 |
| Events in quadrant B | 3,551,235 | 663,425 |
| Events in quadrant C | 4,023,251 | 637,884 |
| Events in quadrant D | 4,772,061 | 615,097 |
| Mode M0 | |||
|---|---|---|---|
| Quadrant | BADHDUFLAG | Total packets | Discarded packets |
| A | 0 | 13918 | 2 |
| B | 0 | 14306 | 2 |
| C | 0 | 16198 | 2 |
| D | 0 | 18661 | 4 |
| Mode SS | |||
|---|---|---|---|
| Quadrant | BADHDUFLAG | Total packets | Discarded packets |
| A | 0 | 130 | 0 |
| B | 0 | 130 | 0 |
| C | 0 | 130 | 0 |
| D | 0 | 130 | 0 |
| Mode M9 | |||
|---|---|---|---|
| Quadrant | BADHDUFLAG | Total packets | Discarded packets |
| A | 0 | 15 | 0 |
| B | 0 | 16 | 0 |
| C | 0 | 16 | 0 |
| D | 0 | 16 | 0 |
| Quadrant | Total seconds | Saturated seconds | Saturation percentage |
|---|---|---|---|
| A | 6349 | 128 | 2.016066% |
| B | 6349 | 176 | 2.772090% |
| C | 6349 | 235 | 3.701370% |
| D | 6348 | 212 | 3.339635% |
Noise dominated data is calculated using 1-second bins in cleaned event files. If a bin has >2000 counts, and if more than 50% of those come from <1% of pixels, then it is considered to be noise-dominated and hence unusable.
| Quadrant | # 1 sec bins | Bins with >0 counts | Bins with >2000 counts | High rate bins dominated by noise | Noise dominated (total time) | Noise dominated (detector-on time) | Marked lightcurve |
|---|---|---|---|---|---|---|---|
| A | 7659 | 6350 | 0 | 0 | 0.00% | 0.00% | 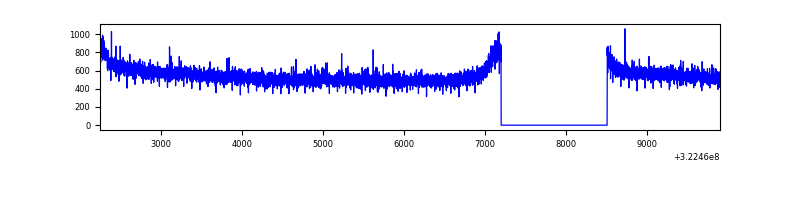 |
| B | 7659 | 6349 | 6 | 6 | 0.08% | 0.09% | 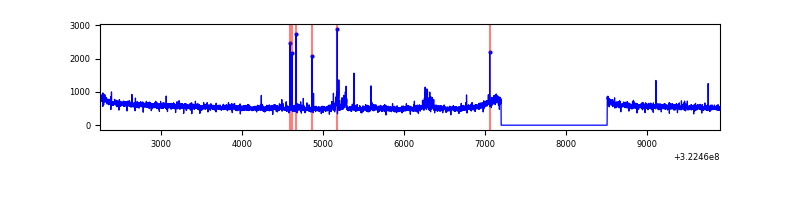 |
| C | 7659 | 6349 | 0 | 0 | 0.00% | 0.00% | 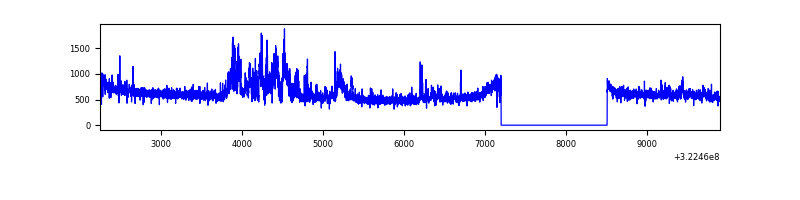 |
| D | 7658 | 6348 | 106 | 106 | 1.38% | 1.67% | 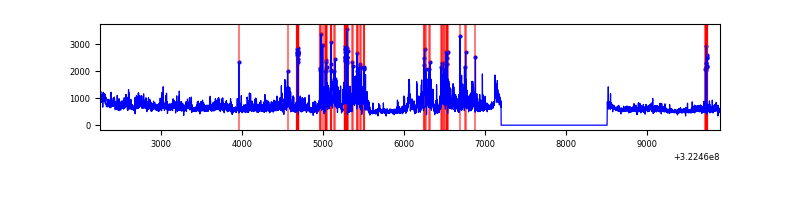 |
Top three noisy pixels from each quadrant. If the there are fewer than three noisy pixels in the level2.evt file, extra rows are filled as -1
| Pixel properties | Quadrant properties | ||||||
|---|---|---|---|---|---|---|---|
| Quadrant | DetID | PixID | Counts | Sigma | Mean | Median | Sigma |
| A | 13 | 254 | 10292 | 53.57 | 894 | 879 | 175.7 |
| A | 0 | 226 | 7967 | 40.34 | 894 | 879 | 175.7 |
| A | 3 | 137 | 6979 | 34.72 | 894 | 879 | 175.7 |
| B | 15 | 33 | 51103 | 313.04 | 884 | 867 | 160.5 |
| B | 12 | 111 | 18056 | 107.11 | 884 | 867 | 160.5 |
| B | 11 | 111 | 16207 | 95.59 | 884 | 867 | 160.5 |
| C | 7 | 247 | 483614 | 2487.58 | 862 | 871 | 194.1 |
| C | 14 | 238 | 142166 | 728.1 | 862 | 871 | 194.1 |
| C | 2 | 16 | 32611 | 163.56 | 862 | 871 | 194.1 |
| D | 8 | 195 | 920959 | 4427.48 | 870 | 847 | 207.8 |
| D | 7 | 238 | 384445 | 1845.83 | 870 | 847 | 207.8 |
| D | 12 | 218 | 73516 | 349.68 | 870 | 847 | 207.8 |
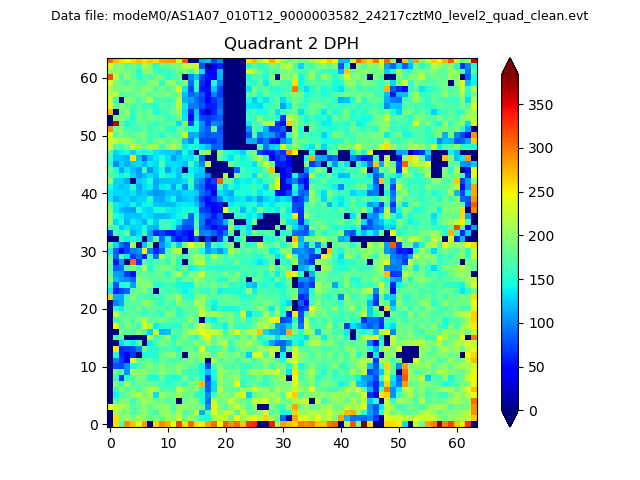
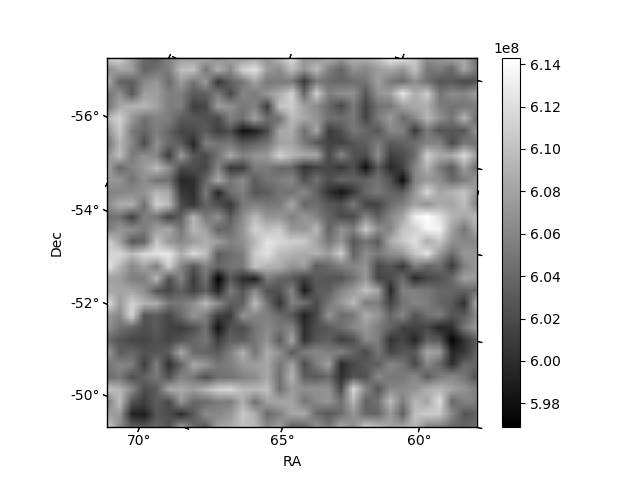
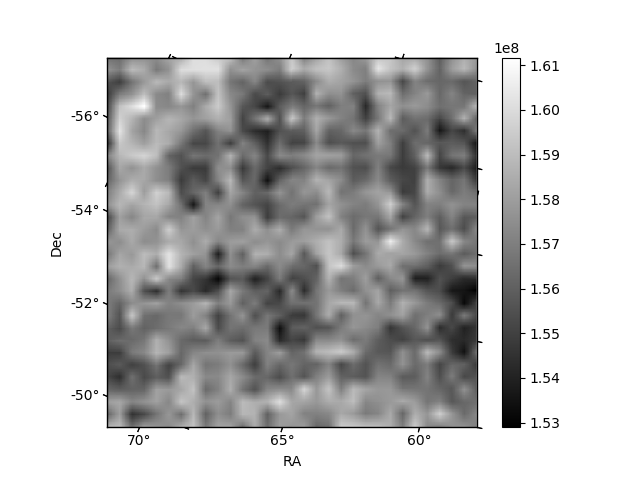
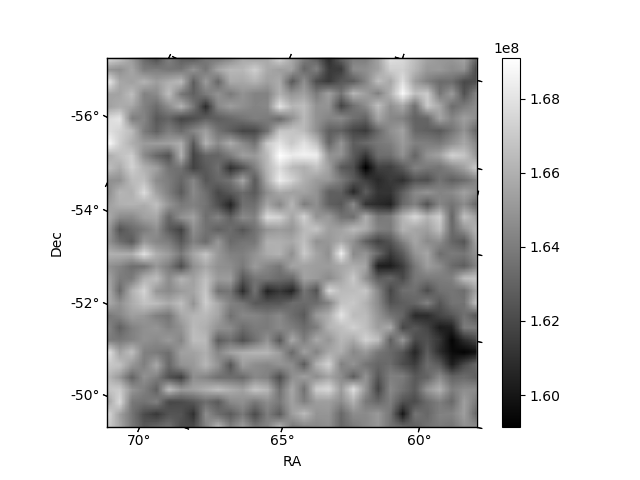
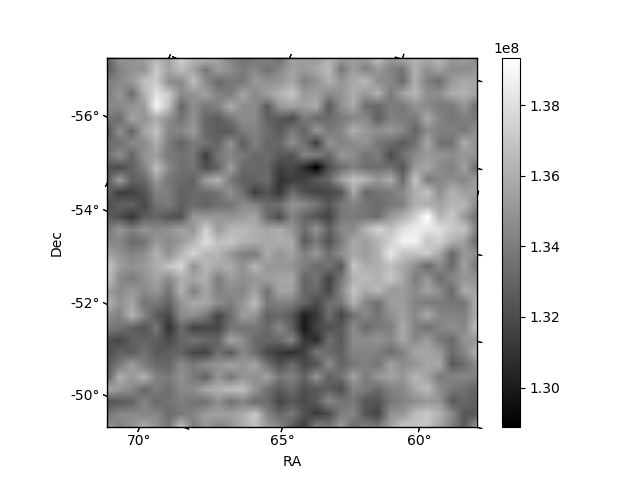
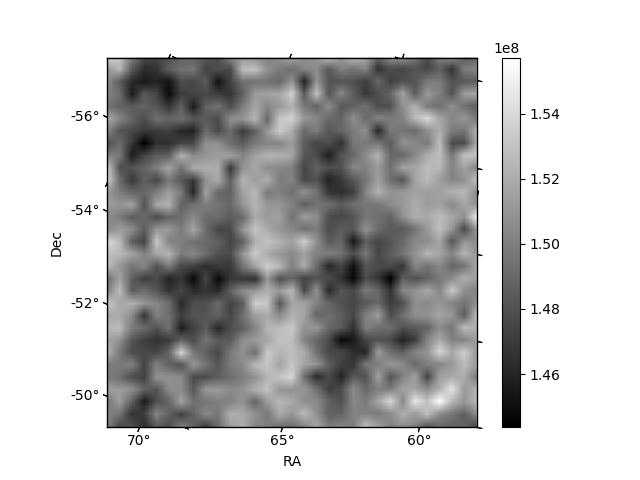
Histogram calculated using DETX and DETY for each event in the final _common_clean file
| Quadrant A | 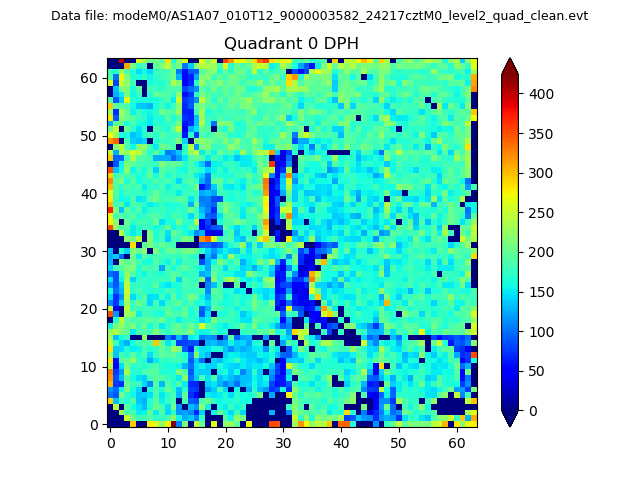 |
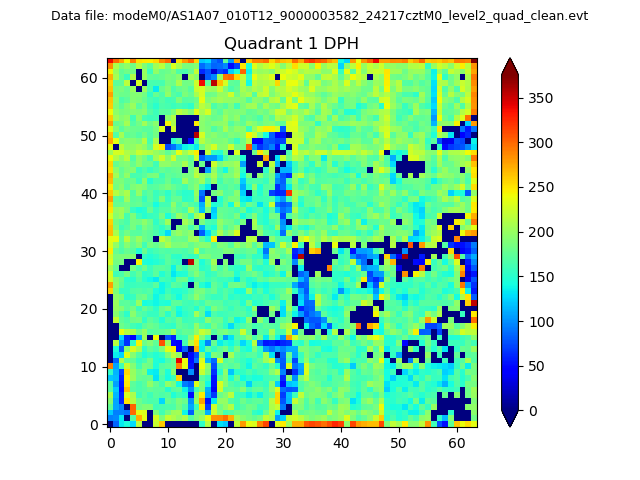 |
Quadrant B |
|---|---|---|---|
| Quadrant D | 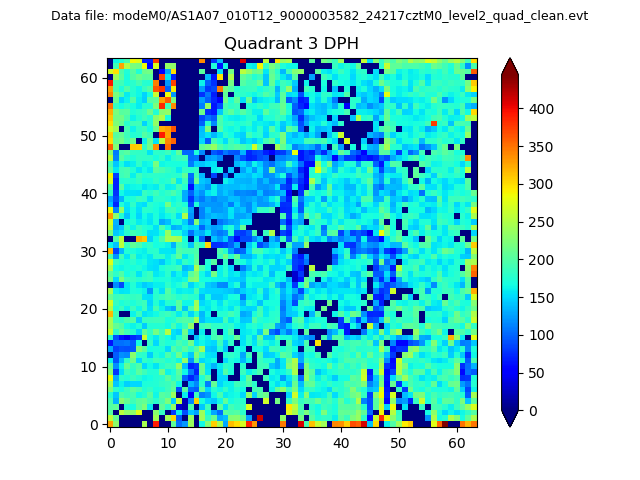 |
 |
Quadrant C |
| Plot type | Count rate plots | Images |
|---|---|---|
| Comparison with Poisson distribution Blue bars denote a histogram of data divided into 1 sec bins. Red curve is a Poisson curve with rate = median count rate of data. |
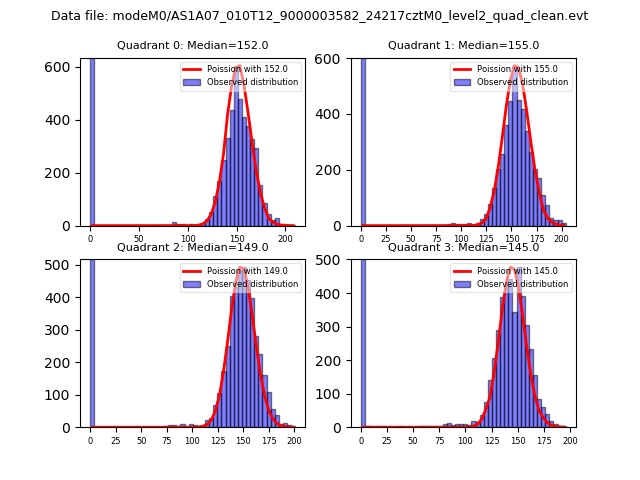 |
 |
| Quadrant-wise count rates Data is divided into 100 sec bins |
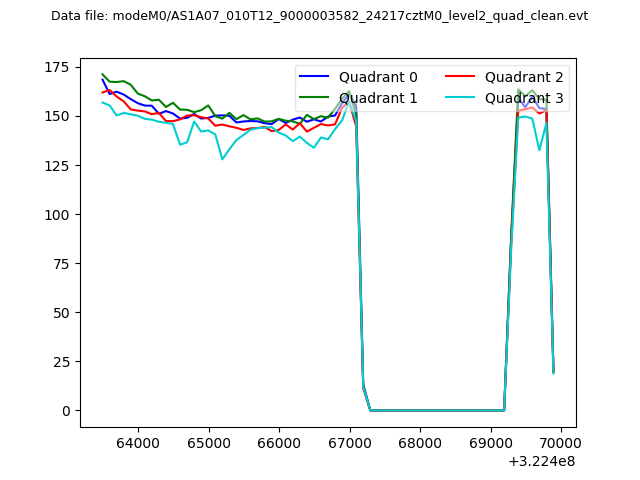 |
|
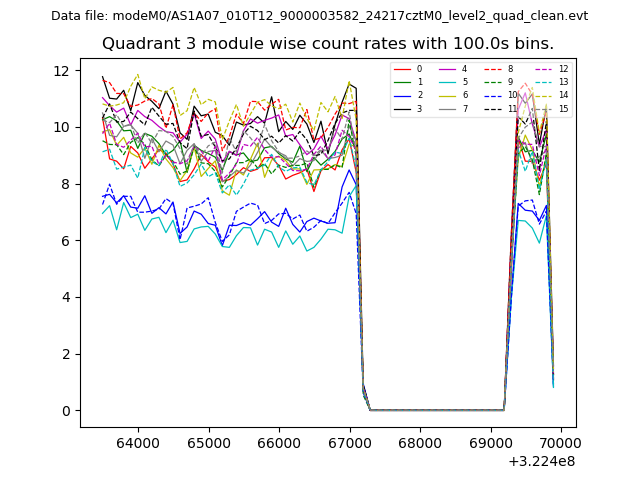
| Module-wise count rates for Quadrant A Data is divided into 100 sec bins |
 |
 |
| Module-wise count rates for Quadrant B Data is divided into 100 sec bins |
 |
 |
| Module-wise count rates for Quadrant C Data is divided into 100 sec bins |
 |
 |
| Module-wise count rates for Quadrant D Data is divided into 100 sec bins |
 |
 |
| Parameter | Plot |
|---|---|
| CZT HV Monitor |  |
| D_VDD | 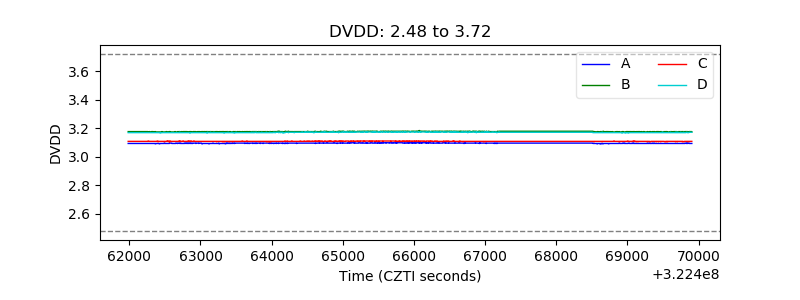 |
| Temperature 1 | 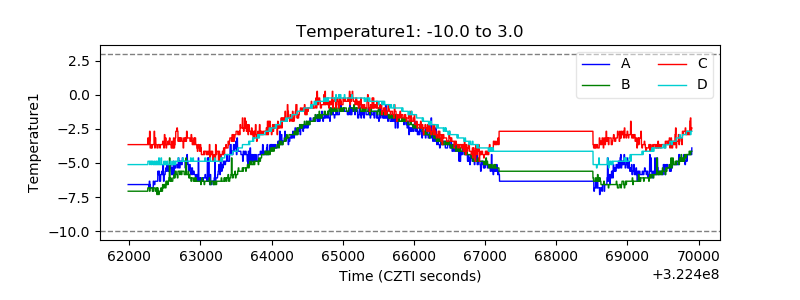 |
| Veto HV Monitor | 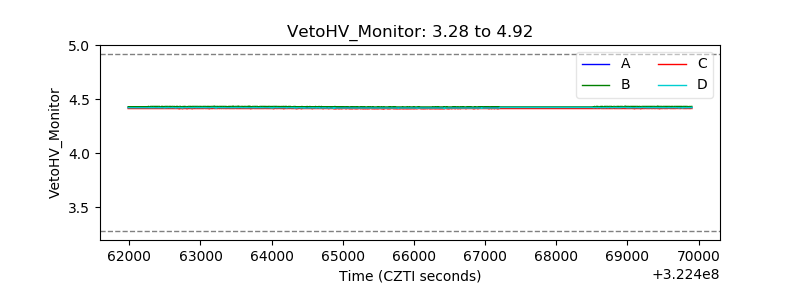 |
| Veto LLD | 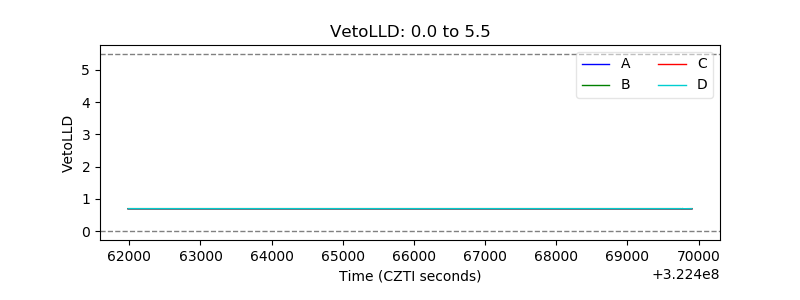 |
| Alpha Counter | 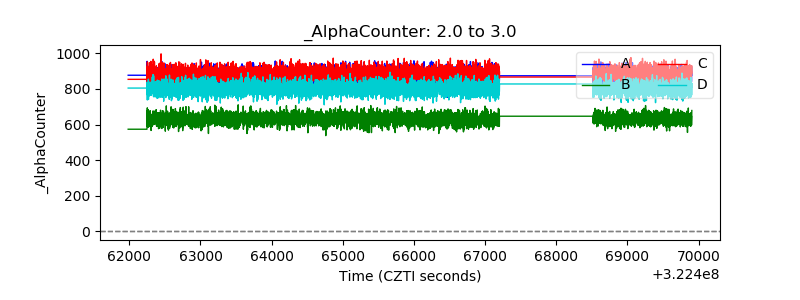 |
| _CPM_Rate | 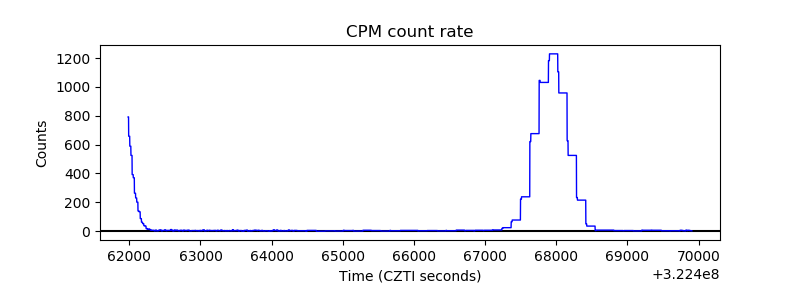 |
| CZT Counter | 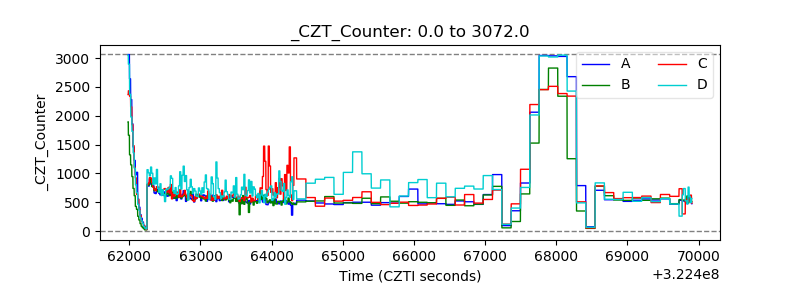 |
| +2.5 Volts monitor |  |
| +5 Volts monitor |  |
| _ROLL_ROT | 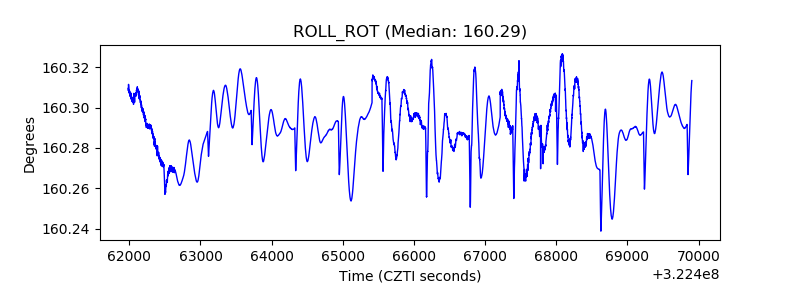 |
| _Roll_DEC | 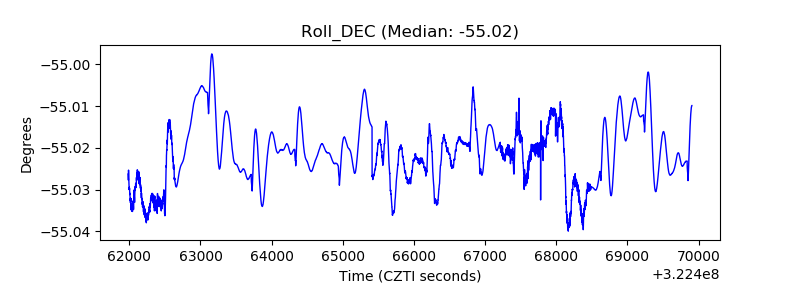 |
| _Roll_RA | 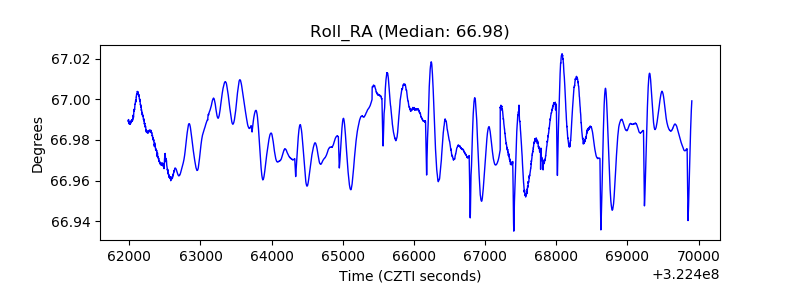 |
| Veto Counter |  |