| Param | Original file | Final file |
|---|---|---|
| Filename | modeM0/AS1A07_010T12_9000003582_24218cztM0_level2.evt | modeM0/AS1A07_010T12_9000003582_24218cztM0_level2_quad_clean.evt |
| Size (bytes) | 464,195,520 | 109,368,000 |
| Size | 442.7 MB | 104.3 MB |
| Events in quadrant A | 3,129,371 | 732,642 |
| Events in quadrant B | 3,331,015 | 738,109 |
| Events in quadrant C | 3,644,583 | 710,844 |
| Events in quadrant D | 3,533,951 | 699,774 |
| Mode M0 | |||
|---|---|---|---|
| Quadrant | BADHDUFLAG | Total packets | Discarded packets |
| A | 0 | 12840 | 1 |
| B | 0 | 13429 | 1 |
| C | 0 | 14560 | 1 |
| D | 0 | 14348 | 1 |
| Mode SS | |||
|---|---|---|---|
| Quadrant | BADHDUFLAG | Total packets | Discarded packets |
| A | 0 | 126 | 0 |
| B | 0 | 126 | 0 |
| C | 0 | 126 | 0 |
| D | 0 | 126 | 0 |
| Mode M9 | |||
|---|---|---|---|
| Quadrant | BADHDUFLAG | Total packets | Discarded packets |
| A | 0 | 11 | 0 |
| B | 0 | 11 | 0 |
| C | 0 | 11 | 0 |
| D | 0 | 11 | 0 |
| Quadrant | Total seconds | Saturated seconds | Saturation percentage |
|---|---|---|---|
| A | 6172 | 95 | 1.539209% |
| B | 6173 | 144 | 2.332739% |
| C | 6173 | 180 | 2.915924% |
| D | 6173 | 112 | 1.814353% |
Noise dominated data is calculated using 1-second bins in cleaned event files. If a bin has >2000 counts, and if more than 50% of those come from <1% of pixels, then it is considered to be noise-dominated and hence unusable.
| Quadrant | # 1 sec bins | Bins with >0 counts | Bins with >2000 counts | High rate bins dominated by noise | Noise dominated (total time) | Noise dominated (detector-on time) | Marked lightcurve |
|---|---|---|---|---|---|---|---|
| A | 7267 | 6172 | 0 | 0 | 0.00% | 0.00% | 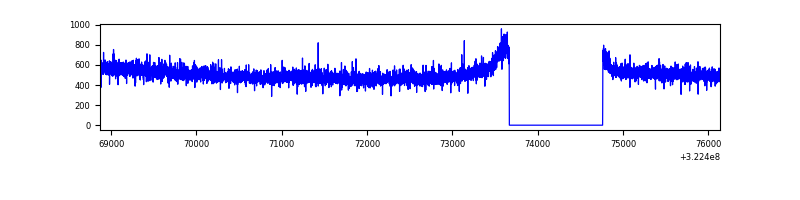 |
| B | 7268 | 6173 | 27 | 27 | 0.37% | 0.44% | 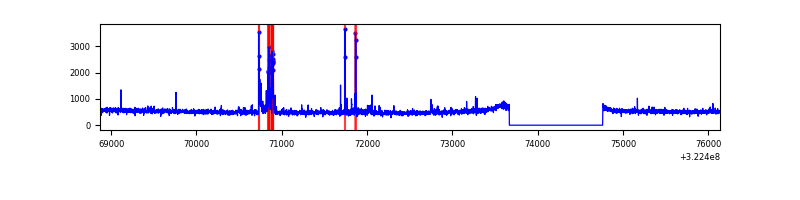 |
| C | 7268 | 6173 | 32 | 32 | 0.44% | 0.52% | 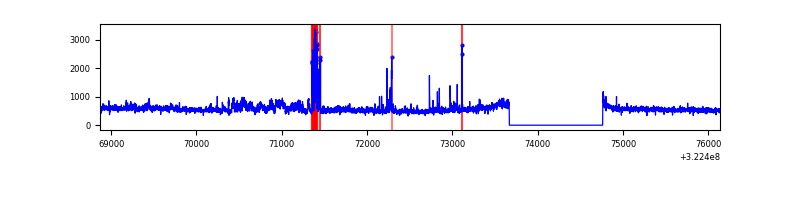 |
| D | 7268 | 6173 | 16 | 16 | 0.22% | 0.26% | 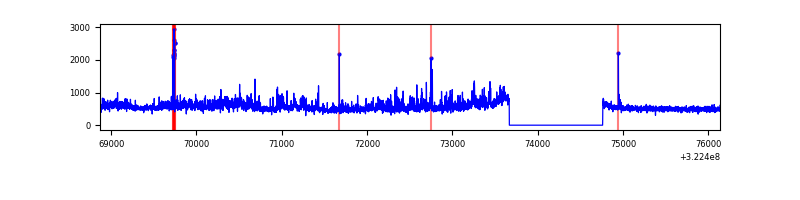 |
Top three noisy pixels from each quadrant. If the there are fewer than three noisy pixels in the level2.evt file, extra rows are filled as -1
| Pixel properties | Quadrant properties | ||||||
|---|---|---|---|---|---|---|---|
| Quadrant | DetID | PixID | Counts | Sigma | Mean | Median | Sigma |
| A | 13 | 254 | 10383 | 59.74 | 810 | 794 | 160.5 |
| A | 0 | 226 | 7177 | 39.77 | 810 | 794 | 160.5 |
| A | 3 | 137 | 6766 | 37.21 | 810 | 794 | 160.5 |
| B | 12 | 17 | 119054 | 795.14 | 800 | 781 | 148.7 |
| B | 0 | 229 | 32127 | 210.74 | 800 | 781 | 148.7 |
| B | 4 | 52 | 18877 | 121.66 | 800 | 781 | 148.7 |
| C | 7 | 247 | 316127 | 1773.81 | 775 | 781 | 177.8 |
| C | 2 | 16 | 175381 | 982.12 | 775 | 781 | 177.8 |
| C | 14 | 238 | 124216 | 694.32 | 775 | 781 | 177.8 |
| D | 8 | 195 | 386970 | 2036.14 | 792 | 769 | 189.7 |
| D | 1 | 52 | 50320 | 261.24 | 792 | 769 | 189.7 |
| D | 12 | 233 | 46548 | 241.36 | 792 | 769 | 189.7 |
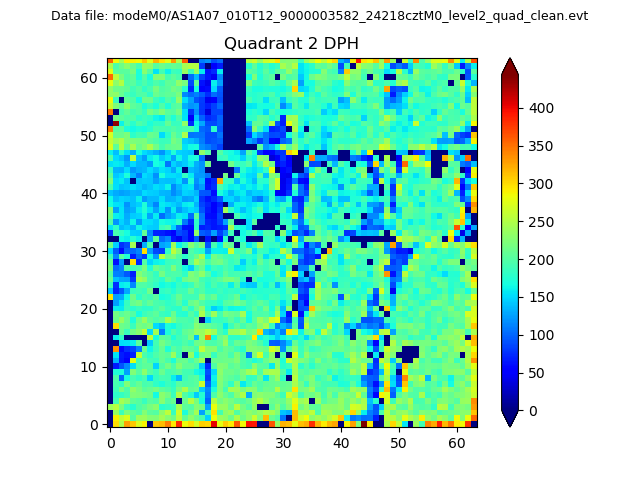
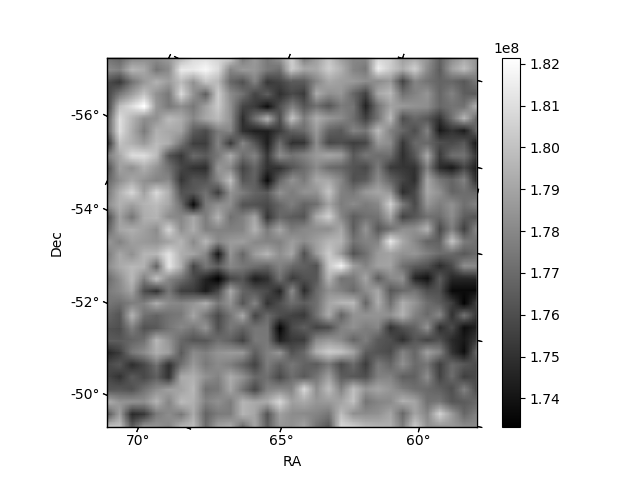
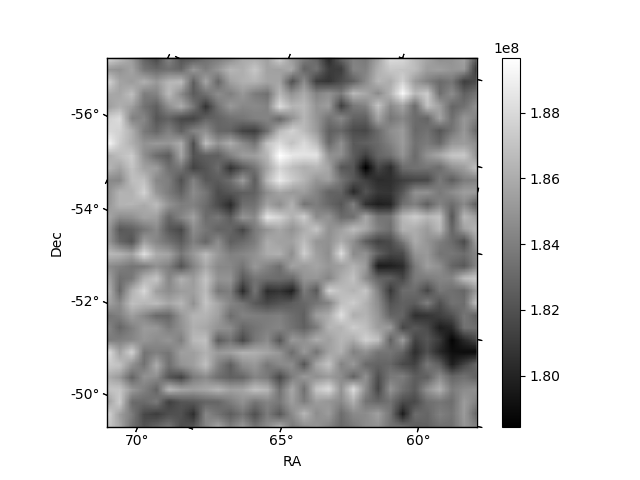
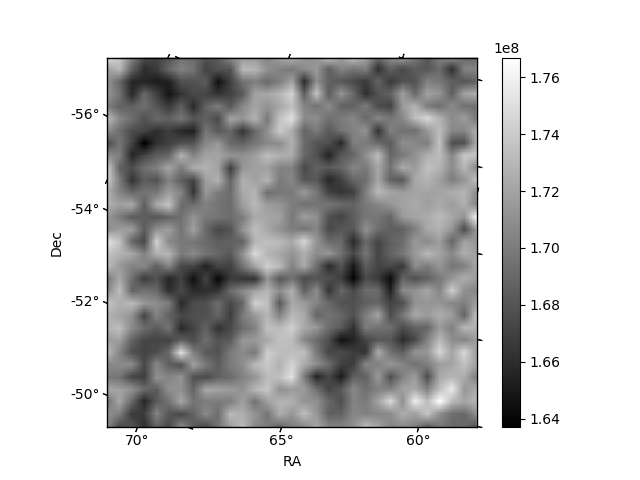
Histogram calculated using DETX and DETY for each event in the final _common_clean file
| Quadrant A | 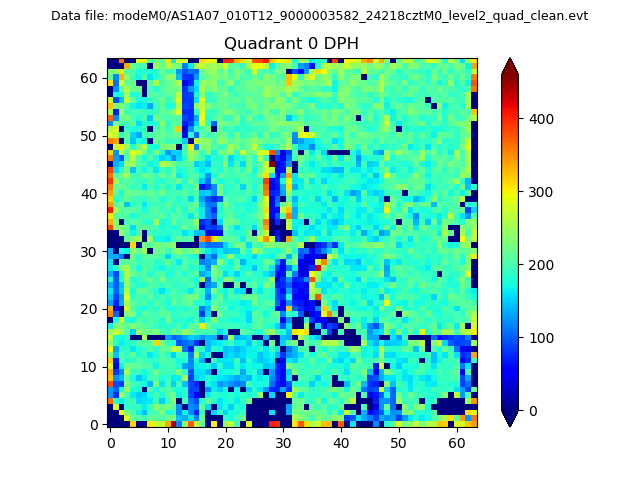 |
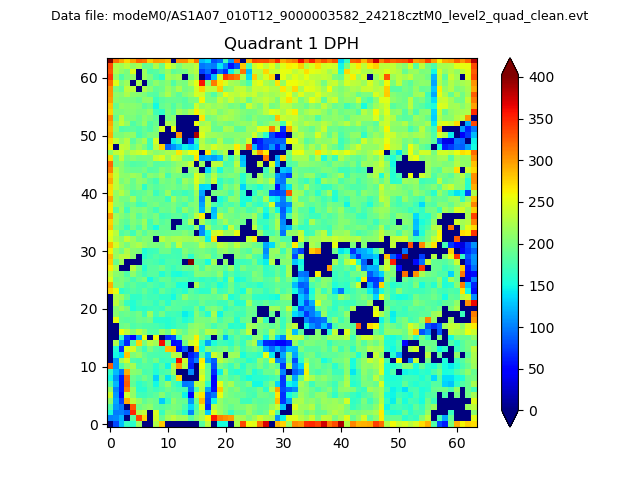 |
Quadrant B |
|---|---|---|---|
| Quadrant D | 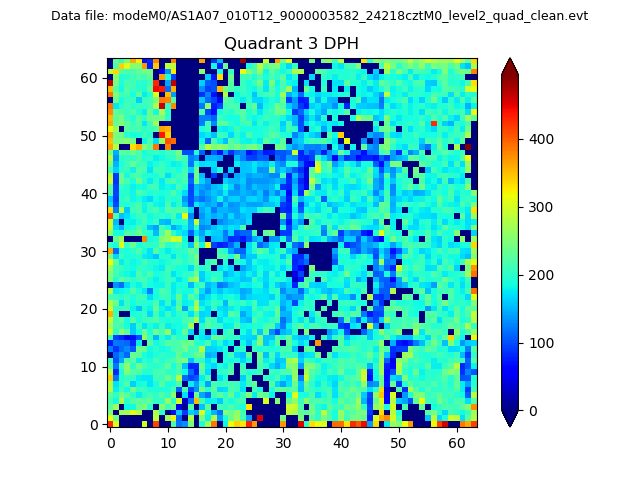 |
 |
Quadrant C |
| Plot type | Count rate plots | Images |
|---|---|---|
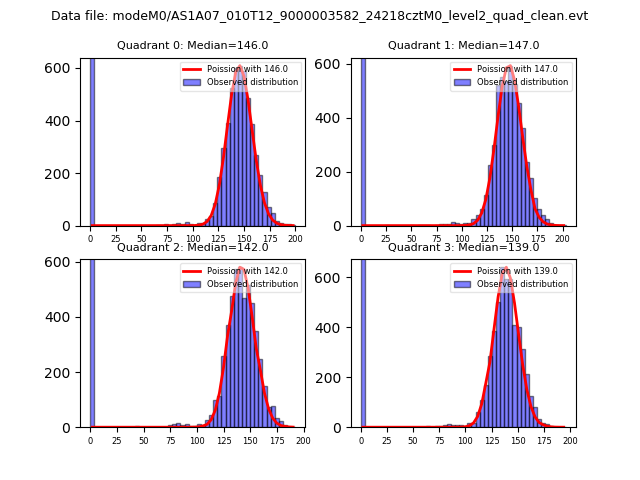
| Comparison with Poisson distribution Blue bars denote a histogram of data divided into 1 sec bins. Red curve is a Poisson curve with rate = median count rate of data. |
 |
 |
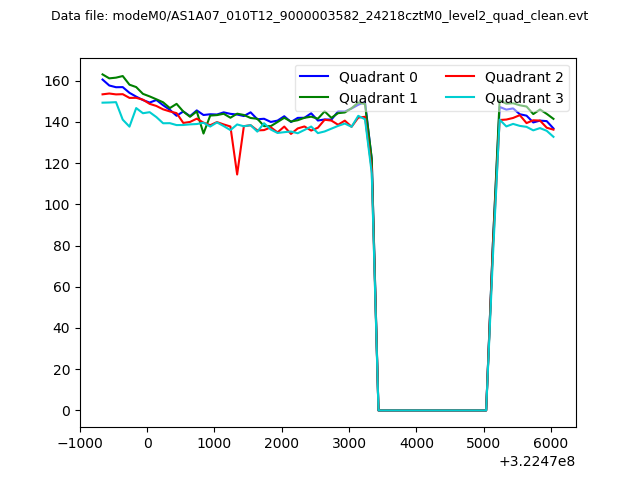
| Quadrant-wise count rates Data is divided into 100 sec bins |
 |
|
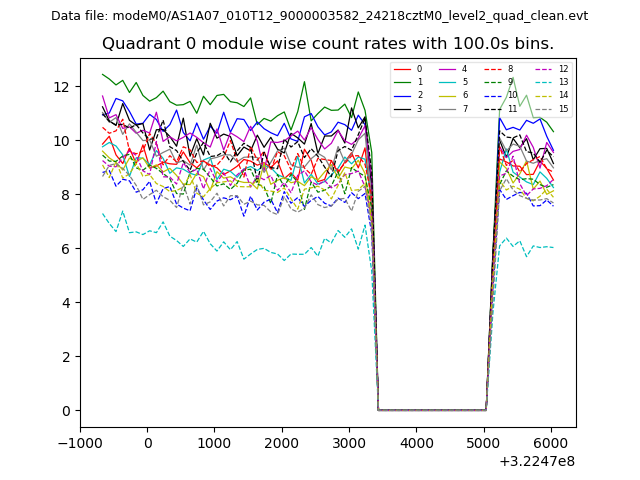
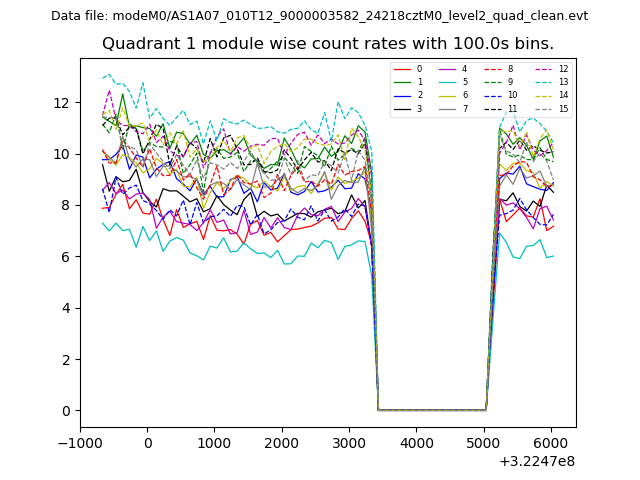
| Module-wise count rates for Quadrant A Data is divided into 100 sec bins |
 |
 |
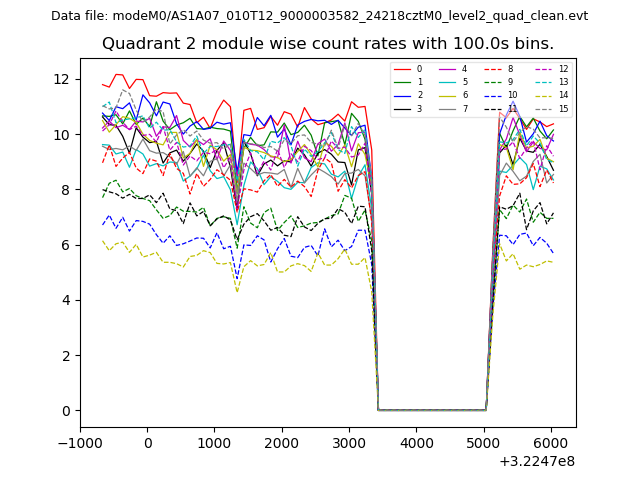
| Module-wise count rates for Quadrant B Data is divided into 100 sec bins |
 |
 |
| Module-wise count rates for Quadrant C Data is divided into 100 sec bins |
 |
 |
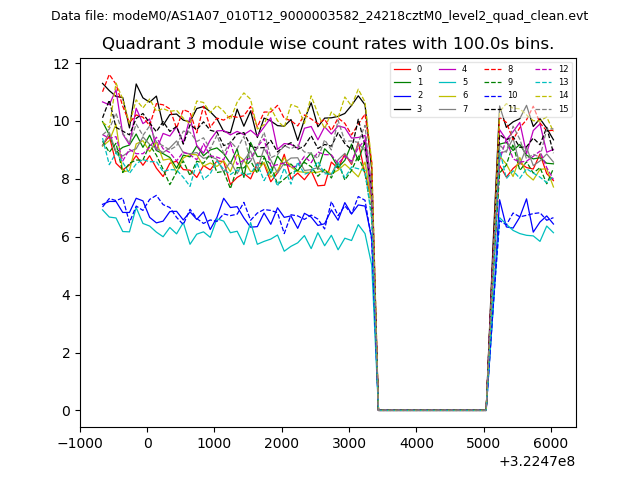
| Module-wise count rates for Quadrant D Data is divided into 100 sec bins |
 |
 |
| Parameter | Plot |
|---|---|
| CZT HV Monitor | 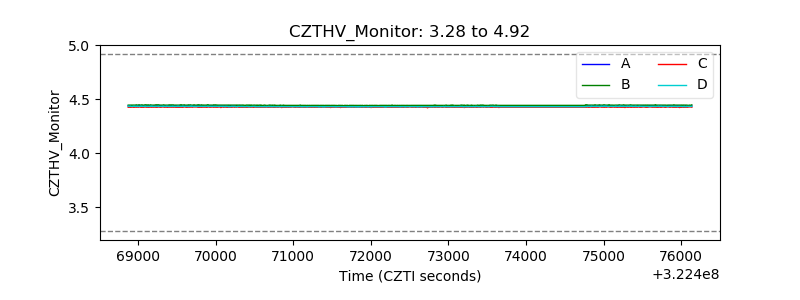 |
| D_VDD | 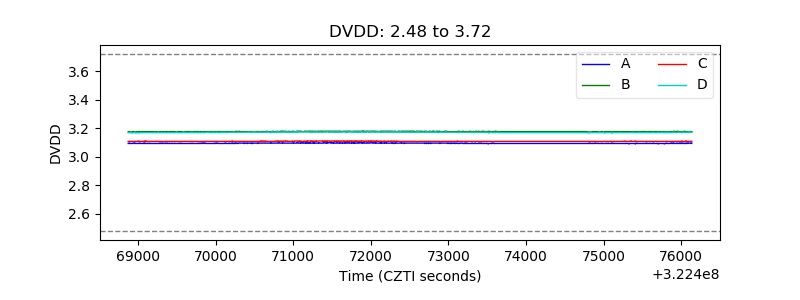 |
| Temperature 1 | 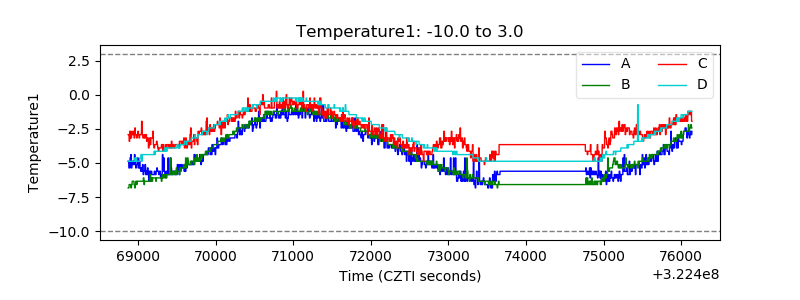 |
| Veto HV Monitor | 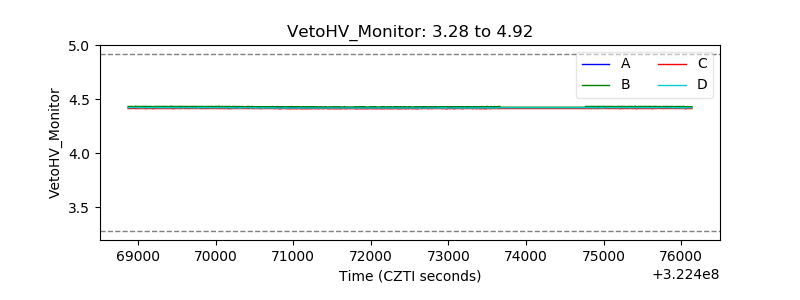 |
| Veto LLD |  |
| Alpha Counter | 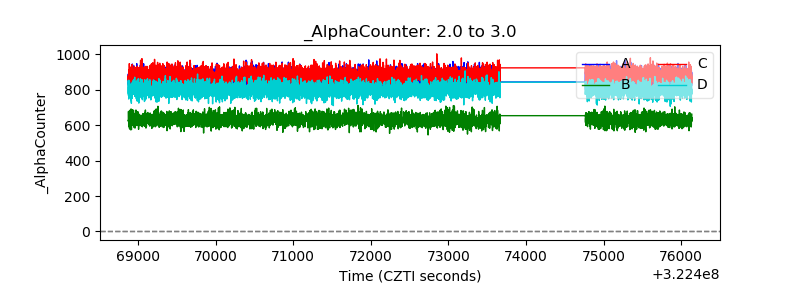 |
| _CPM_Rate | 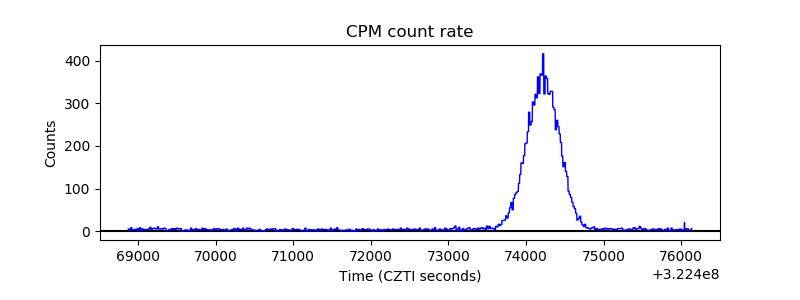 |
| CZT Counter | 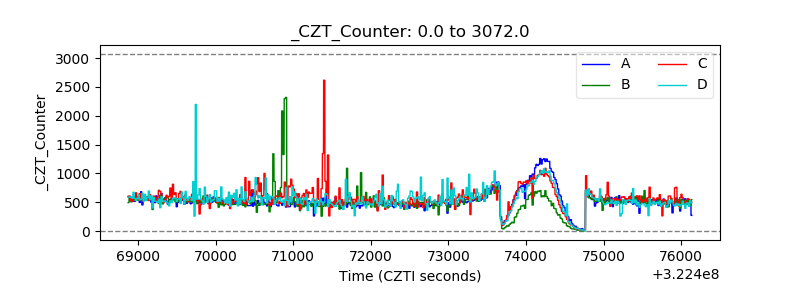 |
| +2.5 Volts monitor |  |
| +5 Volts monitor |  |
| _ROLL_ROT | 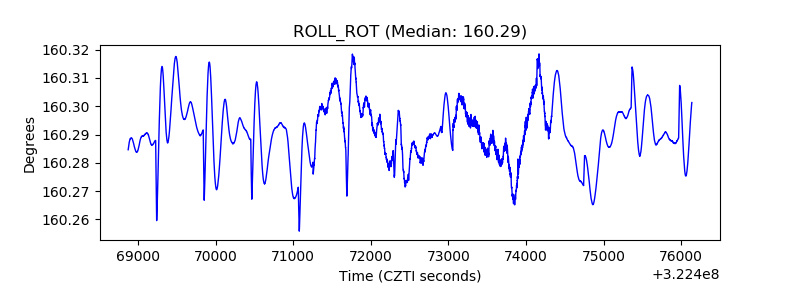 |
| _Roll_DEC | 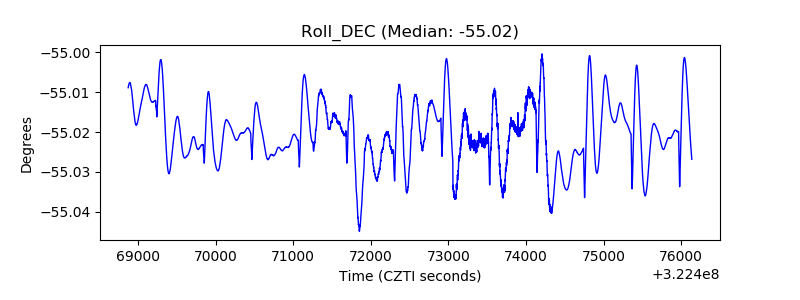 |
| _Roll_RA | 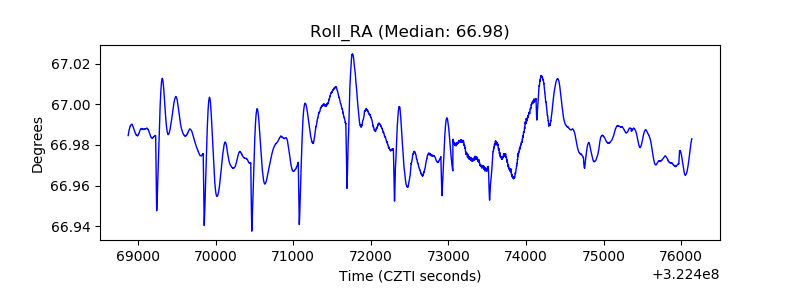 |
| Veto Counter | 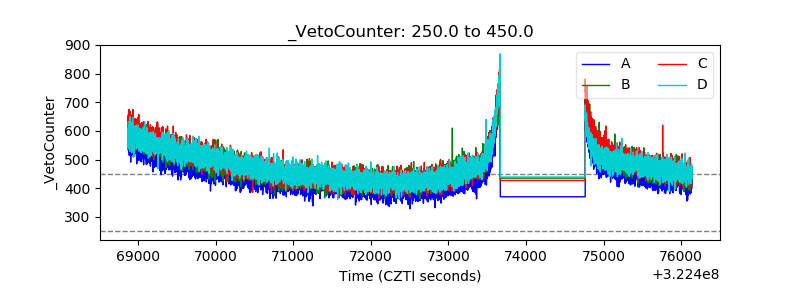 |