| Param | Original file | Final file |
|---|---|---|
| Filename | modeM0/AS1A07_010T12_9000003582_24219cztM0_level2.evt | modeM0/AS1A07_010T12_9000003582_24219cztM0_level2_quad_clean.evt |
| Size (bytes) | 467,844,480 | 111,588,480 |
| Size | 446.2 MB | 106.4 MB |
| Events in quadrant A | 3,153,624 | 743,086 |
| Events in quadrant B | 3,560,916 | 746,380 |
| Events in quadrant C | 3,345,308 | 725,360 |
| Events in quadrant D | 3,666,133 | 710,403 |
| Mode M0 | |||
|---|---|---|---|
| Quadrant | BADHDUFLAG | Total packets | Discarded packets |
| A | 0 | 13378 | 1 |
| B | 0 | 14566 | 1 |
| C | 0 | 13727 | 1 |
| D | 0 | 14971 | 1 |
| Mode SS | |||
|---|---|---|---|
| Quadrant | BADHDUFLAG | Total packets | Discarded packets |
| A | 0 | 132 | 0 |
| B | 0 | 132 | 0 |
| C | 0 | 132 | 0 |
| D | 0 | 132 | 0 |
| Mode M9 | |||
|---|---|---|---|
| Quadrant | BADHDUFLAG | Total packets | Discarded packets |
| A | 0 | 7 | 0 |
| B | 0 | 7 | 0 |
| C | 0 | 7 | 0 |
| D | 0 | 7 | 0 |
| Quadrant | Total seconds | Saturated seconds | Saturation percentage |
|---|---|---|---|
| A | 6515 | 84 | 1.289332% |
| B | 6516 | 233 | 3.575813% |
| C | 6516 | 121 | 1.856967% |
| D | 6516 | 115 | 1.764886% |
Noise dominated data is calculated using 1-second bins in cleaned event files. If a bin has >2000 counts, and if more than 50% of those come from <1% of pixels, then it is considered to be noise-dominated and hence unusable.
| Quadrant | # 1 sec bins | Bins with >0 counts | Bins with >2000 counts | High rate bins dominated by noise | Noise dominated (total time) | Noise dominated (detector-on time) | Marked lightcurve |
|---|---|---|---|---|---|---|---|
| A | 7225 | 6515 | 0 | 0 | 0.00% | 0.00% | 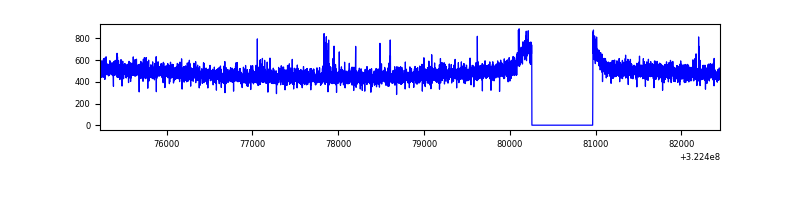 |
| B | 7226 | 6516 | 74 | 74 | 1.02% | 1.14% | 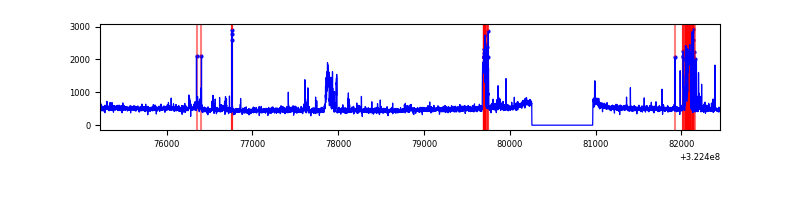 |
| C | 7226 | 6516 | 0 | 0 | 0.00% | 0.00% | 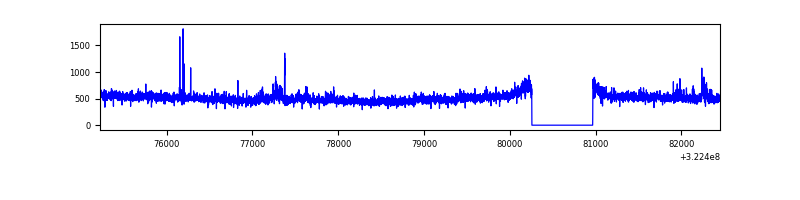 |
| D | 7226 | 6517 | 52 | 52 | 0.72% | 0.80% | 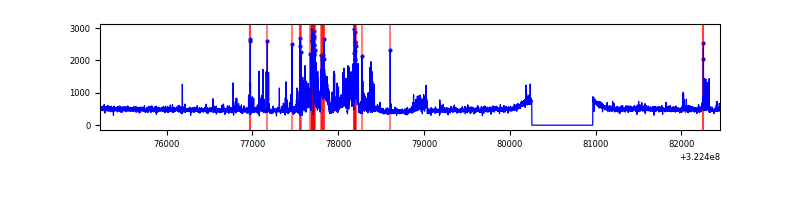 |
Top three noisy pixels from each quadrant. If the there are fewer than three noisy pixels in the level2.evt file, extra rows are filled as -1
| Pixel properties | Quadrant properties | ||||||
|---|---|---|---|---|---|---|---|
| Quadrant | DetID | PixID | Counts | Sigma | Mean | Median | Sigma |
| A | 3 | 1 | 13217 | 75.8 | 812 | 795 | 163.9 |
| A | 13 | 254 | 10583 | 59.72 | 812 | 795 | 163.9 |
| A | 0 | 23 | 10567 | 59.63 | 812 | 795 | 163.9 |
| B | 12 | 17 | 262468 | 1754.1 | 797 | 778 | 149.2 |
| B | 0 | 245 | 98051 | 652.02 | 797 | 778 | 149.2 |
| B | 0 | 190 | 21937 | 141.83 | 797 | 778 | 149.2 |
| C | 7 | 247 | 157659 | 872.02 | 775 | 781 | 179.9 |
| C | 14 | 238 | 124354 | 686.89 | 775 | 781 | 179.9 |
| C | 2 | 16 | 38351 | 208.84 | 775 | 781 | 179.9 |
| D | 7 | 238 | 429258 | 2240.32 | 791 | 767 | 191.3 |
| D | 1 | 52 | 108812 | 564.9 | 791 | 767 | 191.3 |
| D | 8 | 195 | 73603 | 380.82 | 791 | 767 | 191.3 |
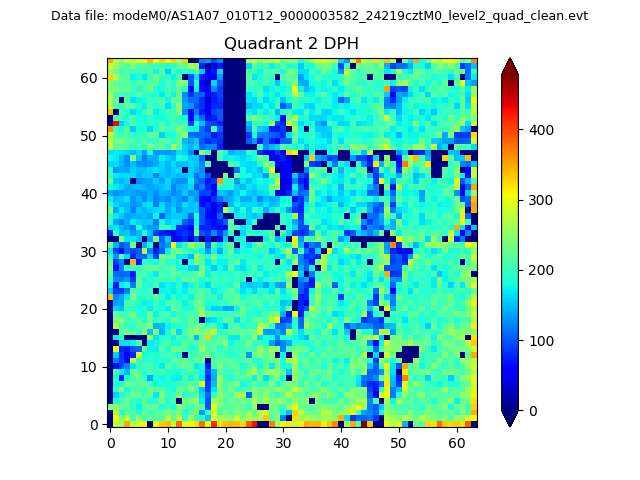
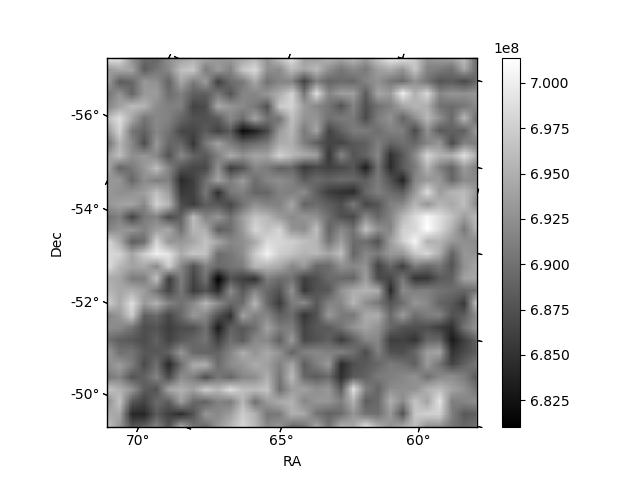
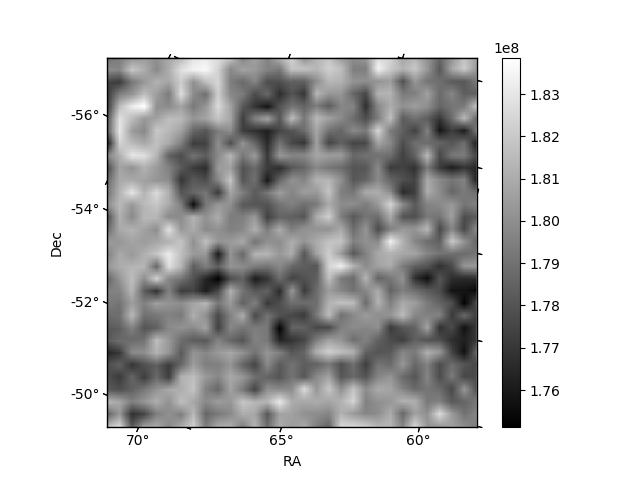
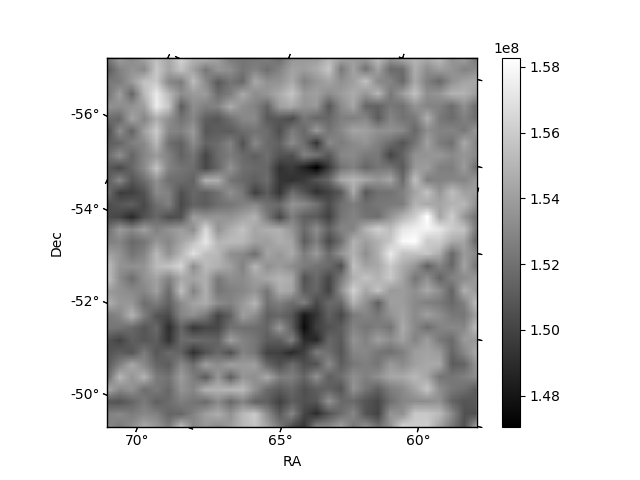
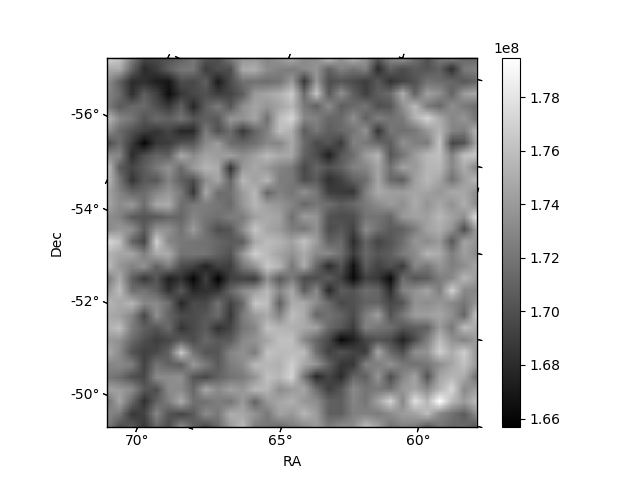
Histogram calculated using DETX and DETY for each event in the final _common_clean file
| Quadrant A | 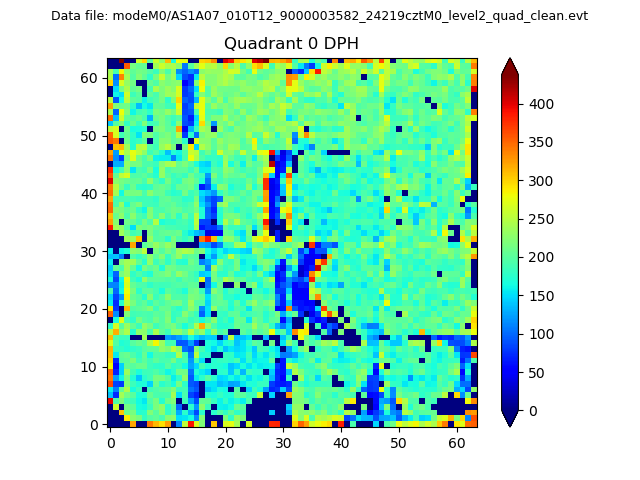 |
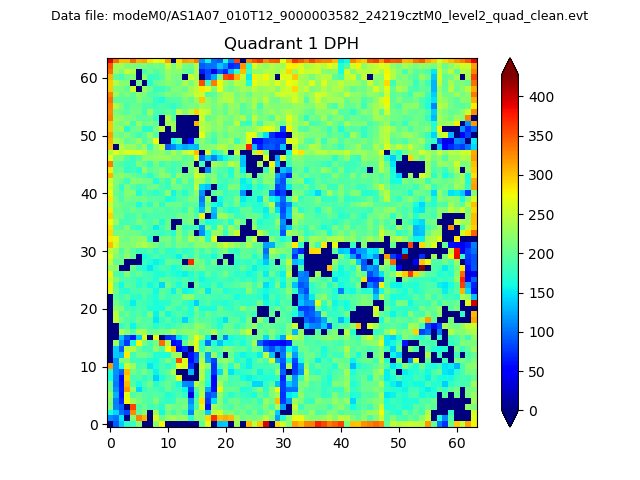 |
Quadrant B |
|---|---|---|---|
| Quadrant D | 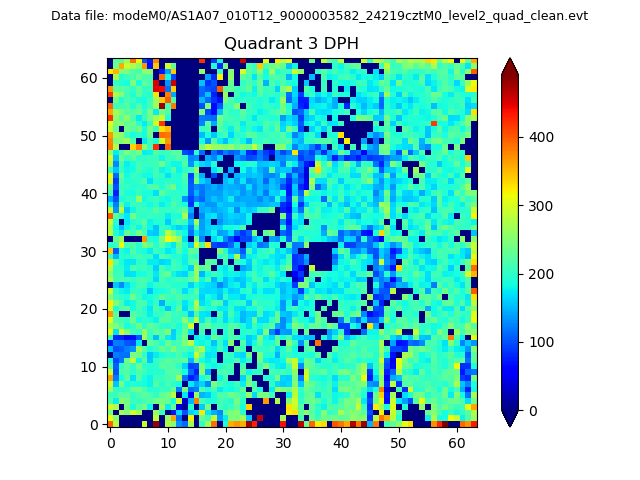 |
 |
Quadrant C |
| Plot type | Count rate plots | Images |
|---|---|---|
| Comparison with Poisson distribution Blue bars denote a histogram of data divided into 1 sec bins. Red curve is a Poisson curve with rate = median count rate of data. |
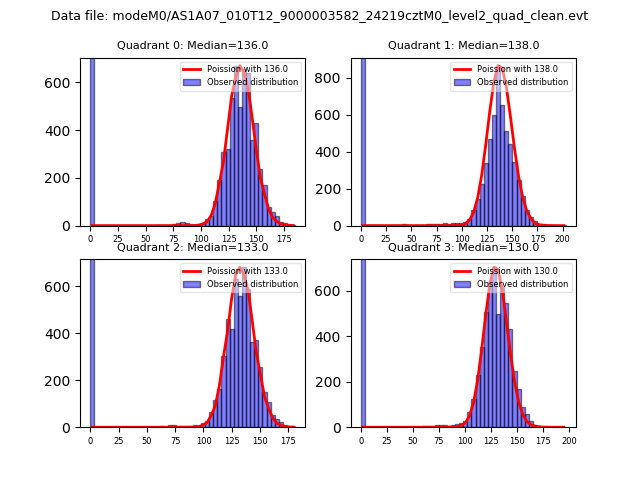 |
 |
| Quadrant-wise count rates Data is divided into 100 sec bins |
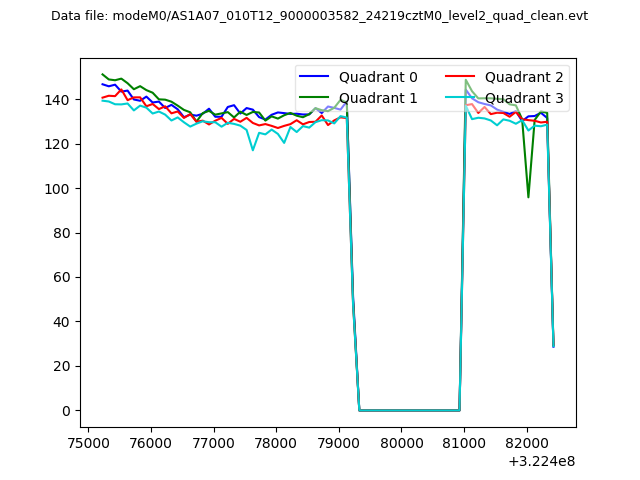 |
|
| Module-wise count rates for Quadrant A Data is divided into 100 sec bins |
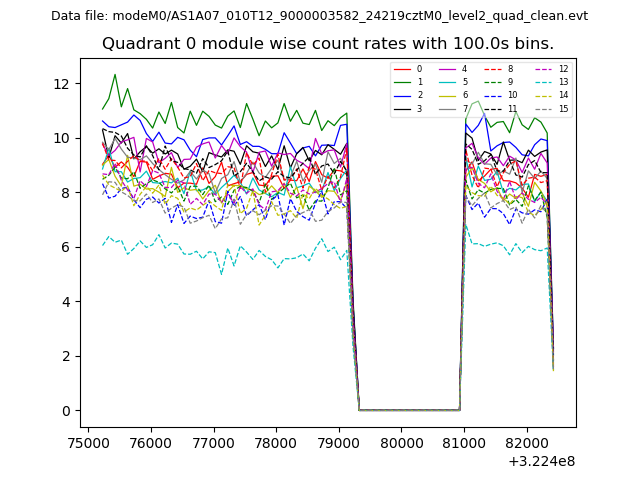 |
 |
| Module-wise count rates for Quadrant B Data is divided into 100 sec bins |
 |
 |
| Module-wise count rates for Quadrant C Data is divided into 100 sec bins |
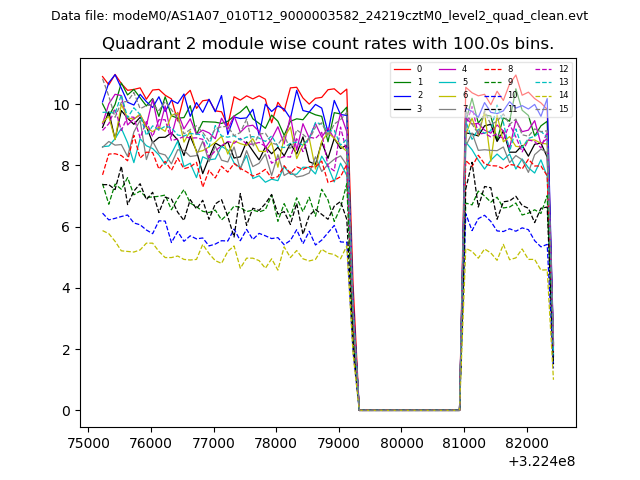 |
 |
| Module-wise count rates for Quadrant D Data is divided into 100 sec bins |
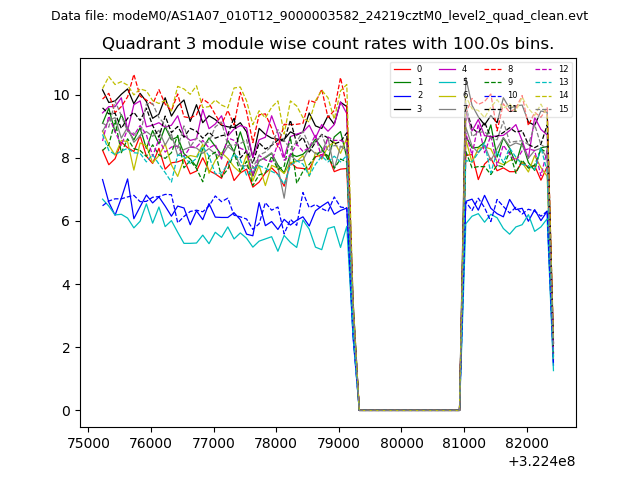 |
 |
| Parameter | Plot |
|---|---|
| CZT HV Monitor | 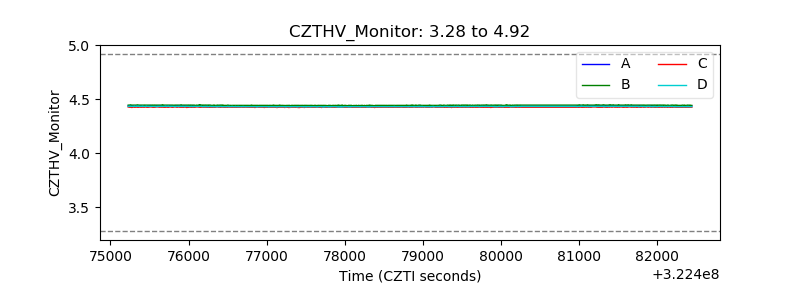 |
| D_VDD | 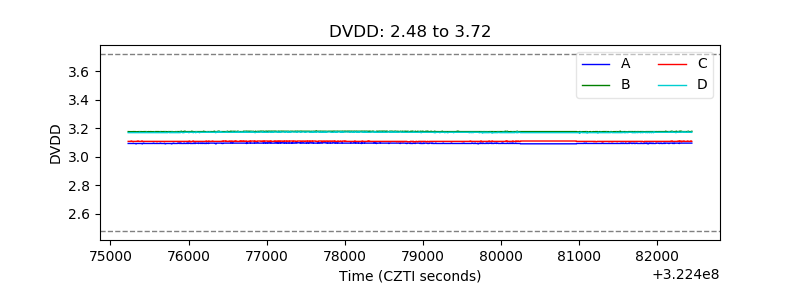 |
| Temperature 1 | 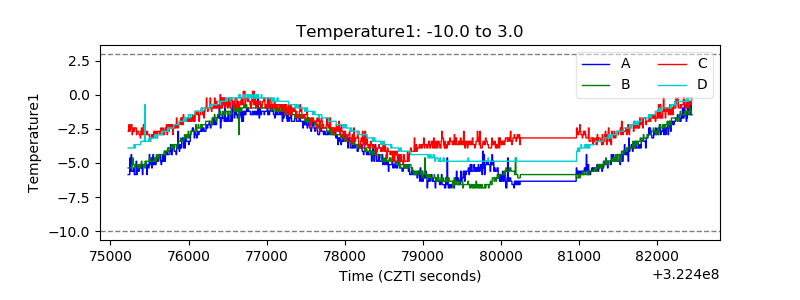 |
| Veto HV Monitor | 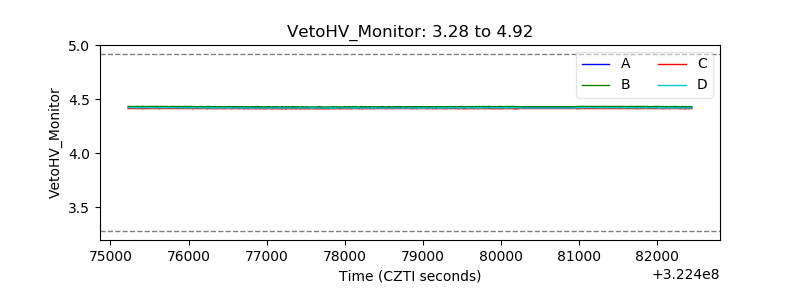 |
| Veto LLD | 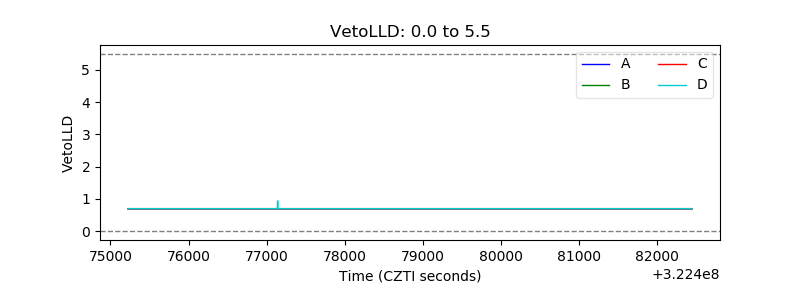 |
| Alpha Counter | 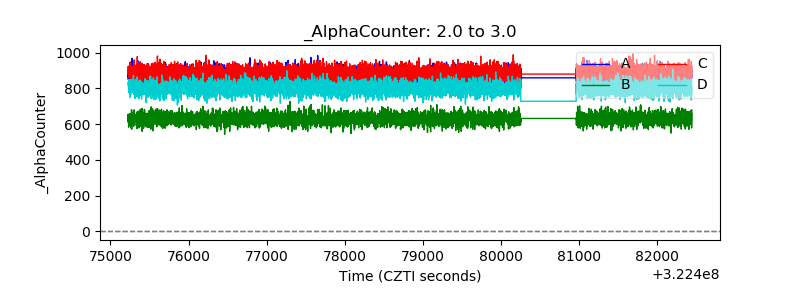 |
| _CPM_Rate | 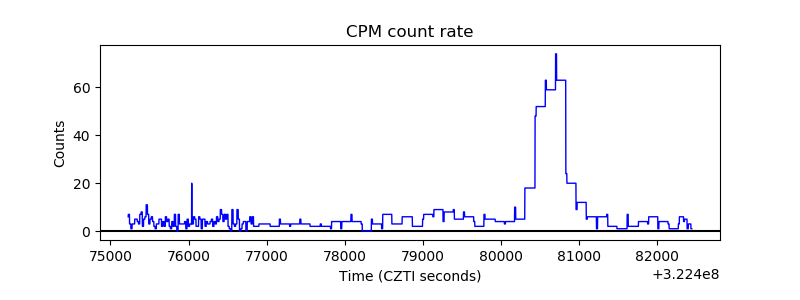 |
| CZT Counter | 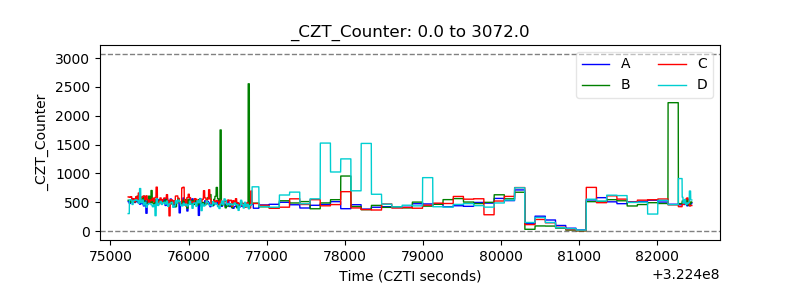 |
| +2.5 Volts monitor |  |
| +5 Volts monitor |  |
| _ROLL_ROT | 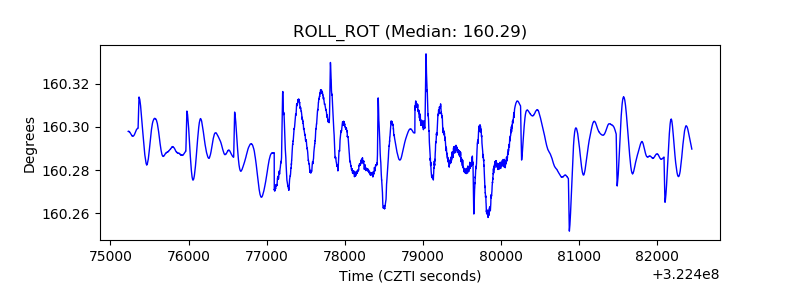 |
| _Roll_DEC |  |
| _Roll_RA | 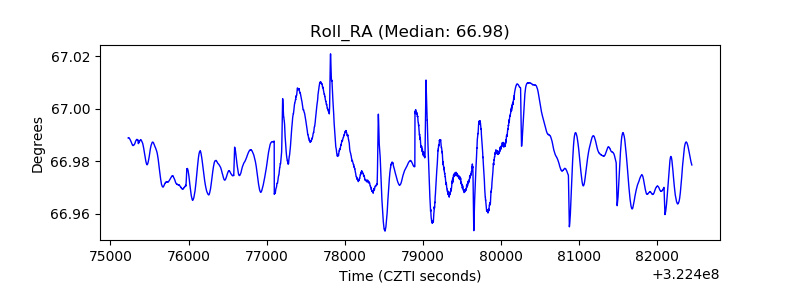 |
| Veto Counter | 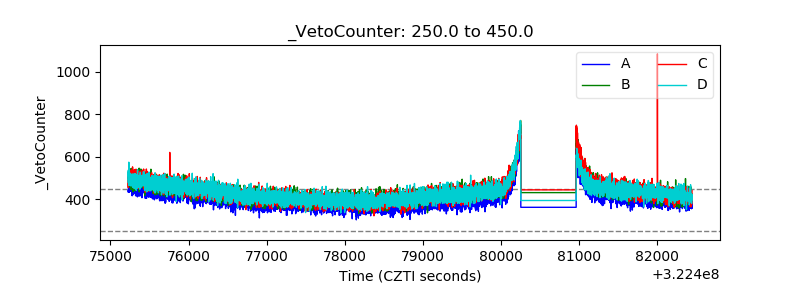 |