| Param | Original file | Final file |
|---|---|---|
| Filename | modeM0/AS1A07_010T12_9000003582_24220cztM0_level2.evt | modeM0/AS1A07_010T12_9000003582_24220cztM0_level2_quad_clean.evt |
| Size (bytes) | 558,005,760 | 111,519,360 |
| Size | 532.2 MB | 106.4 MB |
| Events in quadrant A | 3,765,679 | 725,847 |
| Events in quadrant B | 3,810,116 | 735,315 |
| Events in quadrant C | 3,709,157 | 711,393 |
| Events in quadrant D | 5,116,679 | 694,083 |
| Mode M0 | |||
|---|---|---|---|
| Quadrant | BADHDUFLAG | Total packets | Discarded packets |
| A | 0 | 15952 | 1 |
| B | 0 | 15965 | 1 |
| C | 0 | 15557 | 1 |
| D | 0 | 20185 | 1 |
| Mode SS | |||
|---|---|---|---|
| Quadrant | BADHDUFLAG | Total packets | Discarded packets |
| A | 0 | 150 | 0 |
| B | 0 | 150 | 0 |
| C | 0 | 150 | 0 |
| D | 0 | 150 | 0 |
| Mode M9 | |||
|---|---|---|---|
| Quadrant | BADHDUFLAG | Total packets | Discarded packets |
| A | 0 | 1 | 0 |
| B | 0 | 1 | 0 |
| C | 0 | 1 | 0 |
| D | 0 | 1 | 0 |
| Quadrant | Total seconds | Saturated seconds | Saturation percentage |
|---|---|---|---|
| A | 7330 | 239 | 3.260573% |
| B | 7331 | 260 | 3.546583% |
| C | 7331 | 192 | 2.619015% |
| D | 7331 | 223 | 3.041877% |
Noise dominated data is calculated using 1-second bins in cleaned event files. If a bin has >2000 counts, and if more than 50% of those come from <1% of pixels, then it is considered to be noise-dominated and hence unusable.
| Quadrant | # 1 sec bins | Bins with >0 counts | Bins with >2000 counts | High rate bins dominated by noise | Noise dominated (total time) | Noise dominated (detector-on time) | Marked lightcurve |
|---|---|---|---|---|---|---|---|
| A | 7495 | 7330 | 38 | 38 | 0.51% | 0.52% | 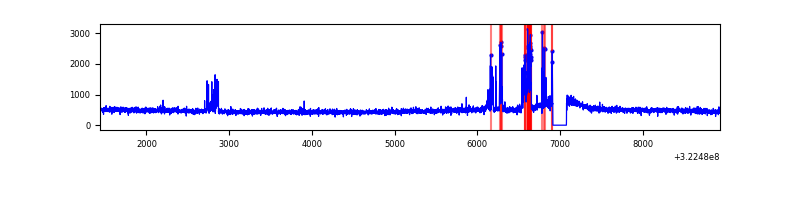 |
| B | 7496 | 7332 | 57 | 57 | 0.76% | 0.78% | 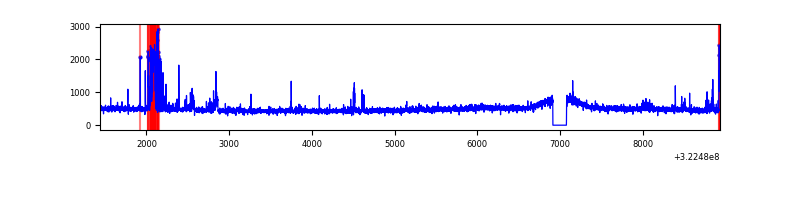 |
| C | 7496 | 7332 | 5 | 5 | 0.07% | 0.07% | 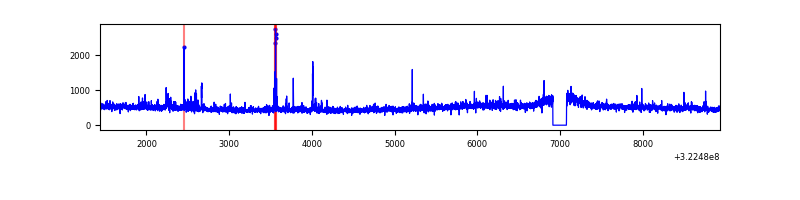 |
| D | 7496 | 7332 | 69 | 69 | 0.92% | 0.94% | 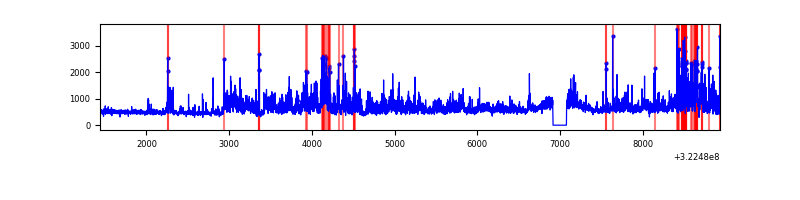 |
Top three noisy pixels from each quadrant. If the there are fewer than three noisy pixels in the level2.evt file, extra rows are filled as -1
| Pixel properties | Quadrant properties | ||||||
|---|---|---|---|---|---|---|---|
| Quadrant | DetID | PixID | Counts | Sigma | Mean | Median | Sigma |
| A | 6 | 16 | 274844 | 1505.18 | 904 | 885 | 182.0 |
| A | 13 | 254 | 11249 | 56.94 | 904 | 885 | 182.0 |
| A | 0 | 226 | 7940 | 38.76 | 904 | 885 | 182.0 |
| B | 12 | 17 | 175896 | 1022.26 | 897 | 876 | 171.2 |
| B | 15 | 33 | 44931 | 257.32 | 897 | 876 | 171.2 |
| B | 0 | 245 | 43389 | 248.31 | 897 | 876 | 171.2 |
| C | 14 | 238 | 138424 | 678.93 | 867 | 872 | 202.6 |
| C | 2 | 16 | 101723 | 497.78 | 867 | 872 | 202.6 |
| C | 7 | 247 | 78886 | 385.06 | 867 | 872 | 202.6 |
| D | 8 | 195 | 1306468 | 6088.26 | 883 | 855 | 214.4 |
| D | 12 | 233 | 364833 | 1697.28 | 883 | 855 | 214.4 |
| D | 7 | 238 | 39448 | 179.96 | 883 | 855 | 214.4 |
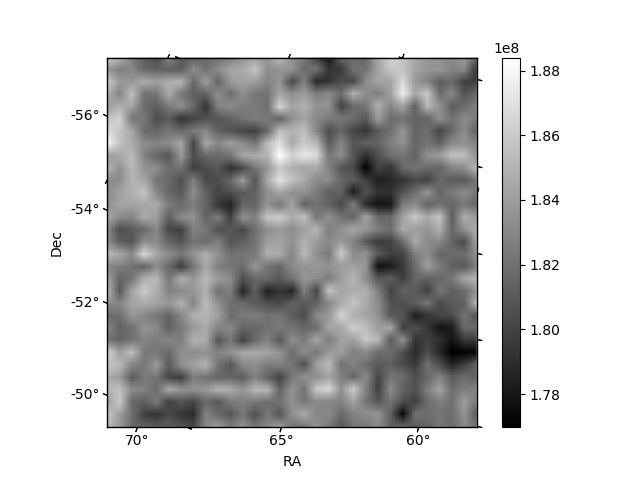
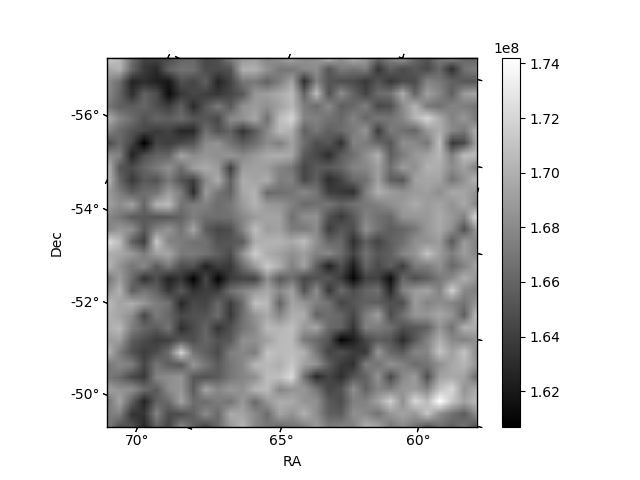
Histogram calculated using DETX and DETY for each event in the final _common_clean file
| Quadrant A | 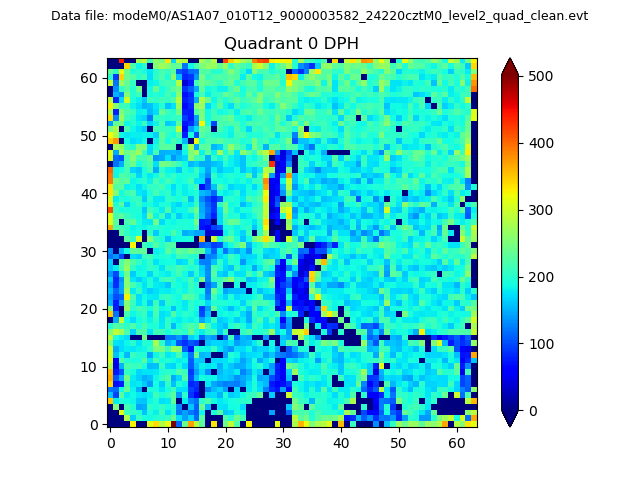 |
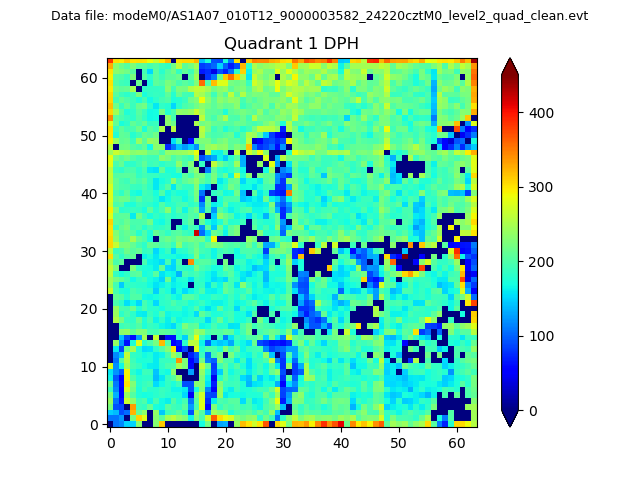 |
Quadrant B |
|---|---|---|---|
| Quadrant D | 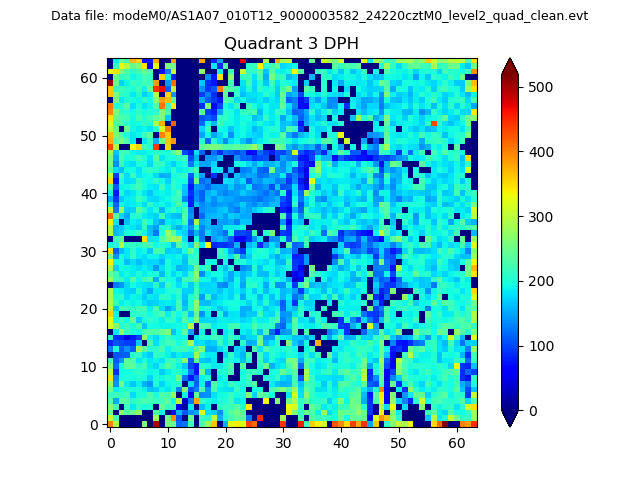 |
 |
Quadrant C |
| Plot type | Count rate plots | Images |
|---|---|---|
| Comparison with Poisson distribution Blue bars denote a histogram of data divided into 1 sec bins. Red curve is a Poisson curve with rate = median count rate of data. |
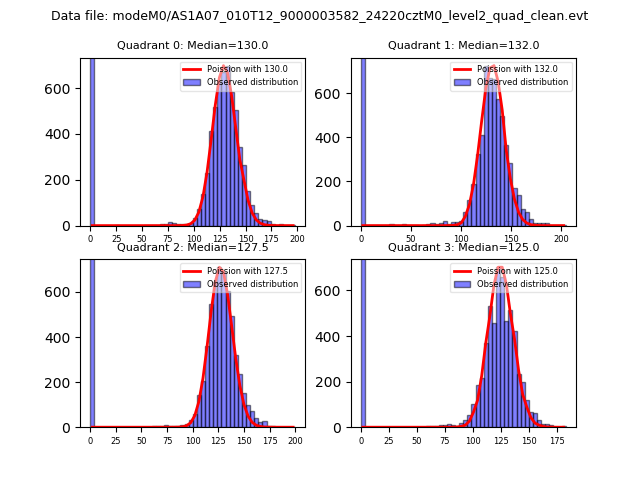 |
 |
| Quadrant-wise count rates Data is divided into 100 sec bins |
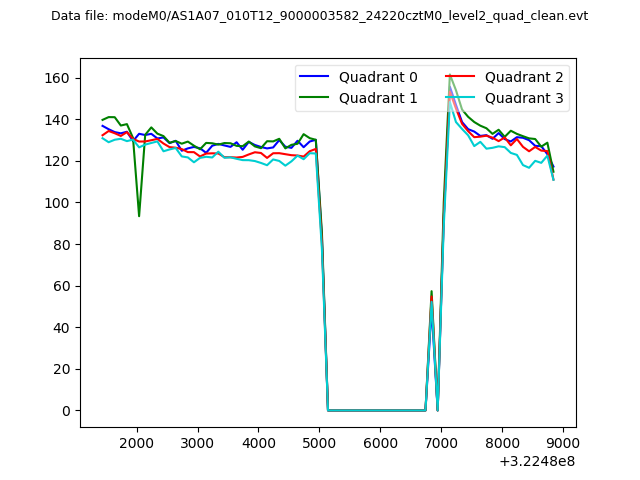 |
|
| Module-wise count rates for Quadrant A Data is divided into 100 sec bins |
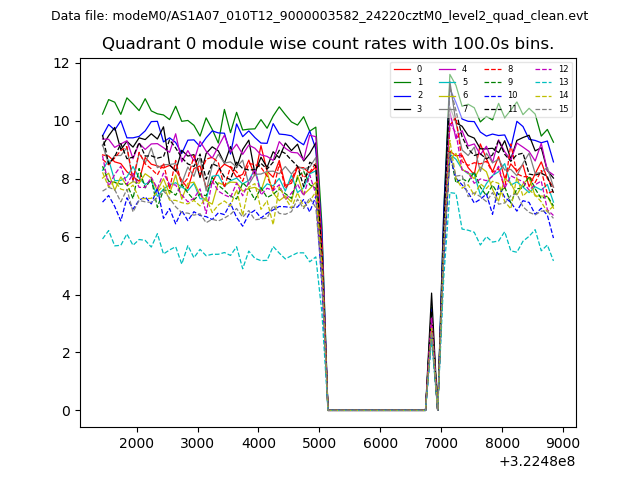 |
 |
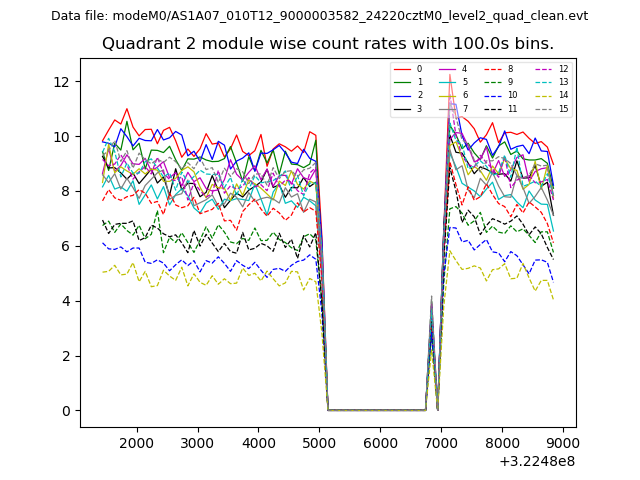
| Module-wise count rates for Quadrant B Data is divided into 100 sec bins |
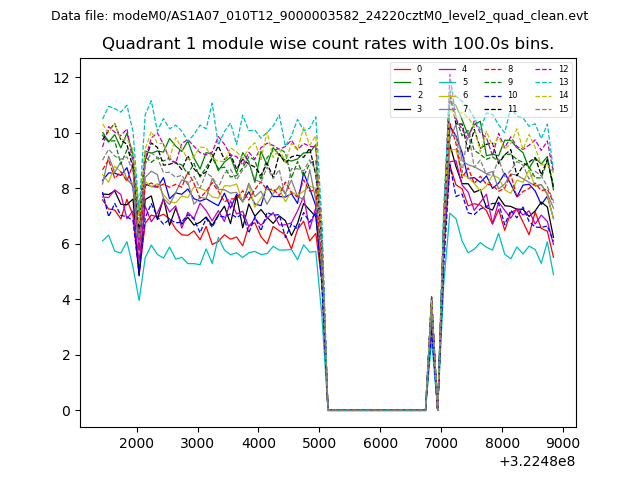 |
 |
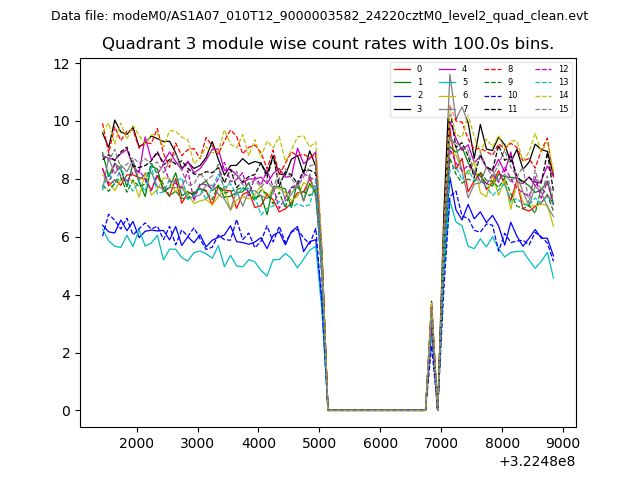
| Module-wise count rates for Quadrant C Data is divided into 100 sec bins |
 |
 |
| Module-wise count rates for Quadrant D Data is divided into 100 sec bins |
 |
 |
| Parameter | Plot |
|---|---|
| CZT HV Monitor | 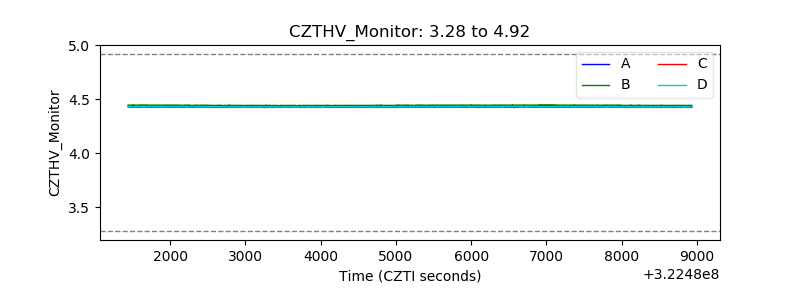 |
| D_VDD |  |
| Temperature 1 | 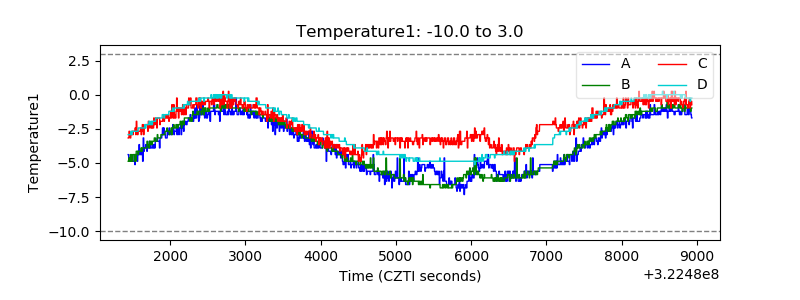 |
| Veto HV Monitor | 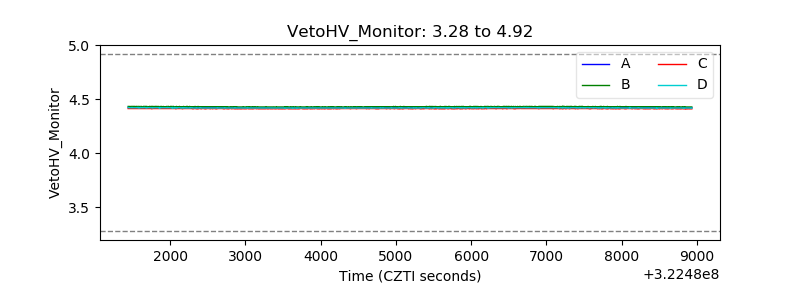 |
| Veto LLD | 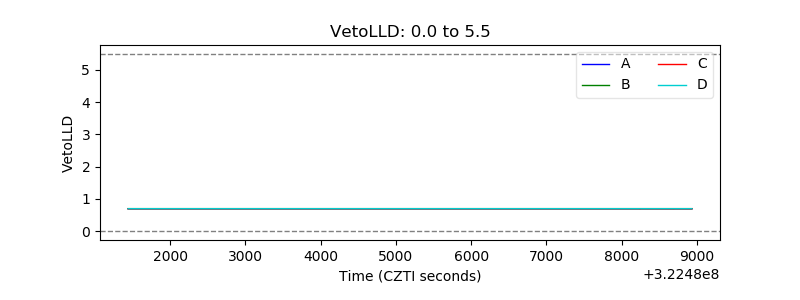 |
| Alpha Counter | 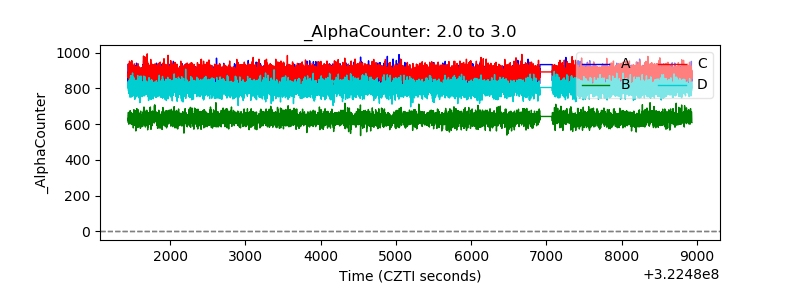 |
| _CPM_Rate | 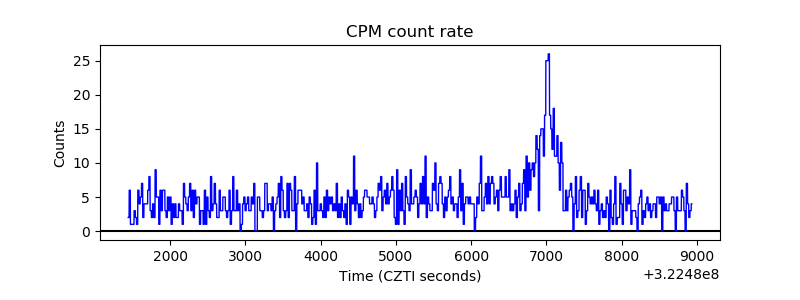 |
| CZT Counter |  |
| +2.5 Volts monitor |  |
| +5 Volts monitor |  |
| _ROLL_ROT | 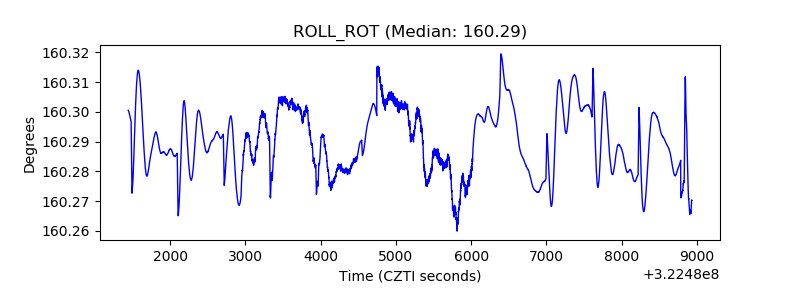 |
| _Roll_DEC | 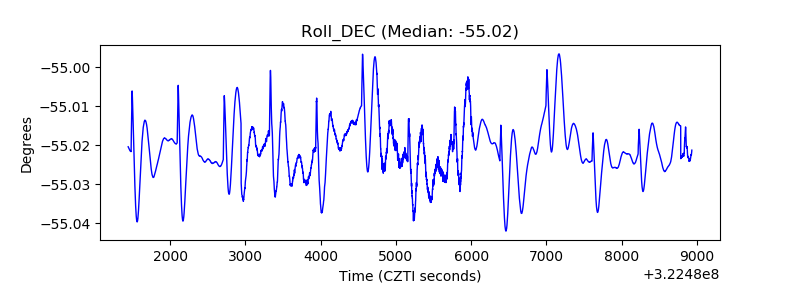 |
| _Roll_RA | 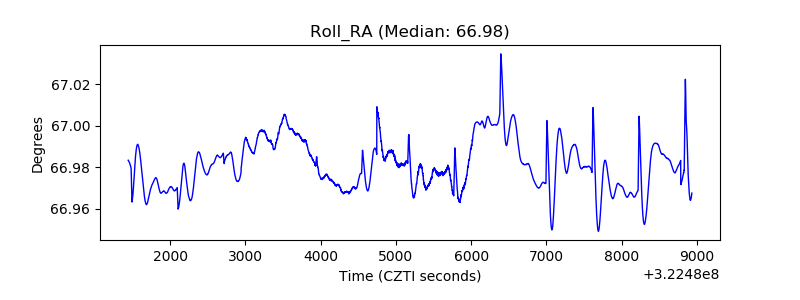 |
| Veto Counter | 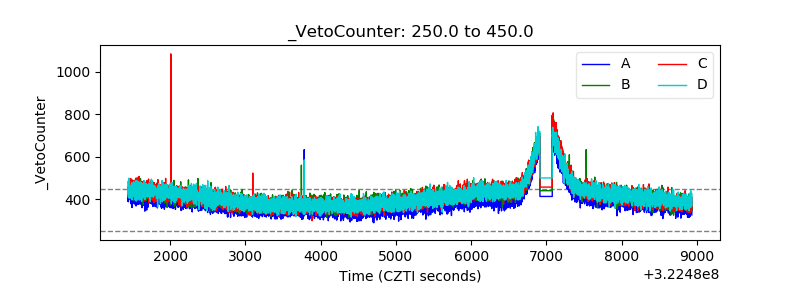 |