| Param | Original file | Final file |
|---|---|---|
| Filename | modeM0/AS1A07_010T12_9000003582_24221cztM0_level2.evt | modeM0/AS1A07_010T12_9000003582_24221cztM0_level2_quad_clean.evt |
| Size (bytes) | 142,623,360 | 35,055,360 |
| Size | 136.0 MB | 33.4 MB |
| Events in quadrant A | 819,178 | 235,777 |
| Events in quadrant B | 1,155,493 | 234,712 |
| Events in quadrant C | 831,939 | 230,113 |
| Events in quadrant D | 1,382,355 | 223,347 |
| Mode M0 | |||
|---|---|---|---|
| Quadrant | BADHDUFLAG | Total packets | Discarded packets |
| A | 0 | 3759 | 0 |
| B | 0 | 4703 | 0 |
| C | 0 | 3786 | 0 |
| D | 0 | 5469 | 0 |
| Mode SS | |||
|---|---|---|---|
| Quadrant | BADHDUFLAG | Total packets | Discarded packets |
| A | 0 | 38 | 0 |
| B | 0 | 38 | 0 |
| C | 0 | 38 | 0 |
| D | 0 | 38 | 0 |
| Quadrant | Total seconds | Saturated seconds | Saturation percentage |
|---|---|---|---|
| A | 1878 | 3 | 0.159744% |
| B | 1879 | 33 | 1.756253% |
| C | 1879 | 3 | 0.159659% |
| D | 1879 | 68 | 3.618946% |
Noise dominated data is calculated using 1-second bins in cleaned event files. If a bin has >2000 counts, and if more than 50% of those come from <1% of pixels, then it is considered to be noise-dominated and hence unusable.
| Quadrant | # 1 sec bins | Bins with >0 counts | Bins with >2000 counts | High rate bins dominated by noise | Noise dominated (total time) | Noise dominated (detector-on time) | Marked lightcurve |
|---|---|---|---|---|---|---|---|
| A | 1878 | 1878 | 0 | 0 | 0.00% | 0.00% |  |
| B | 1879 | 1879 | 27 | 27 | 1.44% | 1.44% |  |
| C | 1879 | 1879 | 0 | 0 | 0.00% | 0.00% | 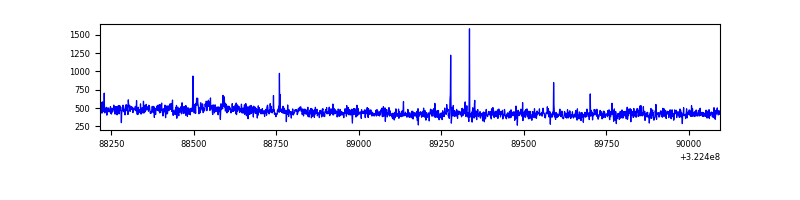 |
| D | 1879 | 1879 | 67 | 67 | 3.57% | 3.57% | 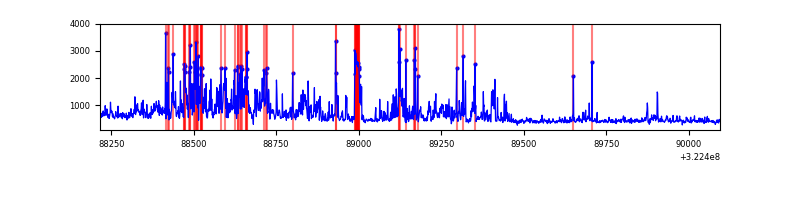 |
Top three noisy pixels from each quadrant. If the there are fewer than three noisy pixels in the level2.evt file, extra rows are filled as -1
| Pixel properties | Quadrant properties | ||||||
|---|---|---|---|---|---|---|---|
| Quadrant | DetID | PixID | Counts | Sigma | Mean | Median | Sigma |
| A | 13 | 254 | 3235 | 67.47 | 211 | 207 | 44.9 |
| A | 3 | 1 | 2669 | 54.85 | 211 | 207 | 44.9 |
| A | 0 | 226 | 1904 | 37.81 | 211 | 207 | 44.9 |
| B | 0 | 245 | 287134 | 6927.32 | 207 | 202 | 41.4 |
| B | 12 | 32 | 19462 | 464.99 | 207 | 202 | 41.4 |
| B | 5 | 172 | 16166 | 385.41 | 207 | 202 | 41.4 |
| C | 14 | 238 | 31309 | 661.76 | 197 | 198 | 47.0 |
| C | 2 | 16 | 11686 | 244.36 | 197 | 198 | 47.0 |
| C | 7 | 247 | 9785 | 203.93 | 197 | 198 | 47.0 |
| D | 12 | 233 | 433567 | 8525.63 | 200 | 193 | 50.8 |
| D | 8 | 195 | 152243 | 2991.23 | 200 | 193 | 50.8 |
| D | 7 | 238 | 20658 | 402.6 | 200 | 193 | 50.8 |
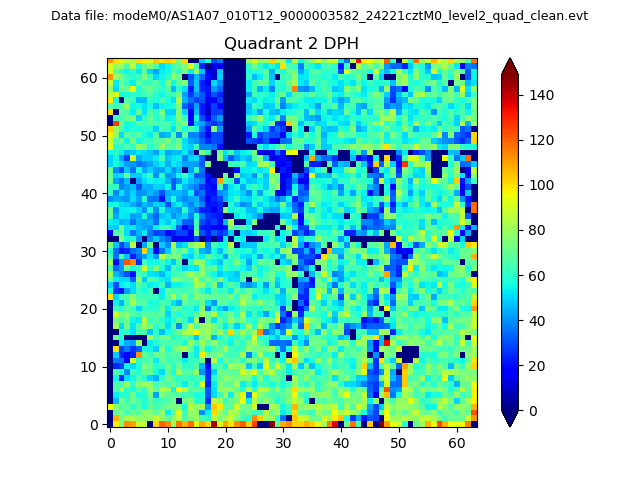
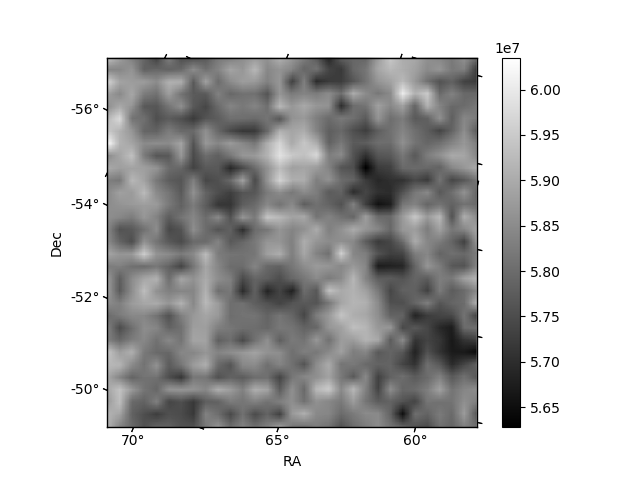
Histogram calculated using DETX and DETY for each event in the final _common_clean file
| Quadrant A | 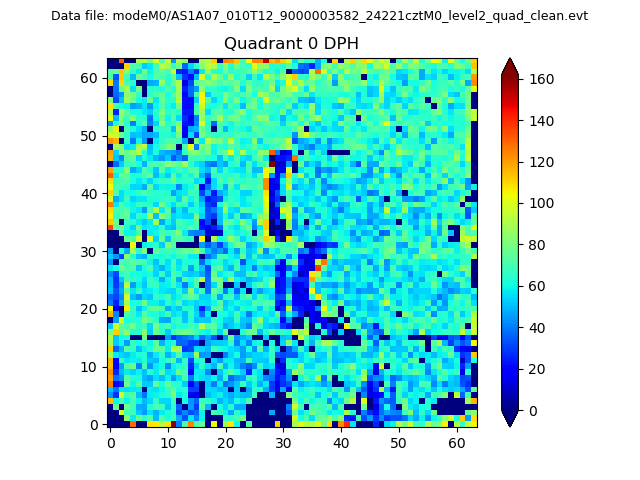 |
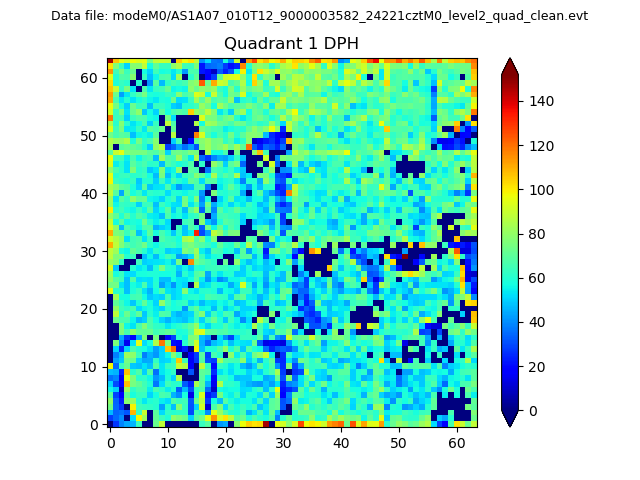 |
Quadrant B |
|---|---|---|---|
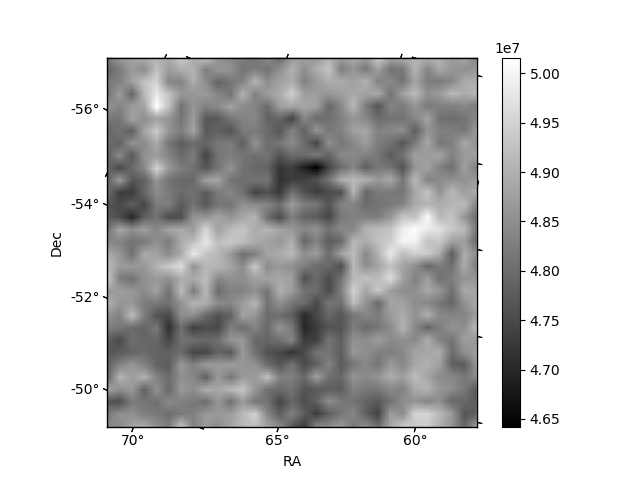
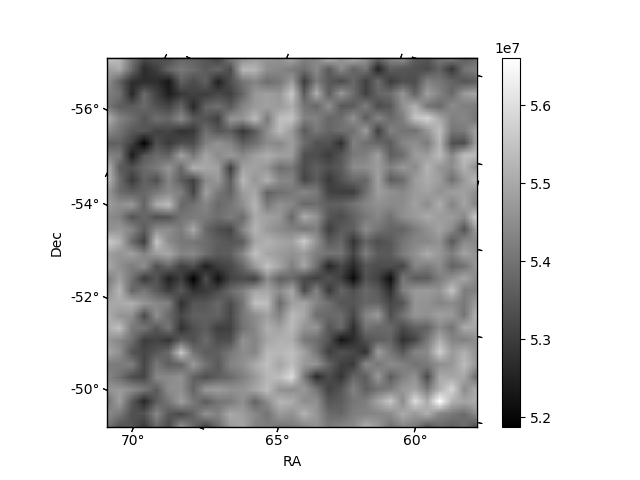
| Quadrant D | 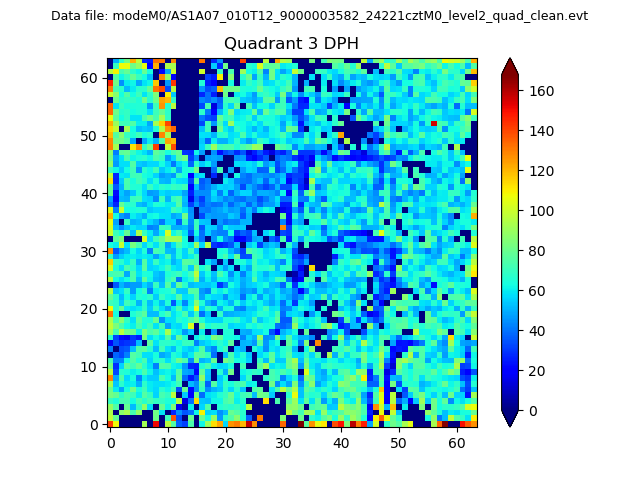 |
 |
Quadrant C |
| Plot type | Count rate plots | Images |
|---|---|---|
| Comparison with Poisson distribution Blue bars denote a histogram of data divided into 1 sec bins. Red curve is a Poisson curve with rate = median count rate of data. |
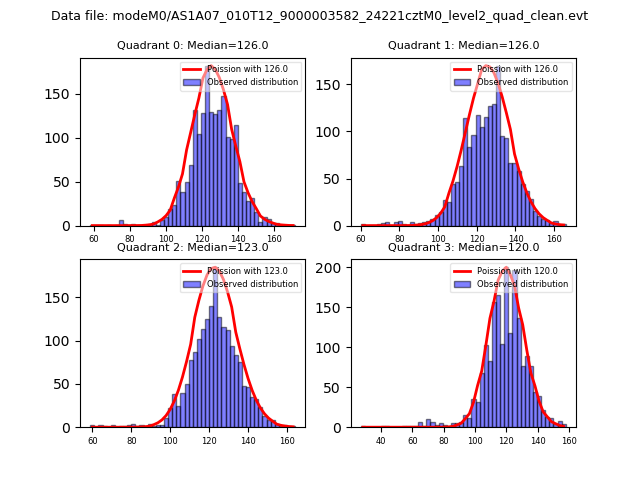 |
 |
| Quadrant-wise count rates Data is divided into 100 sec bins |
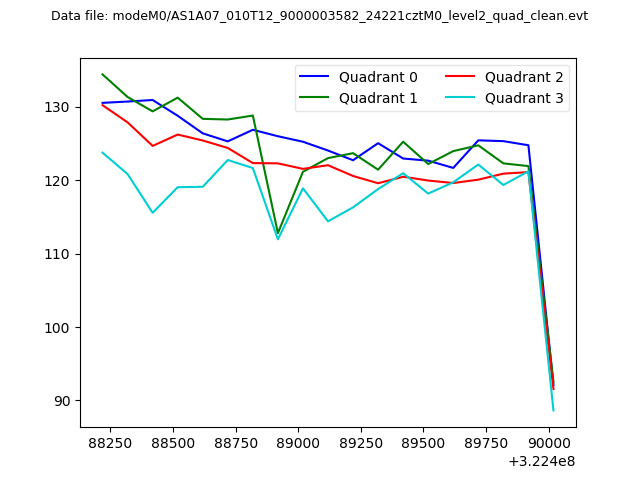 |
|
| Module-wise count rates for Quadrant A Data is divided into 100 sec bins |
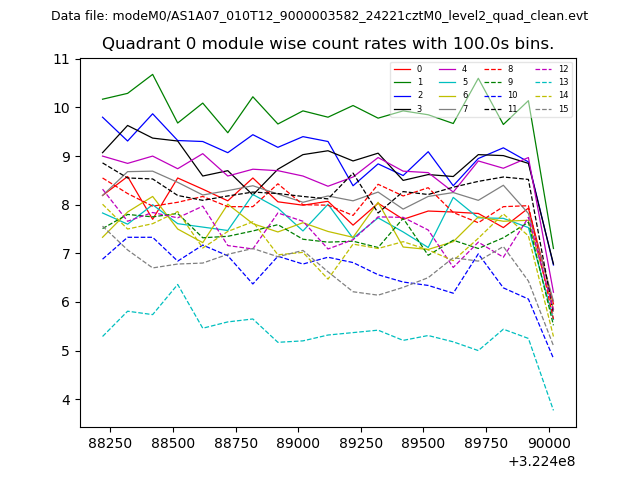 |
 |
| Module-wise count rates for Quadrant B Data is divided into 100 sec bins |
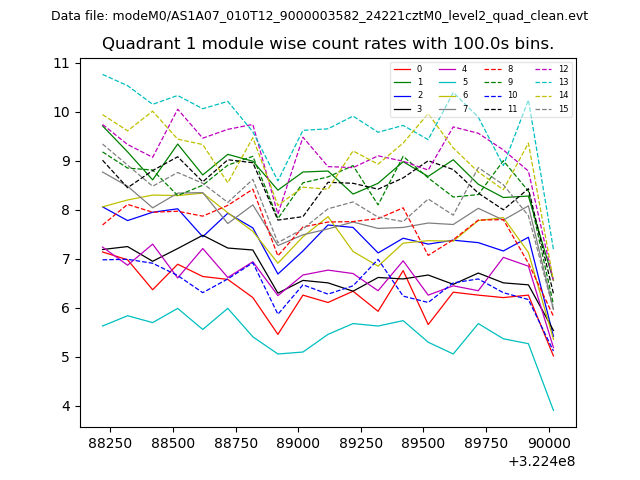 |
 |
| Module-wise count rates for Quadrant C Data is divided into 100 sec bins |
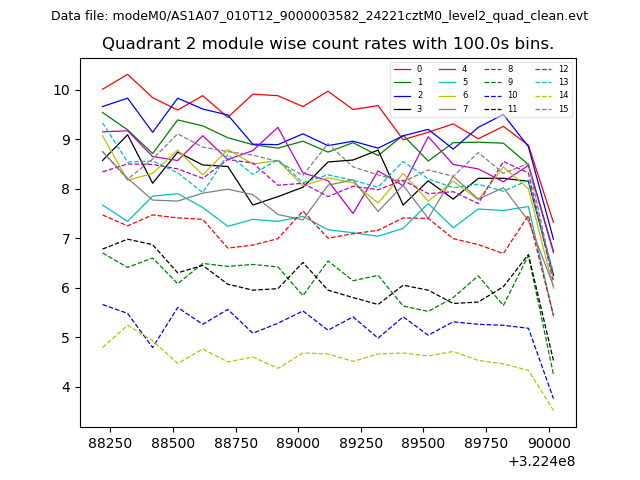 |
 |
| Module-wise count rates for Quadrant D Data is divided into 100 sec bins |
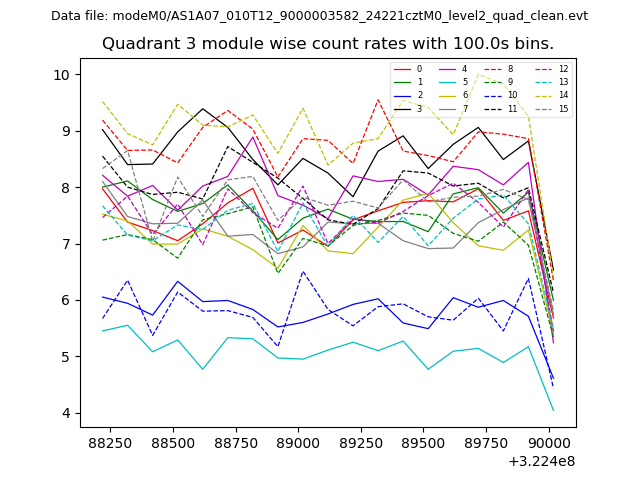 |
 |
| Parameter | Plot |
|---|---|
| CZT HV Monitor | 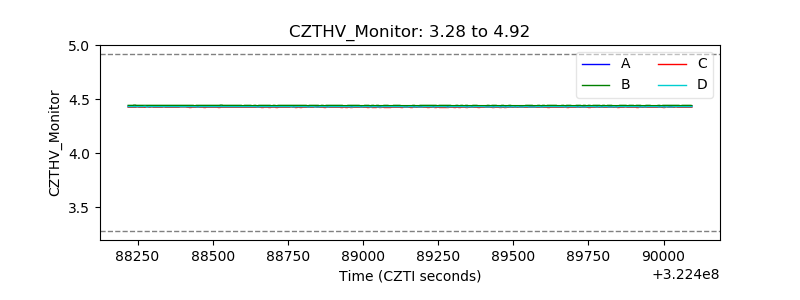 |
| D_VDD |  |
| Temperature 1 | 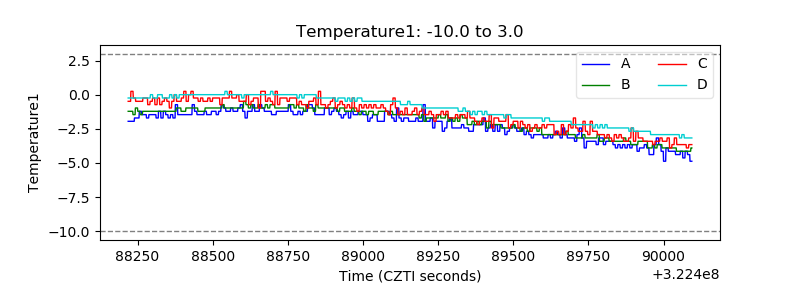 |
| Veto HV Monitor | 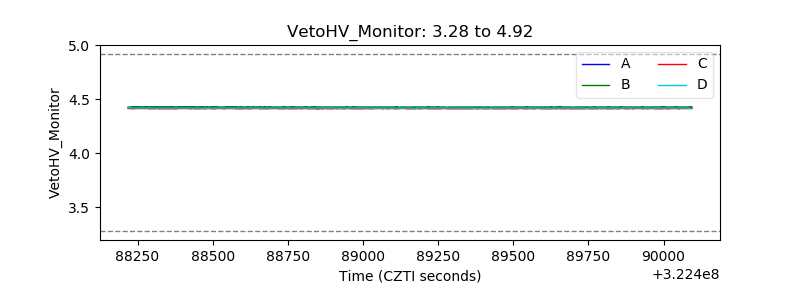 |
| Veto LLD | 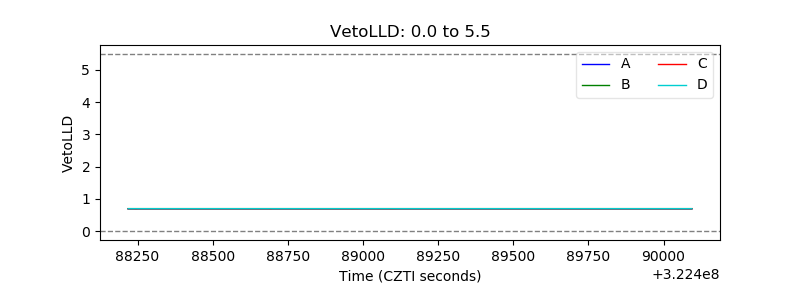 |
| Alpha Counter | 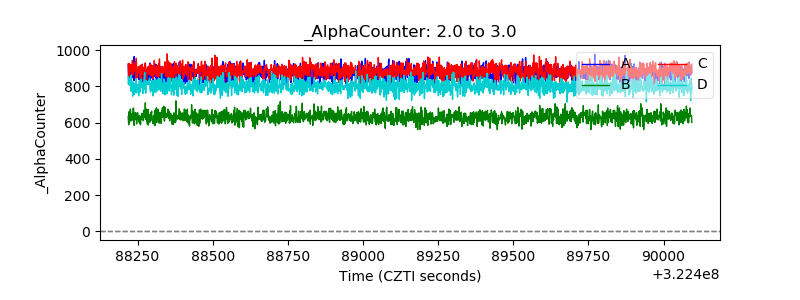 |
| _CPM_Rate | 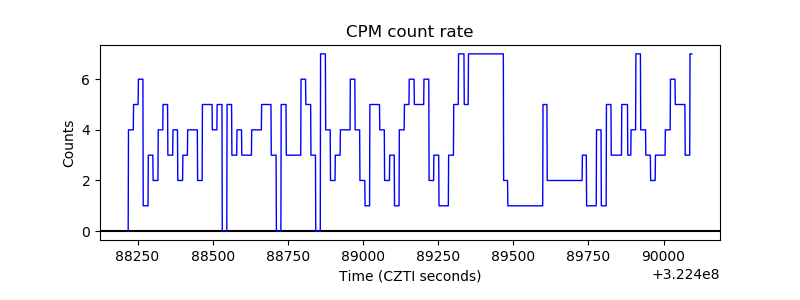 |
| CZT Counter | 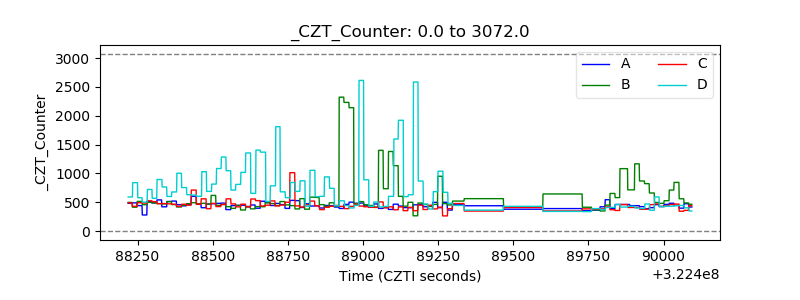 |
| +2.5 Volts monitor |  |
| +5 Volts monitor |  |
| _ROLL_ROT | 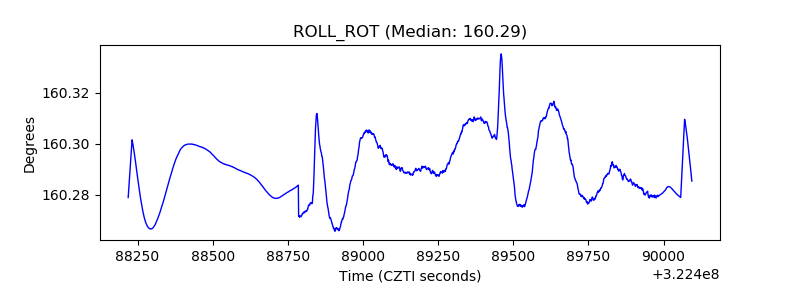 |
| _Roll_DEC | 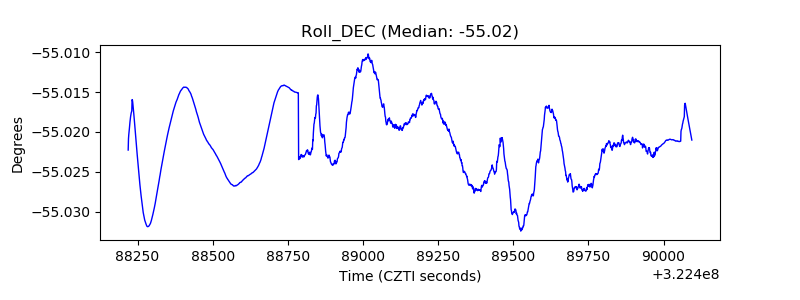 |
| _Roll_RA | 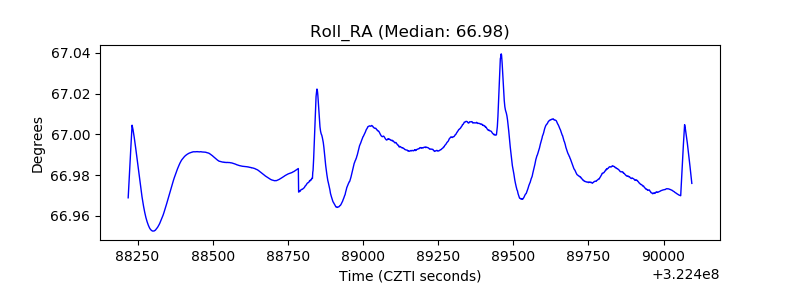 |
| Veto Counter | 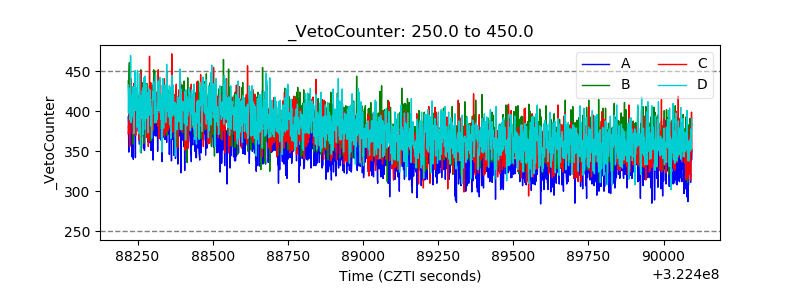 |