| Param | Original file | Final file |
|---|---|---|
| Filename | modeM0/AS1A07_091T05_9000003584_24221cztM0_level2.evt | modeM0/AS1A07_091T05_9000003584_24221cztM0_level2_quad_clean.evt |
| Size (bytes) | 285,693,120 | 34,704,000 |
| Size | 272.5 MB | 33.1 MB |
| Events in quadrant A | 1,831,863 | 202,820 |
| Events in quadrant B | 1,990,461 | 203,120 |
| Events in quadrant C | 2,059,475 | 195,219 |
| Events in quadrant D | 2,523,543 | 193,688 |
| Mode M0 | |||
|---|---|---|---|
| Quadrant | BADHDUFLAG | Total packets | Discarded packets |
| A | 0 | 7669 | 2 |
| B | 0 | 8107 | 1 |
| C | 0 | 8303 | 1 |
| D | 0 | 10020 | 1 |
| Mode SS | |||
|---|---|---|---|
| Quadrant | BADHDUFLAG | Total packets | Discarded packets |
| A | 0 | 72 | 0 |
| B | 0 | 72 | 0 |
| C | 0 | 72 | 0 |
| D | 0 | 72 | 0 |
| Mode M9 | |||
|---|---|---|---|
| Quadrant | BADHDUFLAG | Total packets | Discarded packets |
| A | 0 | 1 | 0 |
| B | 0 | 1 | 0 |
| C | 0 | 1 | 0 |
| D | 0 | 1 | 0 |
| Quadrant | Total seconds | Saturated seconds | Saturation percentage |
|---|---|---|---|
| A | 3617 | 206 | 5.695328% |
| B | 3617 | 293 | 8.100636% |
| C | 3617 | 280 | 7.741222% |
| D | 3617 | 218 | 6.027094% |
Noise dominated data is calculated using 1-second bins in cleaned event files. If a bin has >2000 counts, and if more than 50% of those come from <1% of pixels, then it is considered to be noise-dominated and hence unusable.
| Quadrant | # 1 sec bins | Bins with >0 counts | Bins with >2000 counts | High rate bins dominated by noise | Noise dominated (total time) | Noise dominated (detector-on time) | Marked lightcurve |
|---|---|---|---|---|---|---|---|
| A | 3652 | 3617 | 0 | 0 | 0.00% | 0.00% | 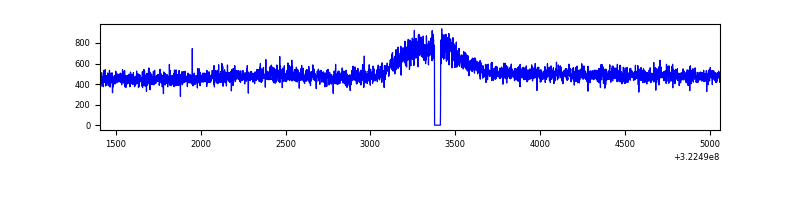 |
| B | 3652 | 3618 | 29 | 29 | 0.79% | 0.80% | 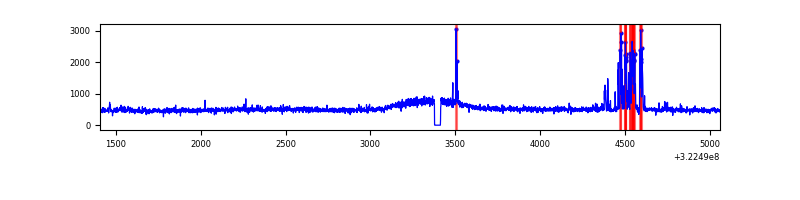 |
| C | 3652 | 3617 | 5 | 5 | 0.14% | 0.14% | 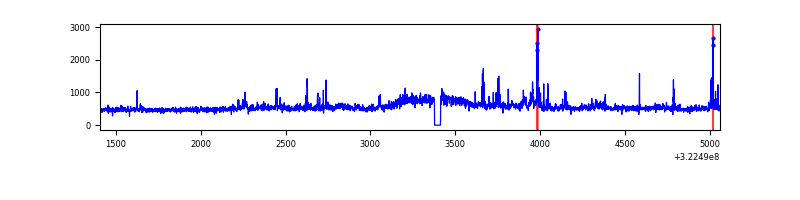 |
| D | 3652 | 3617 | 10 | 10 | 0.27% | 0.28% | 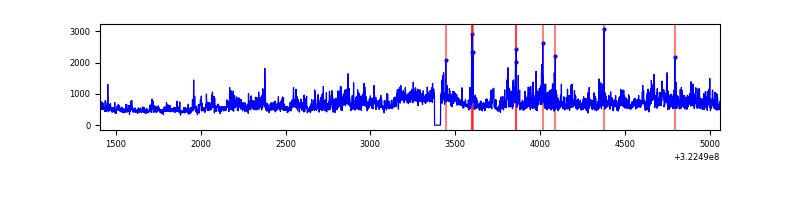 |
Top three noisy pixels from each quadrant. If the there are fewer than three noisy pixels in the level2.evt file, extra rows are filled as -1
| Pixel properties | Quadrant properties | ||||||
|---|---|---|---|---|---|---|---|
| Quadrant | DetID | PixID | Counts | Sigma | Mean | Median | Sigma |
| A | 13 | 254 | 4882 | 45.12 | 475 | 465 | 97.9 |
| A | 3 | 137 | 4401 | 40.2 | 475 | 465 | 97.9 |
| A | 0 | 226 | 4011 | 36.22 | 475 | 465 | 97.9 |
| B | 12 | 17 | 141161 | 1536.9 | 468 | 455 | 91.6 |
| B | 12 | 111 | 11743 | 123.3 | 468 | 455 | 91.6 |
| B | 11 | 111 | 10443 | 109.1 | 468 | 455 | 91.6 |
| C | 7 | 247 | 114813 | 1073.03 | 450 | 452 | 106.6 |
| C | 2 | 16 | 110419 | 1031.8 | 450 | 452 | 106.6 |
| C | 14 | 238 | 70353 | 655.87 | 450 | 452 | 106.6 |
| D | 8 | 195 | 665616 | 5882.23 | 458 | 442 | 113.1 |
| D | 12 | 233 | 90296 | 794.59 | 458 | 442 | 113.1 |
| D | 7 | 238 | 42560 | 372.46 | 458 | 442 | 113.1 |
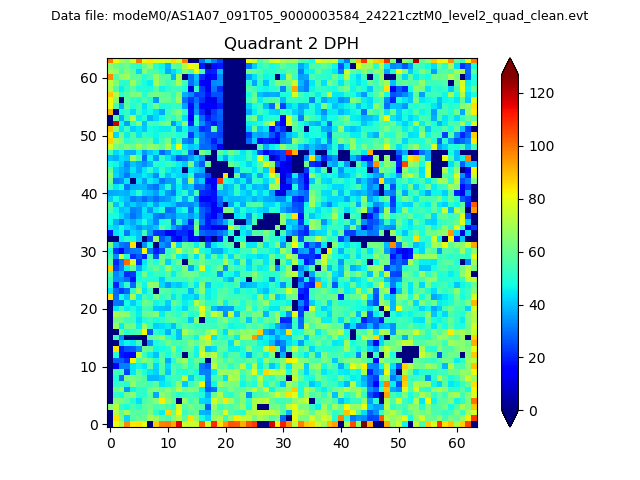
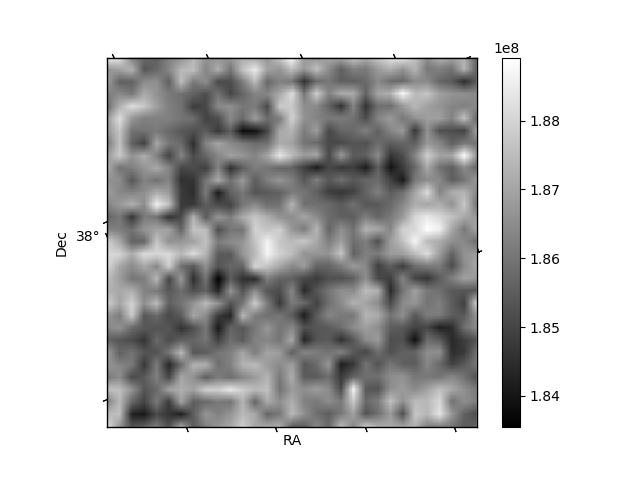
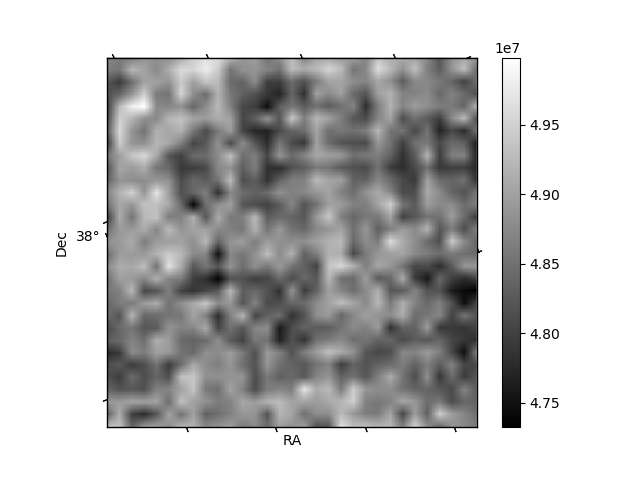
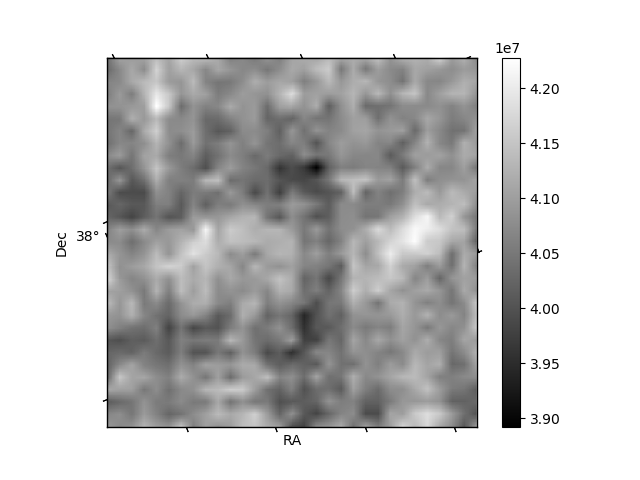
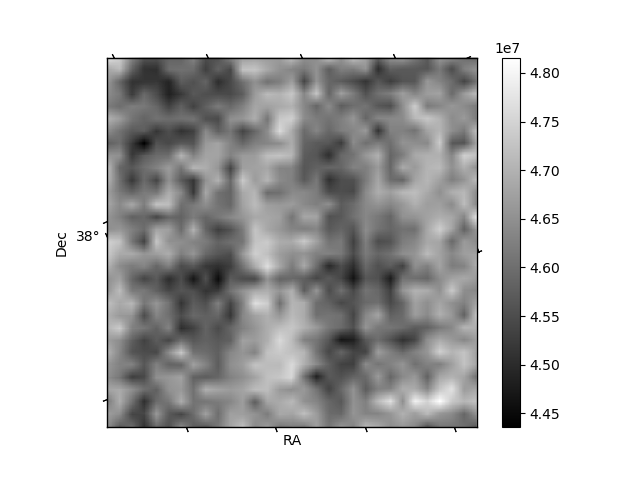
Histogram calculated using DETX and DETY for each event in the final _common_clean file
| Quadrant A | 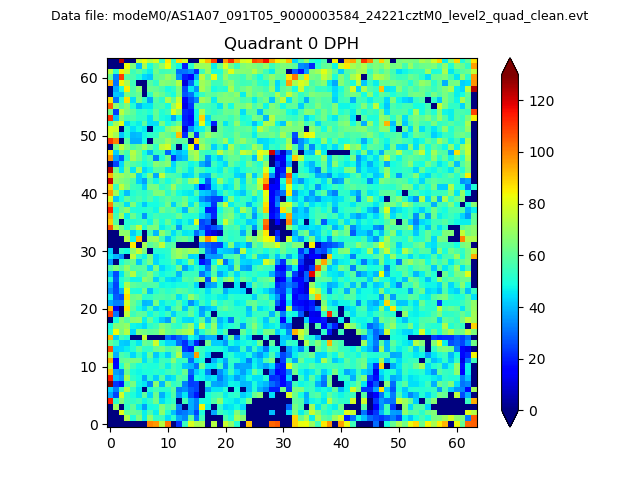 |
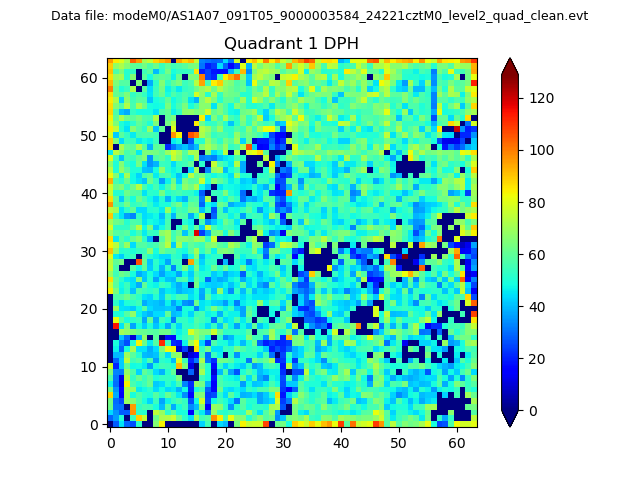 |
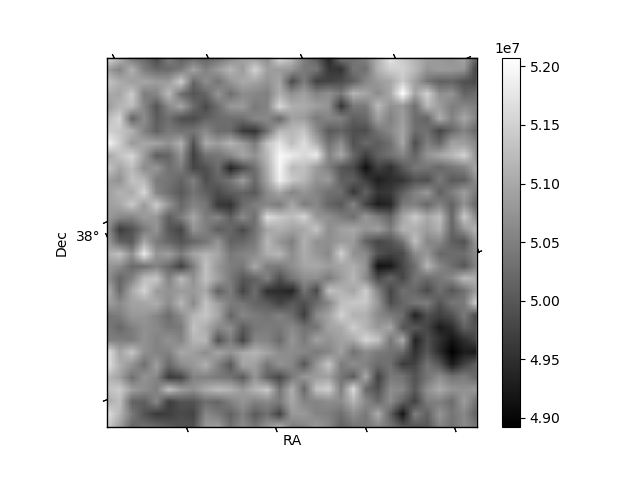
Quadrant B |
|---|---|---|---|
| Quadrant D | 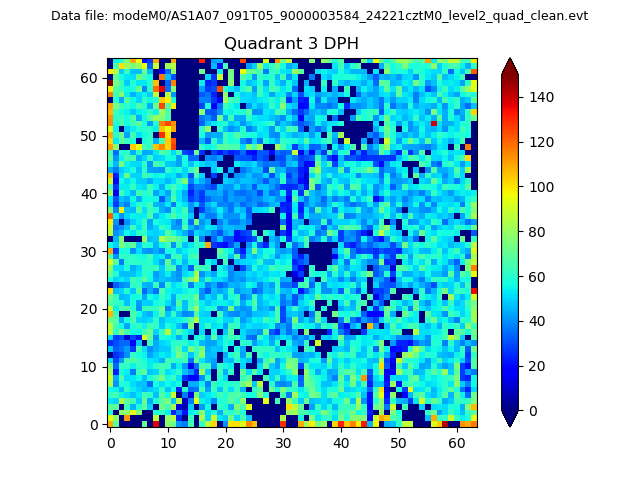 |
 |
Quadrant C |
| Plot type | Count rate plots | Images |
|---|---|---|
| Comparison with Poisson distribution Blue bars denote a histogram of data divided into 1 sec bins. Red curve is a Poisson curve with rate = median count rate of data. |
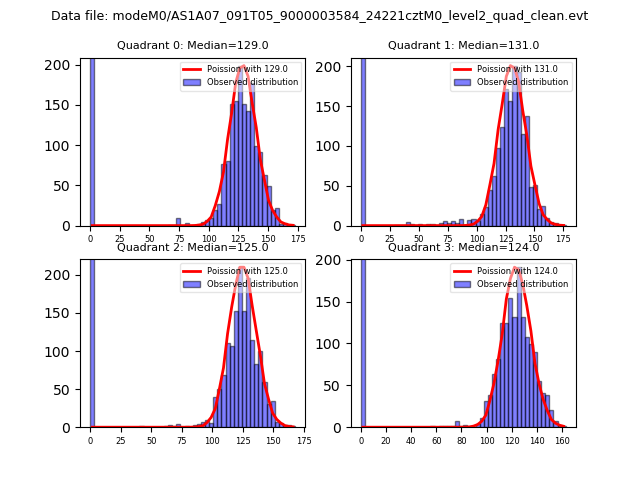 |
 |
| Quadrant-wise count rates Data is divided into 100 sec bins |
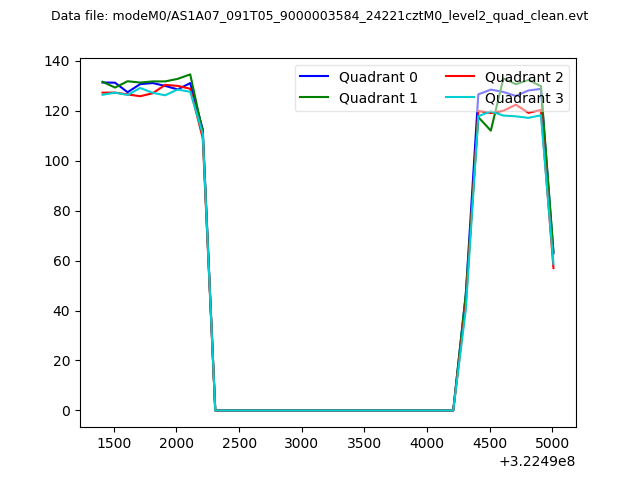 |
|
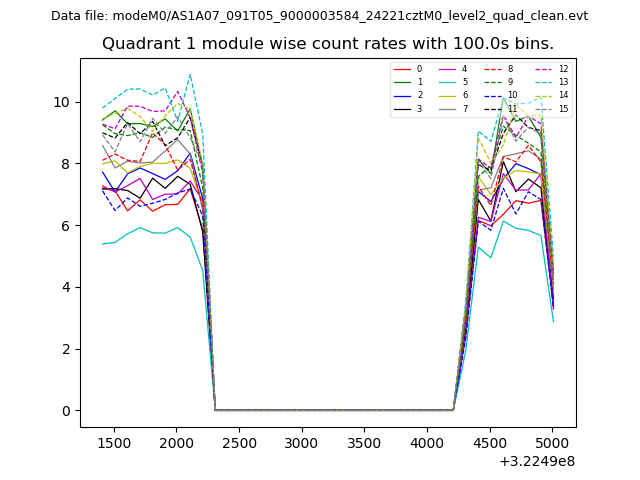
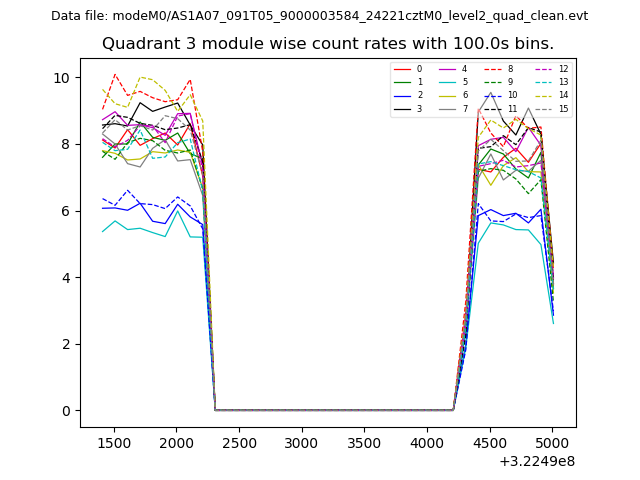
| Module-wise count rates for Quadrant A Data is divided into 100 sec bins |
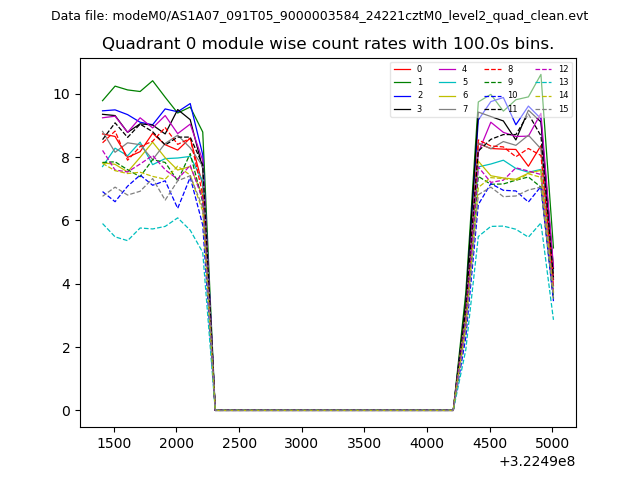 |
 |
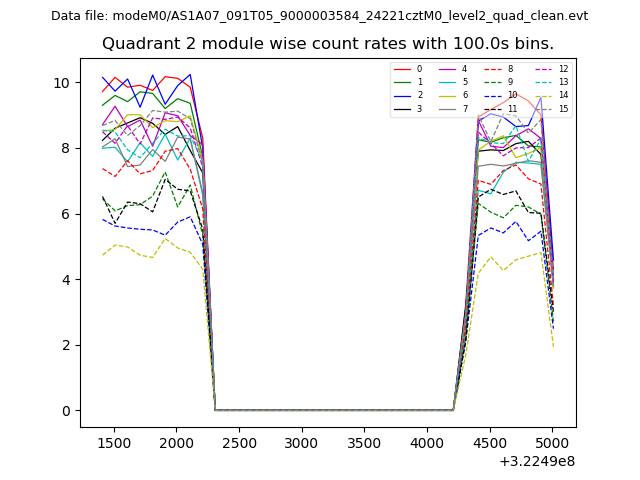
| Module-wise count rates for Quadrant B Data is divided into 100 sec bins |
 |
 |
| Module-wise count rates for Quadrant C Data is divided into 100 sec bins |
 |
 |
| Module-wise count rates for Quadrant D Data is divided into 100 sec bins |
 |
 |
| Parameter | Plot |
|---|---|
| CZT HV Monitor |  |
| D_VDD | 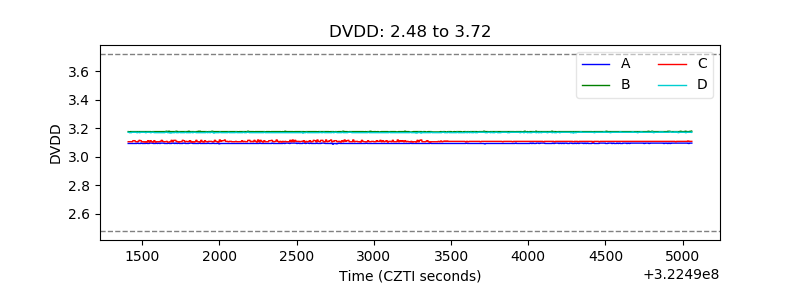 |
| Temperature 1 | 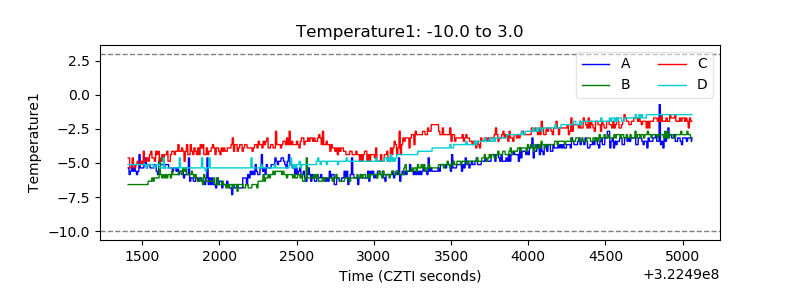 |
| Veto HV Monitor | 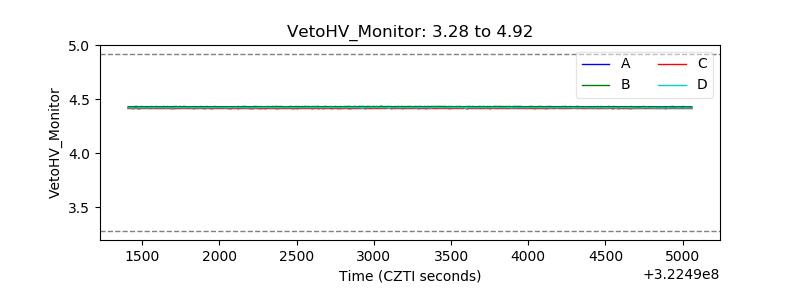 |
| Veto LLD | 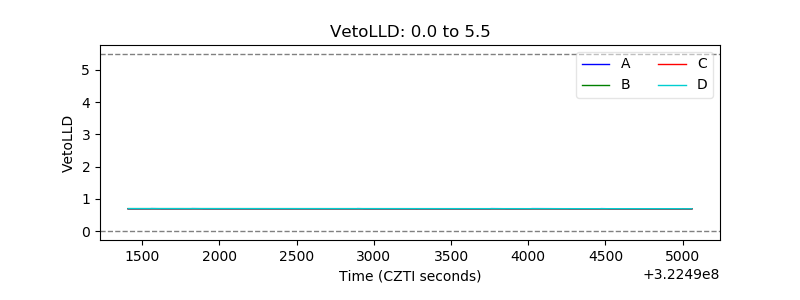 |
| Alpha Counter | 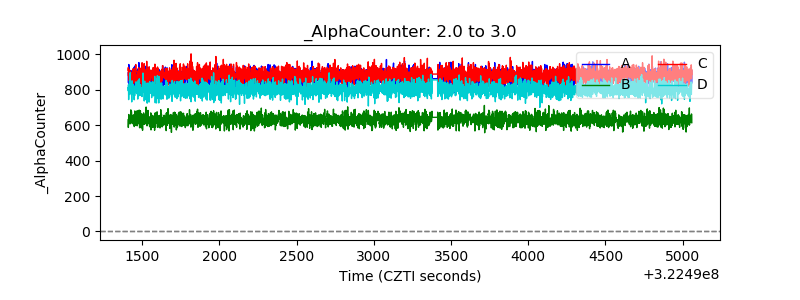 |
| _CPM_Rate | 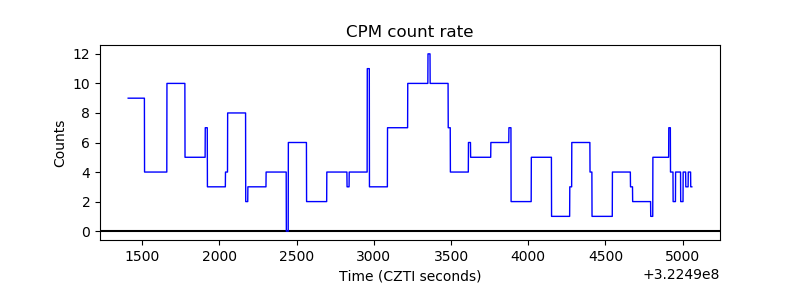 |
| CZT Counter | 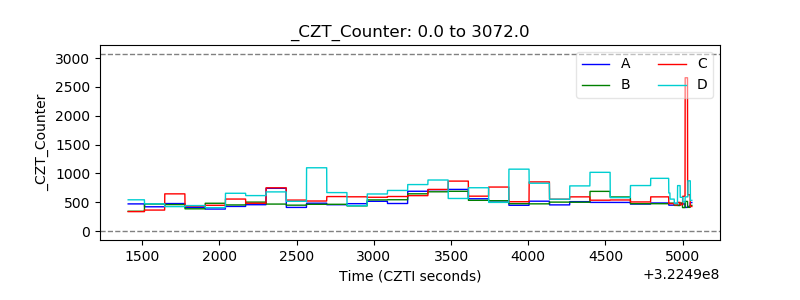 |
| +2.5 Volts monitor |  |
| +5 Volts monitor |  |
| _ROLL_ROT | 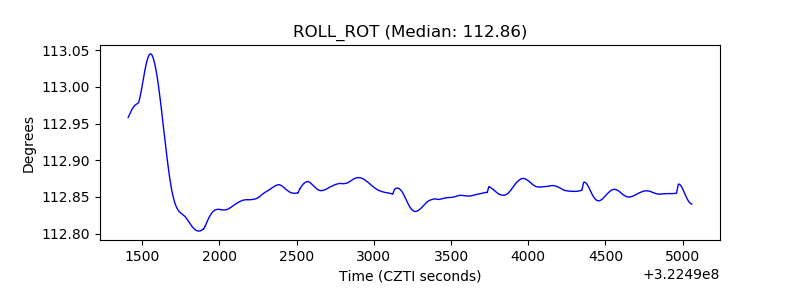 |
| _Roll_DEC | 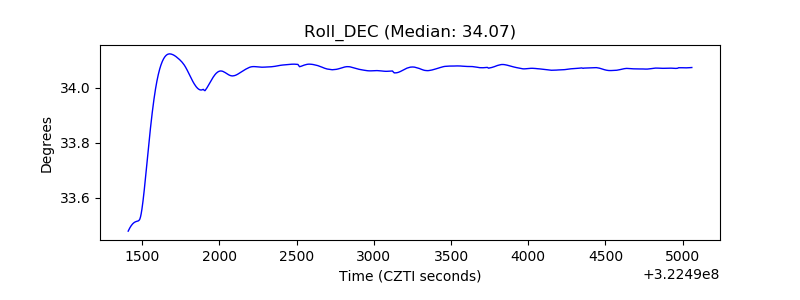 |
| _Roll_RA | 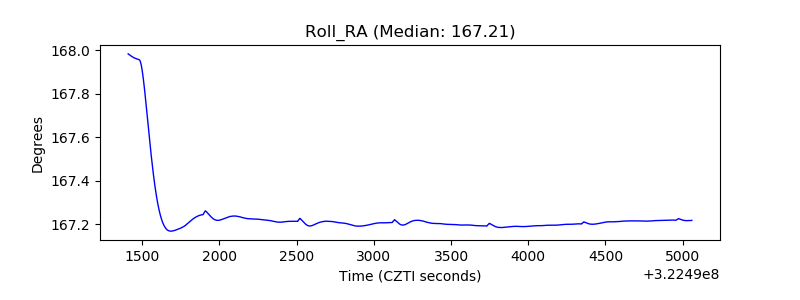 |
| Veto Counter | 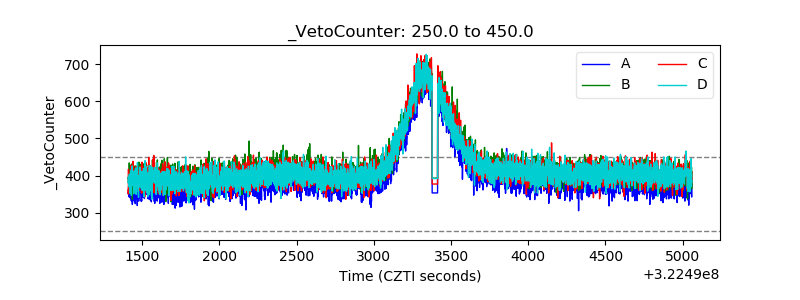 |