| Param | Original file | Final file |
|---|---|---|
| Filename | modeM0/AS1A07_091T05_9000003584_24222cztM0_level2.evt | modeM0/AS1A07_091T05_9000003584_24222cztM0_level2_quad_clean.evt |
| Size (bytes) | 620,962,560 | 101,424,960 |
| Size | 592.2 MB | 96.7 MB |
| Events in quadrant A | 4,064,321 | 637,050 |
| Events in quadrant B | 4,263,725 | 640,550 |
| Events in quadrant C | 4,638,877 | 610,401 |
| Events in quadrant D | 5,271,651 | 602,671 |
| Mode M0 | |||
|---|---|---|---|
| Quadrant | BADHDUFLAG | Total packets | Discarded packets |
| A | 0 | 17450 | 2 |
| B | 0 | 17983 | 2 |
| C | 0 | 18859 | 2 |
| D | 0 | 21248 | 4 |
| Mode SS | |||
|---|---|---|---|
| Quadrant | BADHDUFLAG | Total packets | Discarded packets |
| A | 0 | 172 | 0 |
| B | 0 | 172 | 0 |
| C | 0 | 172 | 0 |
| D | 0 | 172 | 0 |
| Mode M9 | |||
|---|---|---|---|
| Quadrant | BADHDUFLAG | Total packets | Discarded packets |
| A | 0 | 3 | 0 |
| B | 0 | 3 | 0 |
| C | 0 | 3 | 0 |
| D | 0 | 3 | 0 |
| Quadrant | Total seconds | Saturated seconds | Saturation percentage |
|---|---|---|---|
| A | 8358 | 299 | 3.577411% |
| B | 8359 | 391 | 4.677593% |
| C | 8359 | 453 | 5.419309% |
| D | 8358 | 333 | 3.984207% |
Noise dominated data is calculated using 1-second bins in cleaned event files. If a bin has >2000 counts, and if more than 50% of those come from <1% of pixels, then it is considered to be noise-dominated and hence unusable.
| Quadrant | # 1 sec bins | Bins with >0 counts | Bins with >2000 counts | High rate bins dominated by noise | Noise dominated (total time) | Noise dominated (detector-on time) | Marked lightcurve |
|---|---|---|---|---|---|---|---|
| A | 8688 | 8358 | 0 | 0 | 0.00% | 0.00% | 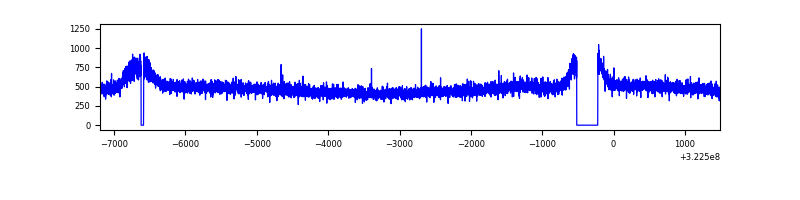 |
| B | 8689 | 8360 | 30 | 30 | 0.35% | 0.36% | 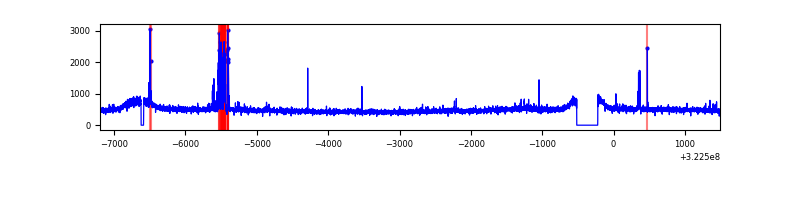 |
| C | 8689 | 8359 | 30 | 30 | 0.35% | 0.36% | 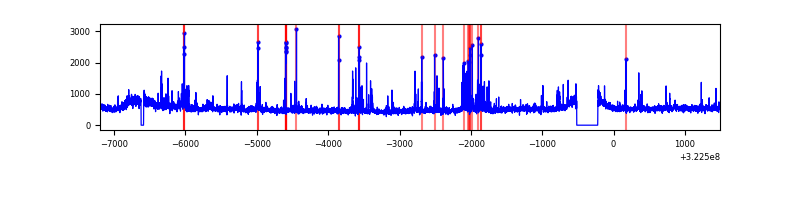 |
| D | 8688 | 8358 | 30 | 30 | 0.35% | 0.36% | 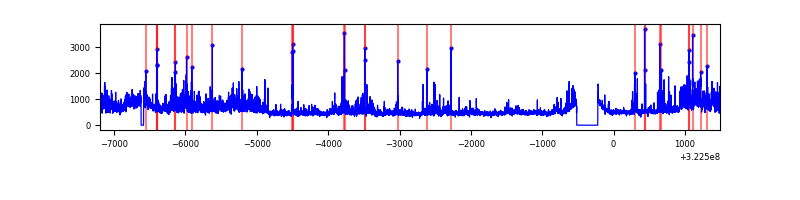 |
Top three noisy pixels from each quadrant. If the there are fewer than three noisy pixels in the level2.evt file, extra rows are filled as -1
| Pixel properties | Quadrant properties | ||||||
|---|---|---|---|---|---|---|---|
| Quadrant | DetID | PixID | Counts | Sigma | Mean | Median | Sigma |
| A | 13 | 254 | 11949 | 51.6 | 1053 | 1030 | 211.6 |
| A | 3 | 137 | 9678 | 40.87 | 1053 | 1030 | 211.6 |
| A | 0 | 226 | 8954 | 37.45 | 1053 | 1030 | 211.6 |
| B | 12 | 17 | 139200 | 690.99 | 1039 | 1011 | 200.0 |
| B | 0 | 190 | 26759 | 128.75 | 1039 | 1011 | 200.0 |
| B | 12 | 111 | 25467 | 122.29 | 1039 | 1011 | 200.0 |
| C | 2 | 16 | 343314 | 1451.27 | 1006 | 1007 | 235.9 |
| C | 7 | 247 | 213273 | 899.94 | 1006 | 1007 | 235.9 |
| C | 14 | 238 | 157765 | 664.6 | 1006 | 1007 | 235.9 |
| D | 8 | 195 | 998402 | 3988.26 | 1026 | 995 | 250.1 |
| D | 12 | 233 | 298791 | 1190.78 | 1026 | 995 | 250.1 |
| D | 7 | 238 | 105089 | 416.23 | 1026 | 995 | 250.1 |
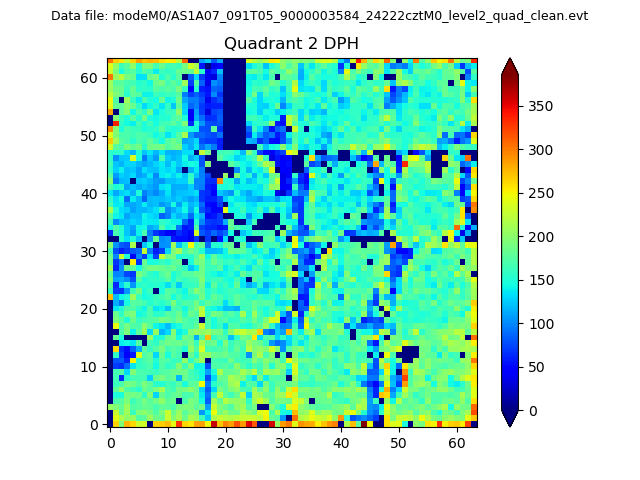
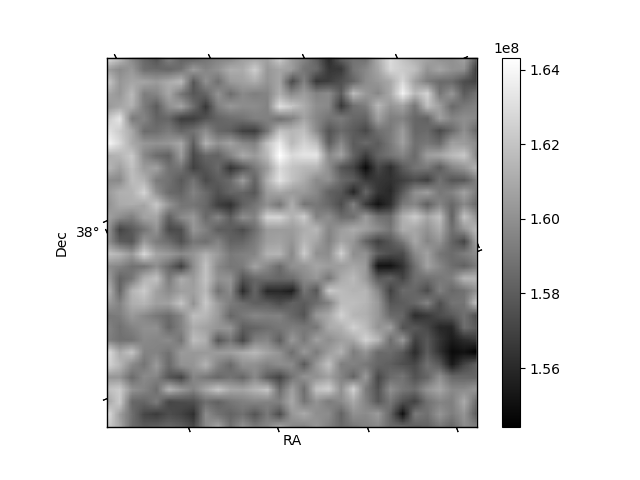
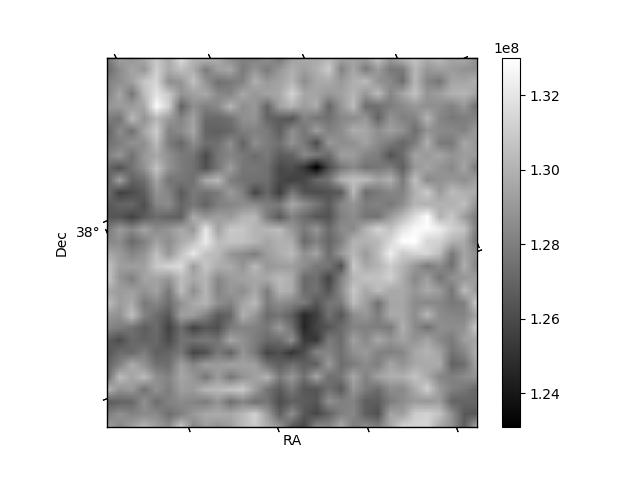
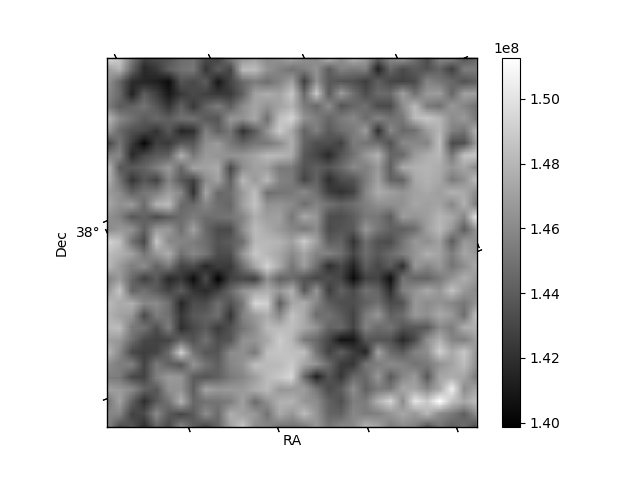
Histogram calculated using DETX and DETY for each event in the final _common_clean file
| Quadrant A | 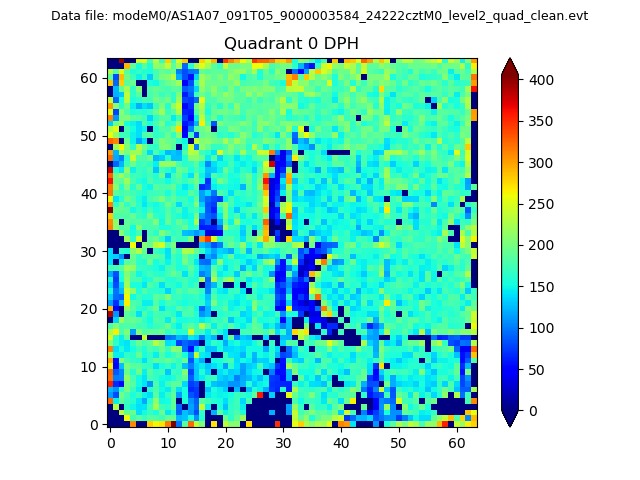 |
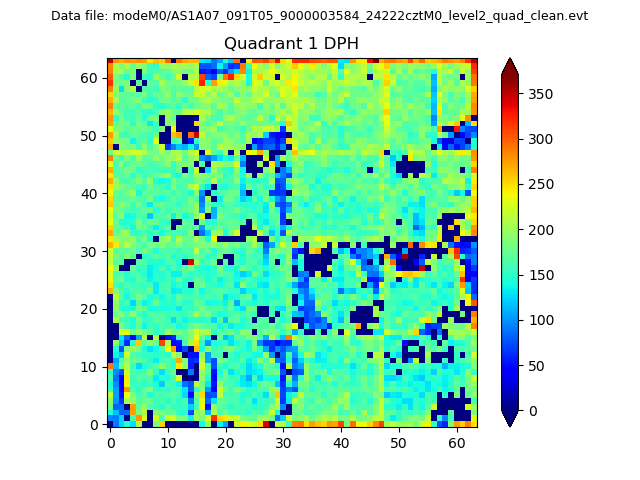 |
Quadrant B |
|---|---|---|---|
| Quadrant D | 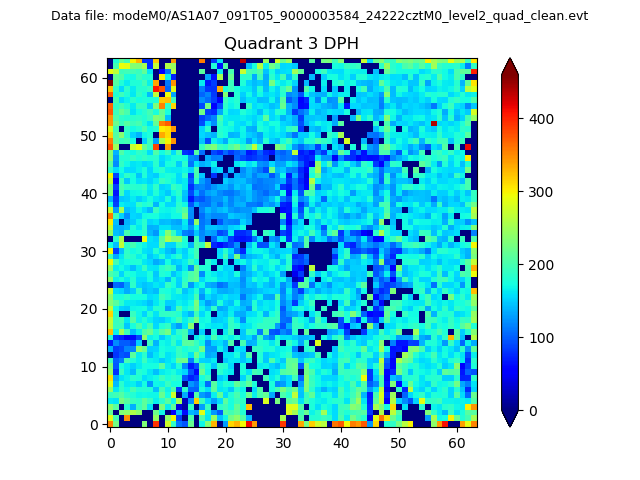 |
 |
Quadrant C |
| Plot type | Count rate plots | Images |
|---|---|---|
| Comparison with Poisson distribution Blue bars denote a histogram of data divided into 1 sec bins. Red curve is a Poisson curve with rate = median count rate of data. |
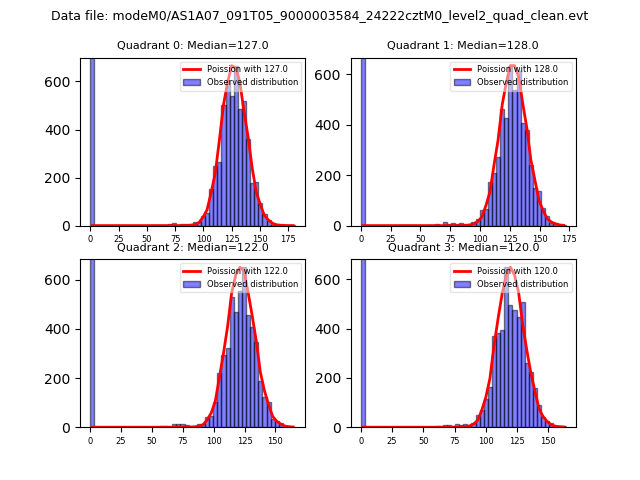 |
 |
| Quadrant-wise count rates Data is divided into 100 sec bins |
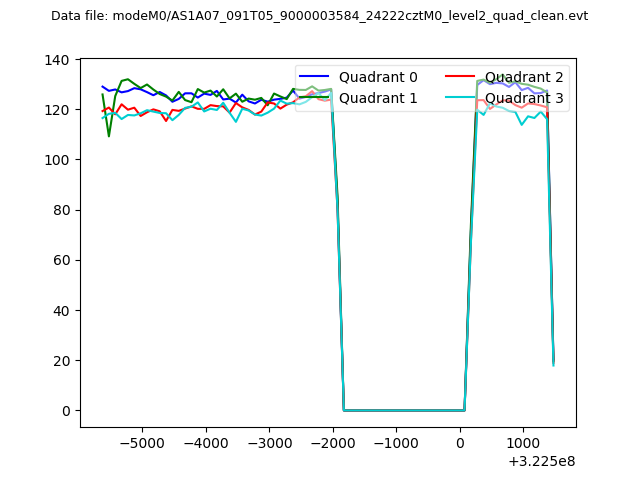 |
|
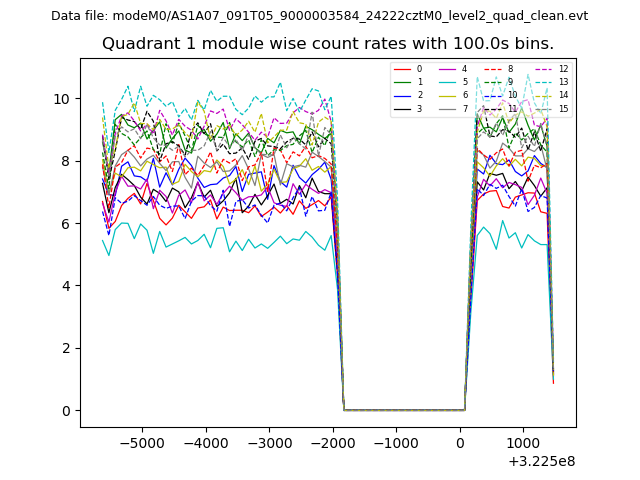
| Module-wise count rates for Quadrant A Data is divided into 100 sec bins |
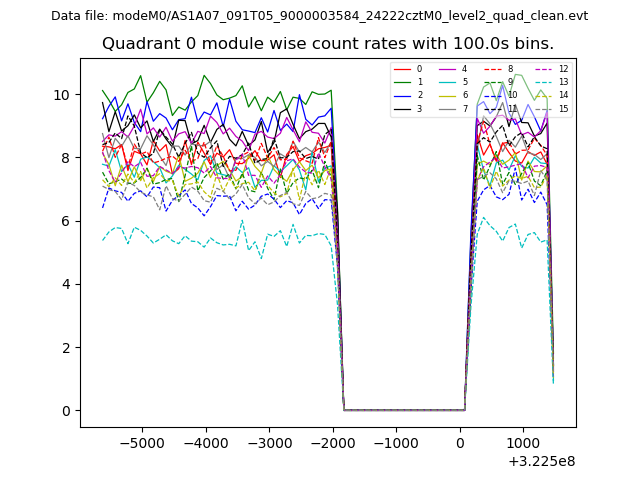 |
 |
| Module-wise count rates for Quadrant B Data is divided into 100 sec bins |
 |
 |
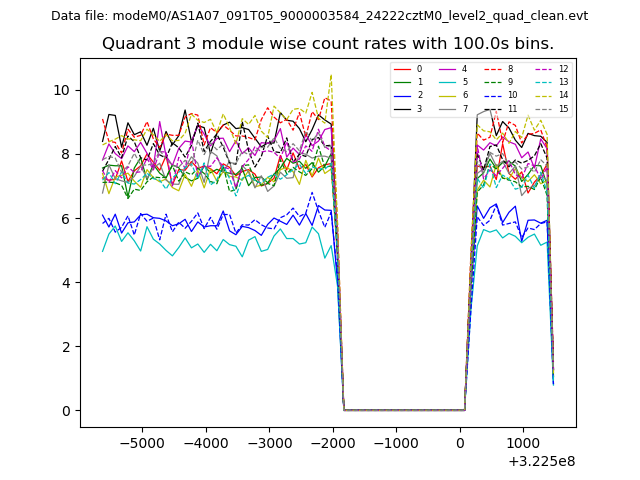
| Module-wise count rates for Quadrant C Data is divided into 100 sec bins |
 |
 |
| Module-wise count rates for Quadrant D Data is divided into 100 sec bins |
 |
 |
| Parameter | Plot |
|---|---|
| CZT HV Monitor | 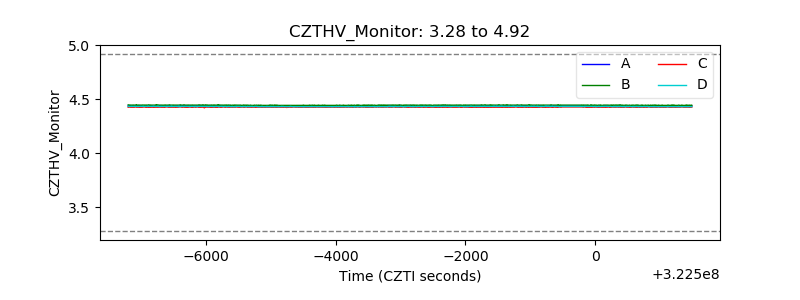 |
| D_VDD | 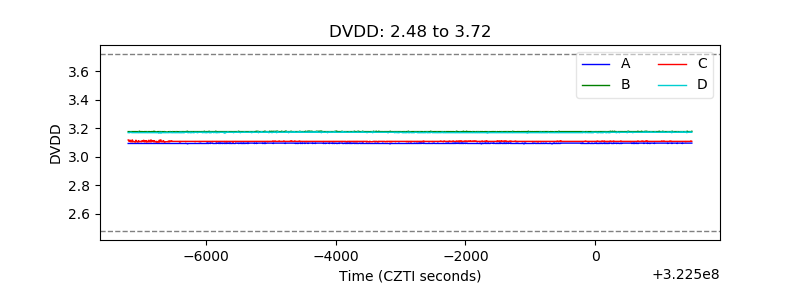 |
| Temperature 1 | 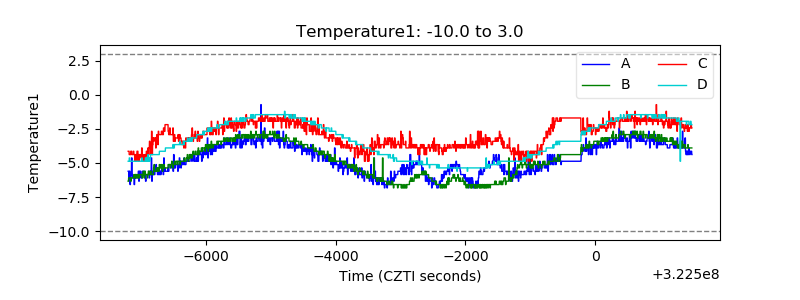 |
| Veto HV Monitor | 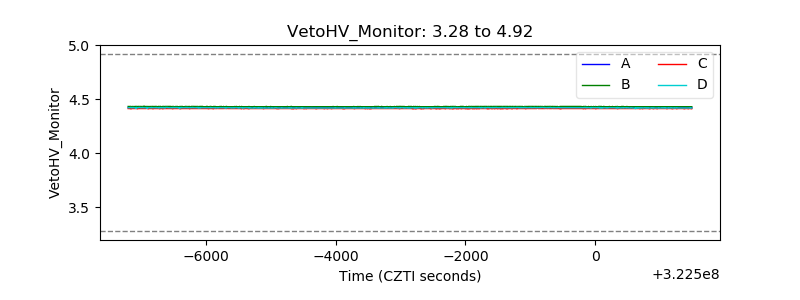 |
| Veto LLD | 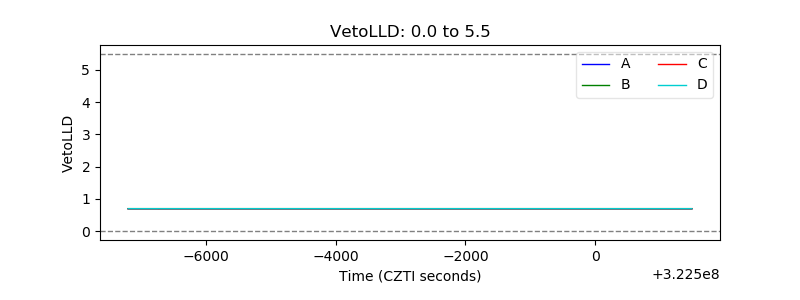 |
| Alpha Counter | 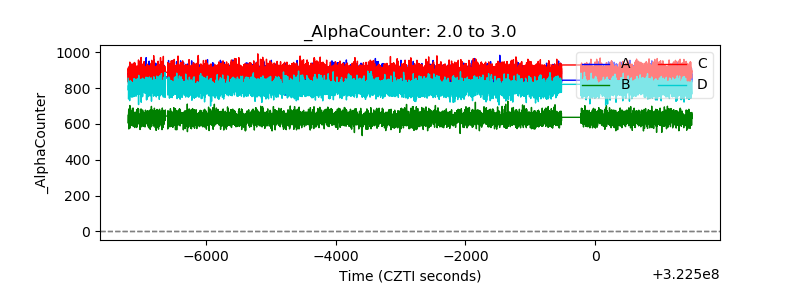 |
| _CPM_Rate | 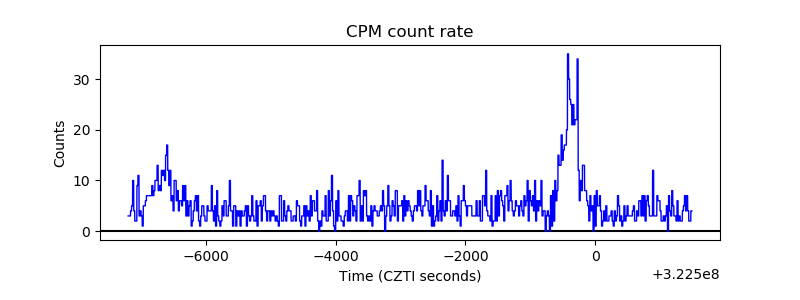 |
| CZT Counter |  |
| +2.5 Volts monitor |  |
| +5 Volts monitor |  |
| _ROLL_ROT | 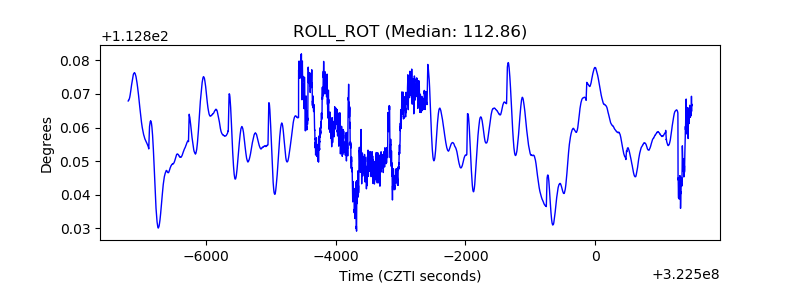 |
| _Roll_DEC |  |
| _Roll_RA |  |
| Veto Counter | 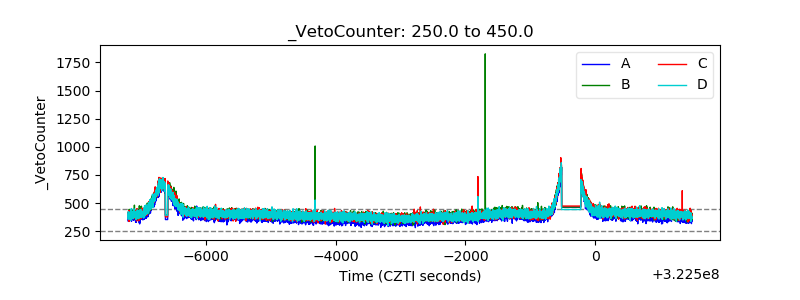 |