| Param | Original file | Final file |
|---|---|---|
| Filename | modeM0/AS1A07_118T01_9000003586cztM0_level2.fits | modeM0/AS1A07_118T01_9000003586cztM0_level2_quad_clean.evt |
| Size (bytes) | 2,255,621,760 | 1,922,731,200 |
| Size | 2.1 GB | 1.8 GB |
| Events in quadrant A | 14,000,832 | 11,185,928 |
| Events in quadrant B | 13,453,018 | 11,320,305 |
| Events in quadrant C | 13,698,302 | 10,629,206 |
| Events in quadrant D | 11,690,036 | 9,630,836 |
| Mode M0 | |||
|---|---|---|---|
| Quadrant | BADHDUFLAG | Total packets | Discarded packets |
| A | 0 | 484128 | 0 |
| B | 0 | 498601 | 0 |
| C | 0 | 513131 | 0 |
| D | 0 | 678342 | 0 |
| Mode SS | |||
|---|---|---|---|
| Quadrant | BADHDUFLAG | Total packets | Discarded packets |
| A | 0 | 4598 | 0 |
| B | 0 | 4604 | 0 |
| C | 0 | 4602 | 0 |
| D | 0 | 4604 | 0 |
| Mode M9 | |||
|---|---|---|---|
| Quadrant | BADHDUFLAG | Total packets | Discarded packets |
| A | 0 | 366 | 0 |
| B | 0 | 366 | 0 |
| C | 0 | 366 | 0 |
| D | 0 | 366 | 0 |
| Quadrant | Total seconds | Saturated seconds | Saturation percentage |
|---|---|---|---|
| A | 225705 | 3710 | 1.643739% |
| B | 225703 | 5548 | 2.458098% |
| C | 225717 | 5605 | 2.483198% |
| D | 225727 | 15836 | 7.015554% |
Noise dominated data is calculated using 1-second bins in cleaned event files. If a bin has >2000 counts, and if more than 50% of those come from <1% of pixels, then it is considered to be noise-dominated and hence unusable.
| Quadrant | # 1 sec bins | Bins with >0 counts | Bins with >2000 counts | High rate bins dominated by noise | Noise dominated (total time) | Noise dominated (detector-on time) | Marked lightcurve |
|---|---|---|---|---|---|---|---|
| A | 273987 | 225725 | 0 | 0 | 0.00% | 0.00% | 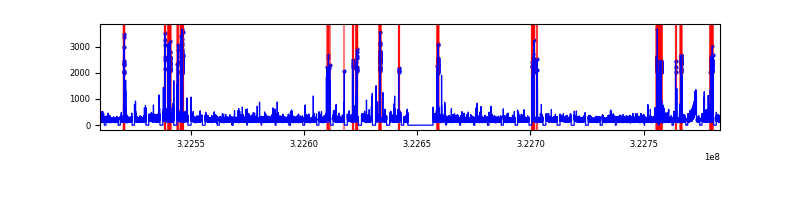 |
| B | 273987 | 225720 | 0 | 0 | 0.00% | 0.00% | 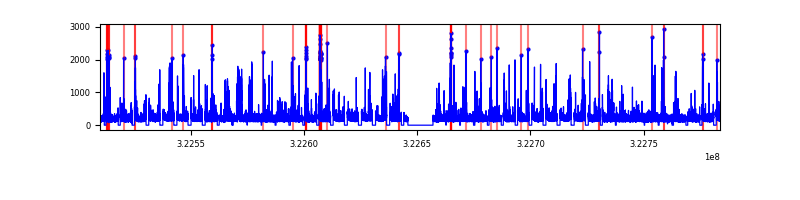 |
| C | 273987 | 225740 | 0 | 0 | 0.00% | 0.00% | 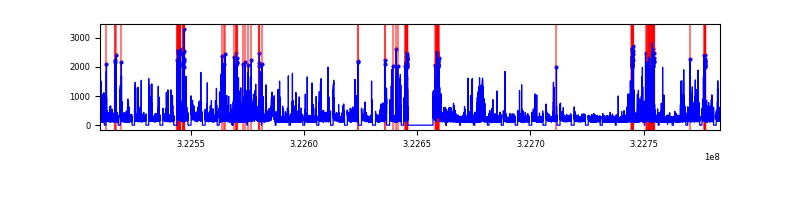 |
| D | 273987 | 225412 | 0 | 0 | 0.00% | 0.00% | 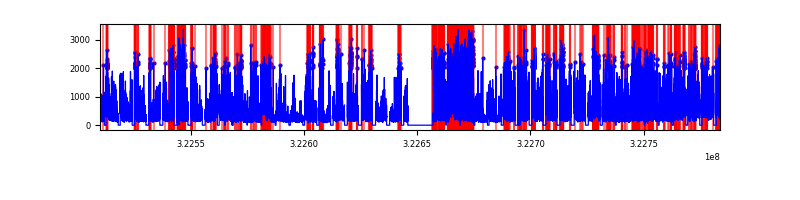 |
Top three noisy pixels from each quadrant. If the there are fewer than three noisy pixels in the level2.evt file, extra rows are filled as -1
| Pixel properties | Quadrant properties | ||||||
|---|---|---|---|---|---|---|---|
| Quadrant | DetID | PixID | Counts | Sigma | Mean | Median | Sigma |
| A | 0 | 29 | 13407 | 11.26 | 3645 | 3425 | 886.2 |
| A | 7 | 110 | 11040 | 8.59 | 3645 | 3425 | 886.2 |
| A | 9 | 19 | 10538 | 8.03 | 3645 | 3425 | 886.2 |
| B | 2 | 9 | 10880 | 10.75 | 3555 | 3387 | 696.9 |
| B | 2 | 8 | 9005 | 8.06 | 3555 | 3387 | 696.9 |
| B | 3 | 80 | 8819 | 7.79 | 3555 | 3387 | 696.9 |
| C | 12 | 241 | 9691 | 6.93 | 3622 | 3396 | 908.0 |
| C | 9 | 233 | 9119 | 6.3 | 3622 | 3396 | 908.0 |
| C | 3 | 187 | 9095 | 6.28 | 3622 | 3396 | 908.0 |
| D | 3 | 14 | 8487 | 6.21 | 3336 | 3042 | 876.7 |
| D | 6 | 231 | 8290 | 5.99 | 3336 | 3042 | 876.7 |
| D | 10 | 189 | 8228 | 5.91 | 3336 | 3042 | 876.7 |
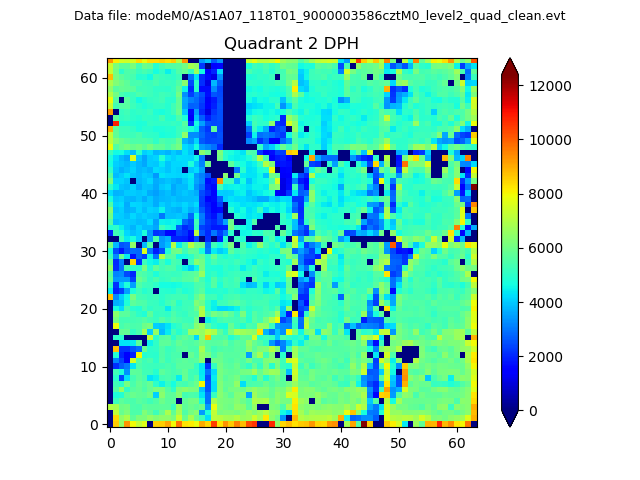
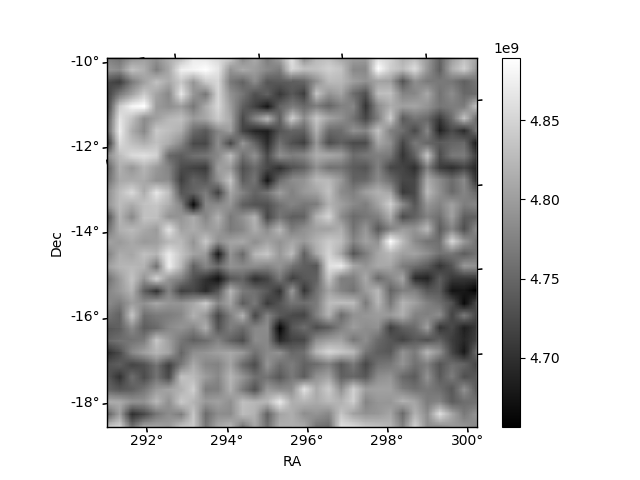
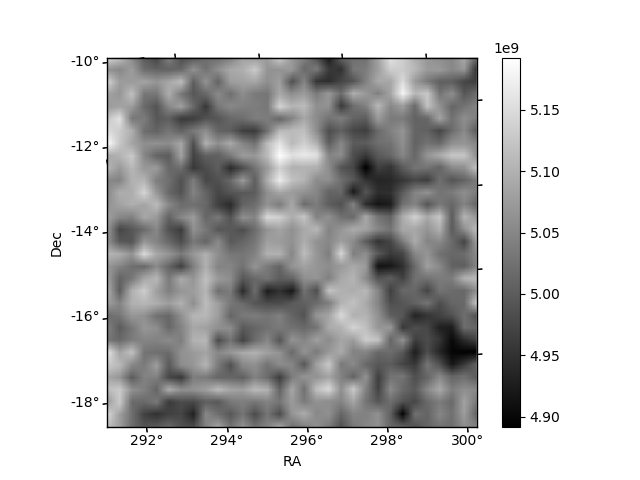
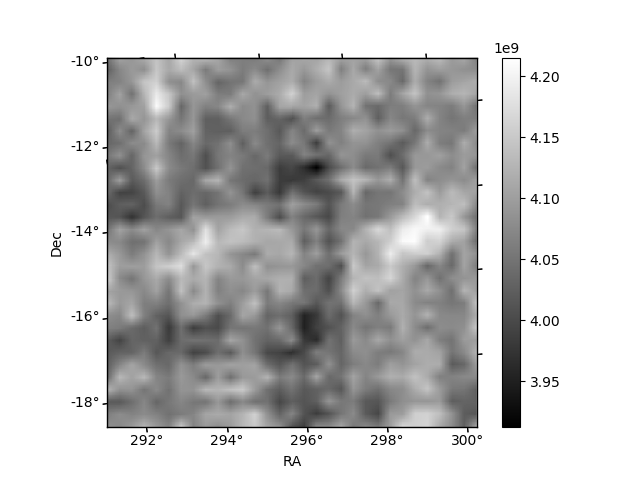
Histogram calculated using DETX and DETY for each event in the final _common_clean file
| Quadrant A | 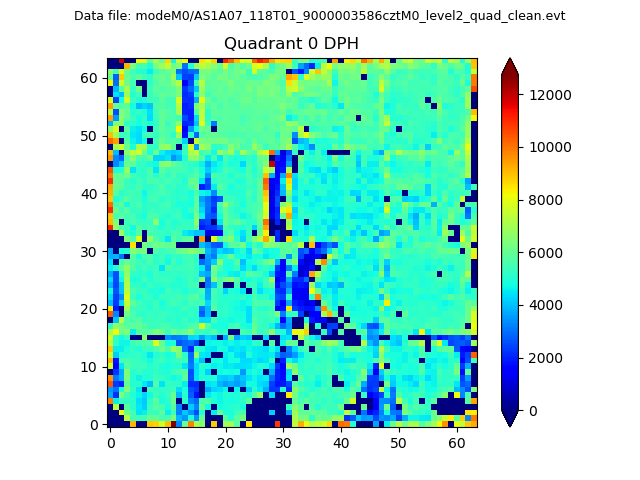 |
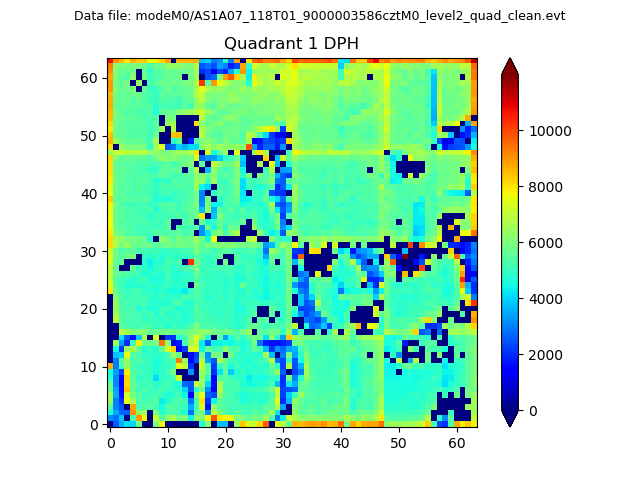 |
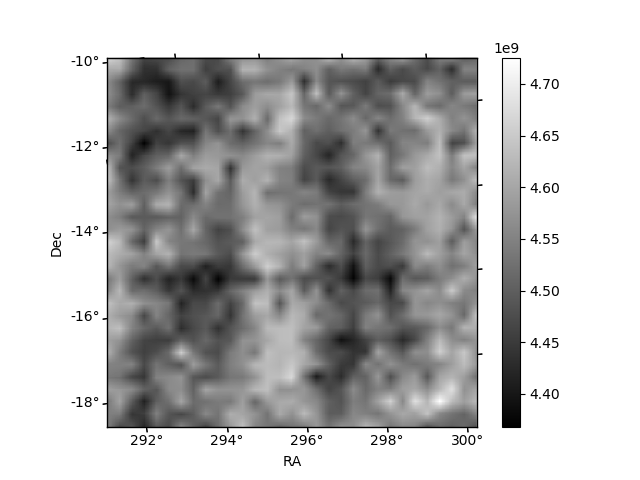
Quadrant B |
|---|---|---|---|
| Quadrant D | 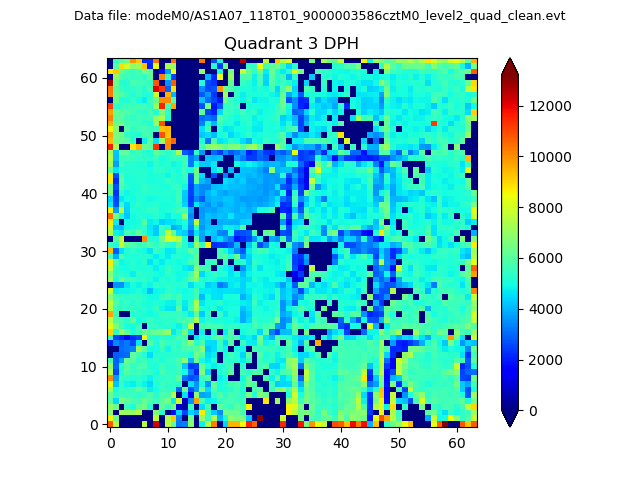 |
 |
Quadrant C |
| Plot type | Count rate plots | Images |
|---|---|---|
| Comparison with Poisson distribution Blue bars denote a histogram of data divided into 1 sec bins. Red curve is a Poisson curve with rate = median count rate of data. |
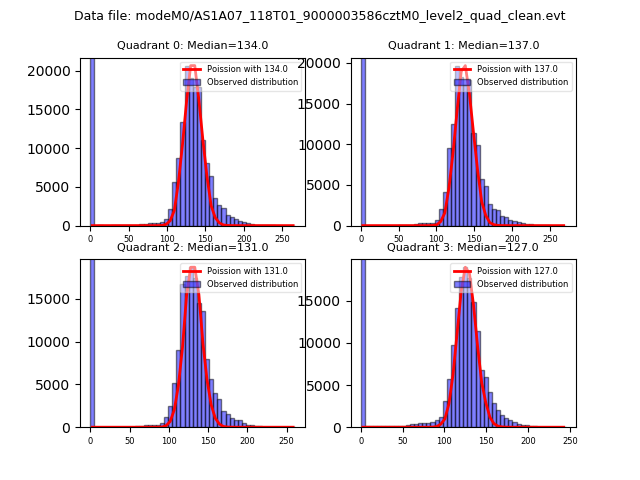 |
 |
| Quadrant-wise count rates Data is divided into 100 sec bins |
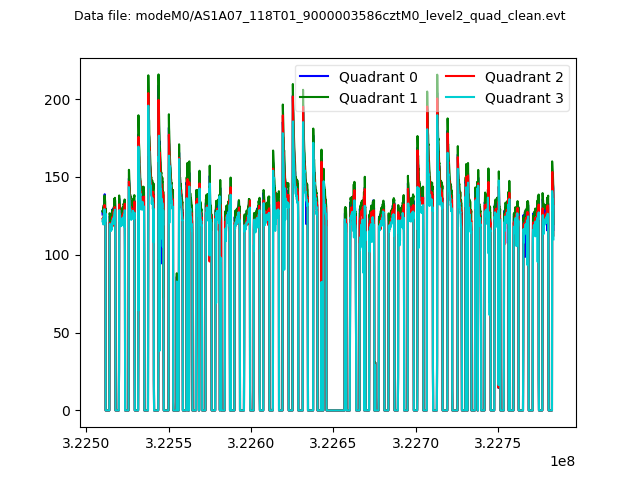 |
|
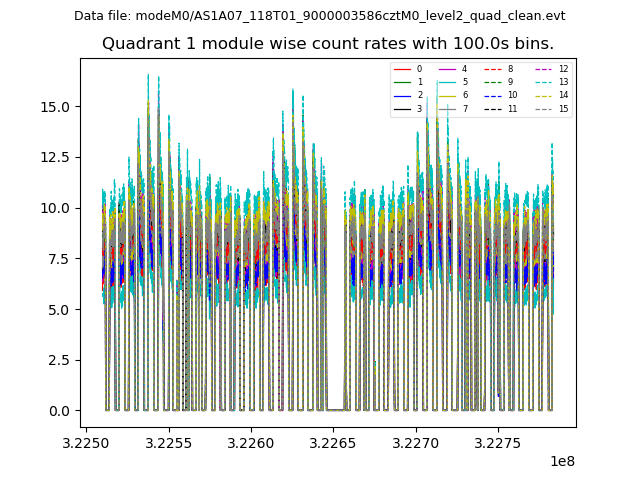
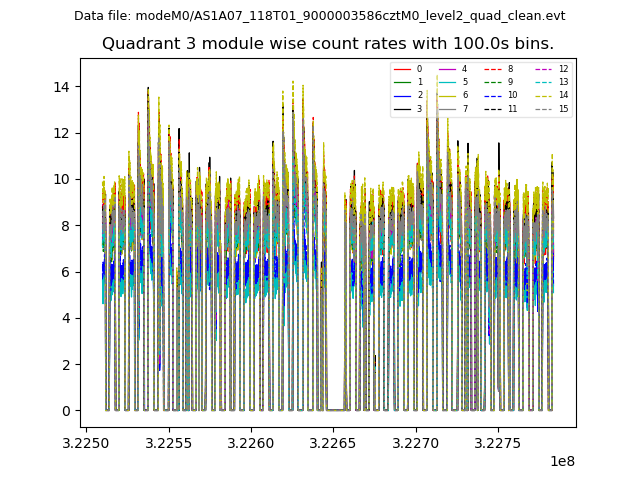
| Module-wise count rates for Quadrant A Data is divided into 100 sec bins |
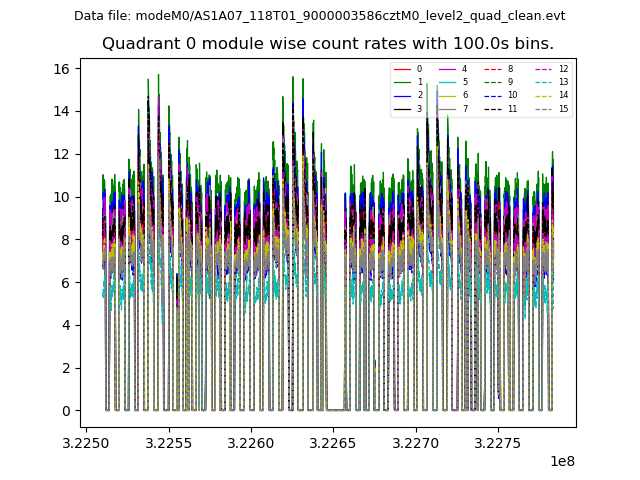 |
 |
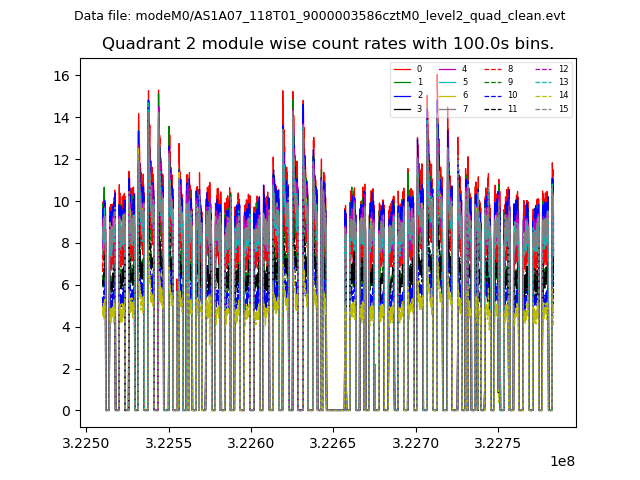
| Module-wise count rates for Quadrant B Data is divided into 100 sec bins |
 |
 |
| Module-wise count rates for Quadrant C Data is divided into 100 sec bins |
 |
 |
| Module-wise count rates for Quadrant D Data is divided into 100 sec bins |
 |
 |
| Parameter | Plot |
|---|---|
| CZT HV Monitor | 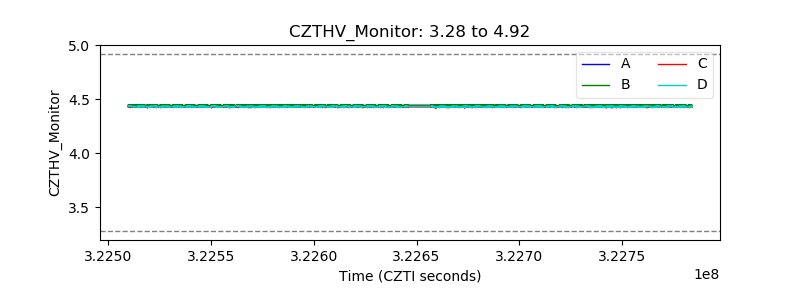 |
| D_VDD | 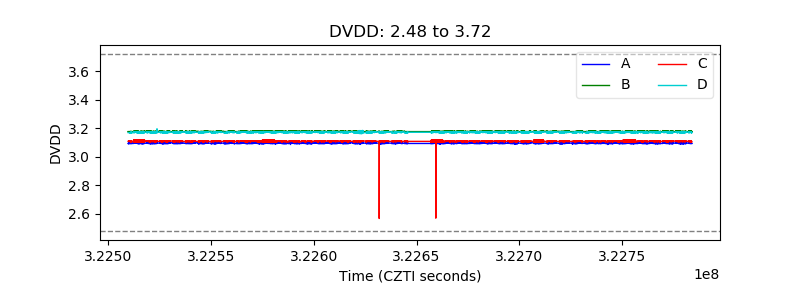 |
| Temperature 1 | 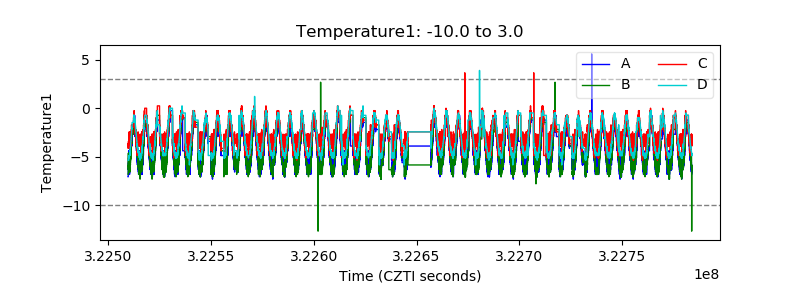 |
| Veto HV Monitor | 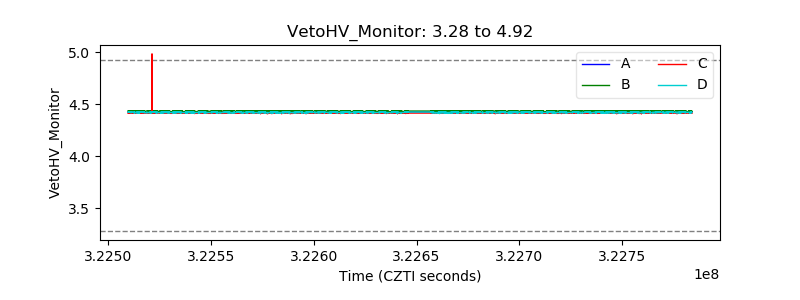 |
| Veto LLD | 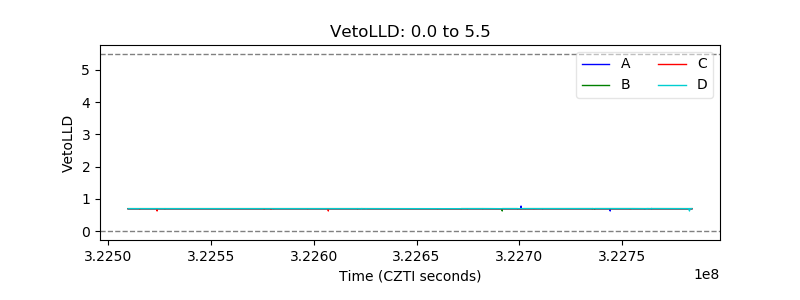 |
| Alpha Counter | 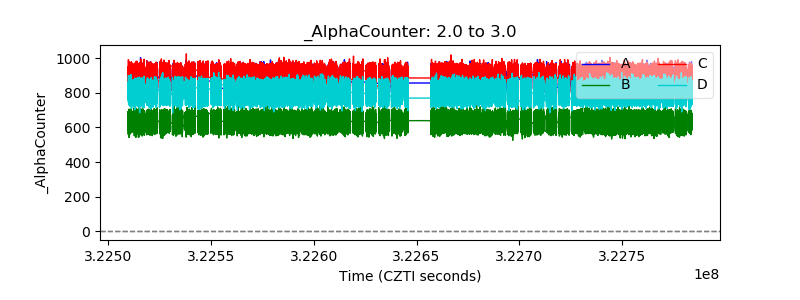 |
| _CPM_Rate | 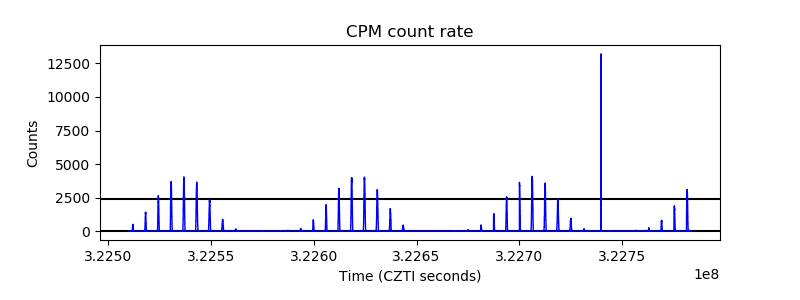 |
| CZT Counter | 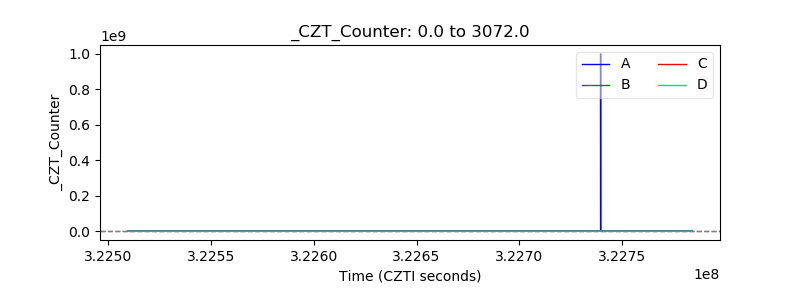 |
| +2.5 Volts monitor | 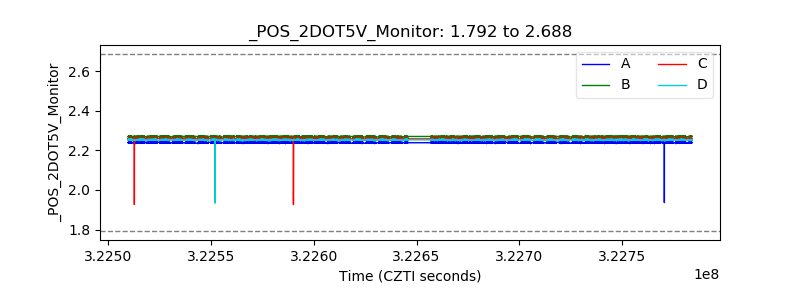 |
| +5 Volts monitor | 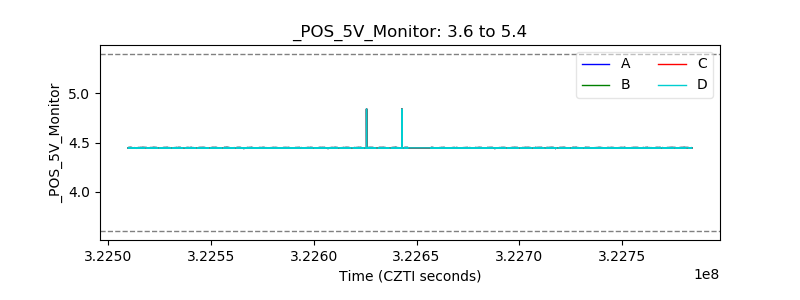 |
| _ROLL_ROT | 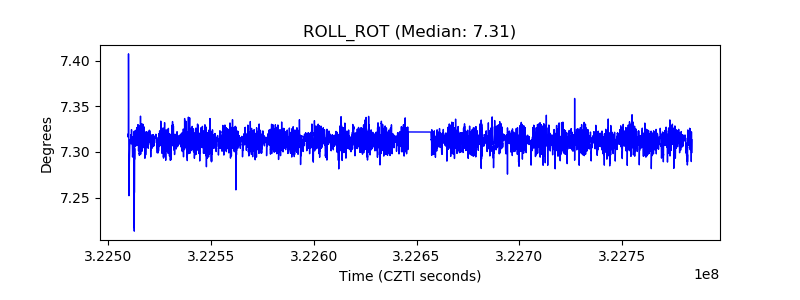 |
| _Roll_DEC | 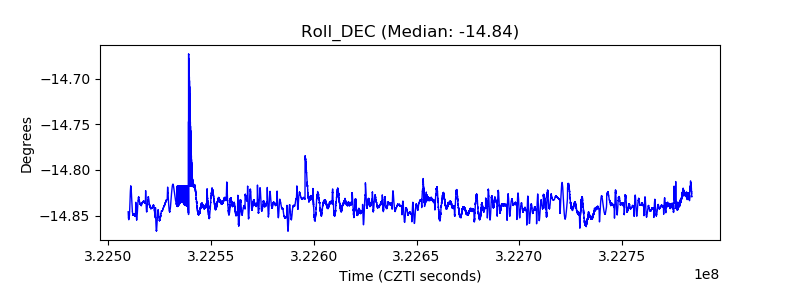 |
| _Roll_RA | 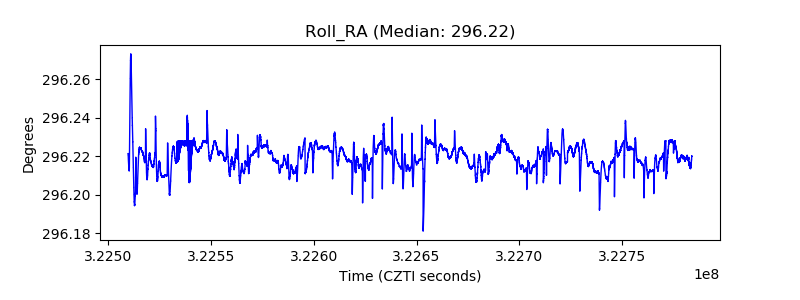 |
| Veto Counter | 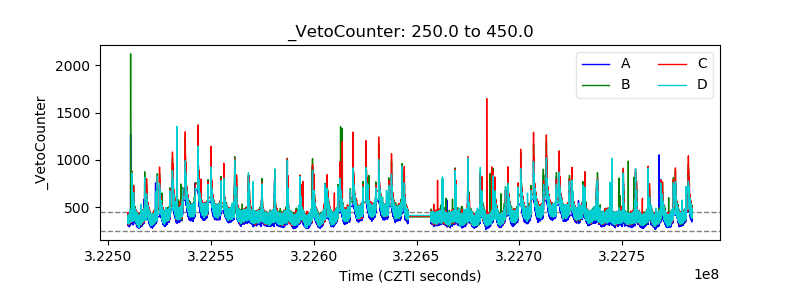 |