| Param | Original file | Final file |
|---|---|---|
| Filename | modeM0/AS1A07_118T01_9000003586_24224cztM0_level2.evt | modeM0/AS1A07_118T01_9000003586_24224cztM0_level2_quad_clean.evt |
| Size (bytes) | 319,510,080 | 40,449,600 |
| Size | 304.7 MB | 38.6 MB |
| Events in quadrant A | 1,749,514 | 247,183 |
| Events in quadrant B | 2,939,577 | 251,128 |
| Events in quadrant C | 1,937,703 | 239,863 |
| Events in quadrant D | 2,810,848 | 238,262 |
| Mode M0 | |||
|---|---|---|---|
| Quadrant | BADHDUFLAG | Total packets | Discarded packets |
| A | 0 | 7280 | 1 |
| B | 0 | 10956 | 1 |
| C | 0 | 7760 | 1 |
| D | 0 | 10673 | 1 |
| Mode SS | |||
|---|---|---|---|
| Quadrant | BADHDUFLAG | Total packets | Discarded packets |
| A | 0 | 72 | 0 |
| B | 0 | 72 | 0 |
| C | 0 | 72 | 0 |
| D | 0 | 72 | 0 |
| Mode M9 | |||
|---|---|---|---|
| Quadrant | BADHDUFLAG | Total packets | Discarded packets |
| A | 0 | 7 | 0 |
| B | 0 | 7 | 0 |
| C | 0 | 7 | 0 |
| D | 0 | 7 | 0 |
| Quadrant | Total seconds | Saturated seconds | Saturation percentage |
|---|---|---|---|
| A | 3499 | 36 | 1.028865% |
| B | 3499 | 625 | 17.862246% |
| C | 3499 | 92 | 2.629323% |
| D | 3499 | 178 | 5.087168% |
Noise dominated data is calculated using 1-second bins in cleaned event files. If a bin has >2000 counts, and if more than 50% of those come from <1% of pixels, then it is considered to be noise-dominated and hence unusable.
| Quadrant | # 1 sec bins | Bins with >0 counts | Bins with >2000 counts | High rate bins dominated by noise | Noise dominated (total time) | Noise dominated (detector-on time) | Marked lightcurve |
|---|---|---|---|---|---|---|---|
| A | 4224 | 3499 | 0 | 0 | 0.00% | 0.00% | 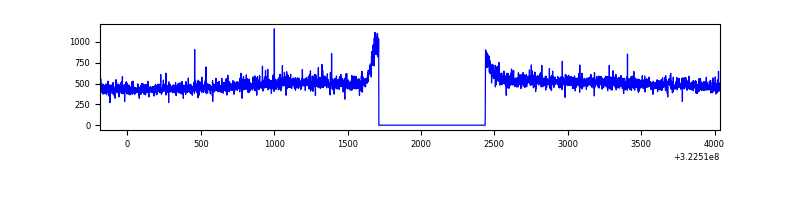 |
| B | 4224 | 3499 | 455 | 455 | 10.77% | 13.00% | 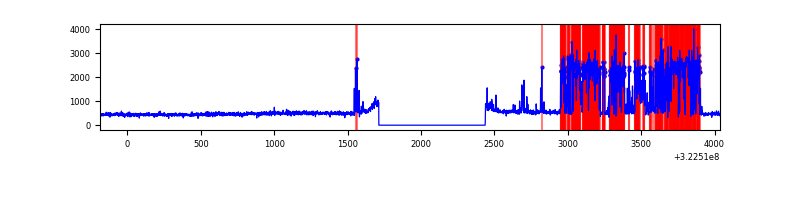 |
| C | 4224 | 3499 | 21 | 21 | 0.50% | 0.60% | 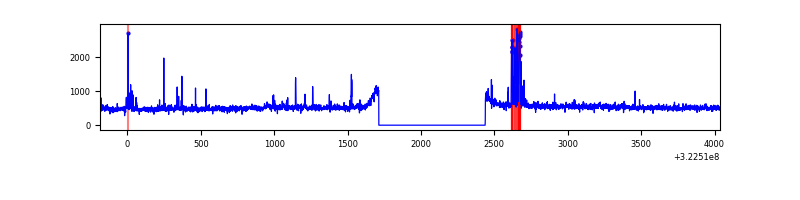 |
| D | 4224 | 3499 | 88 | 88 | 2.08% | 2.52% | 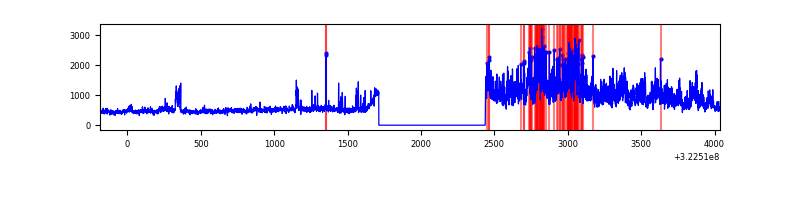 |
Top three noisy pixels from each quadrant. If the there are fewer than three noisy pixels in the level2.evt file, extra rows are filled as -1
| Pixel properties | Quadrant properties | ||||||
|---|---|---|---|---|---|---|---|
| Quadrant | DetID | PixID | Counts | Sigma | Mean | Median | Sigma |
| A | 3 | 1 | 9318 | 94.92 | 451 | 441 | 93.5 |
| A | 13 | 254 | 5834 | 57.67 | 451 | 441 | 93.5 |
| A | 3 | 137 | 3939 | 37.4 | 451 | 441 | 93.5 |
| B | 0 | 245 | 1275504 | 15845.99 | 408 | 397 | 80.5 |
| B | 15 | 33 | 29301 | 359.2 | 408 | 397 | 80.5 |
| B | 12 | 17 | 28581 | 350.25 | 408 | 397 | 80.5 |
| C | 2 | 16 | 128377 | 1251.84 | 427 | 430 | 102.2 |
| C | 14 | 238 | 67187 | 653.15 | 427 | 430 | 102.2 |
| C | 7 | 247 | 66813 | 649.49 | 427 | 430 | 102.2 |
| D | 8 | 195 | 963577 | 9002.74 | 434 | 420 | 107.0 |
| D | 7 | 238 | 111665 | 1039.82 | 434 | 420 | 107.0 |
| D | 12 | 233 | 92823 | 863.7 | 434 | 420 | 107.0 |
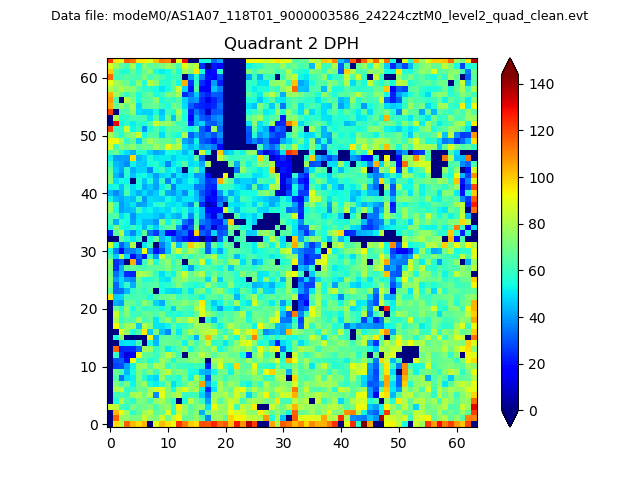
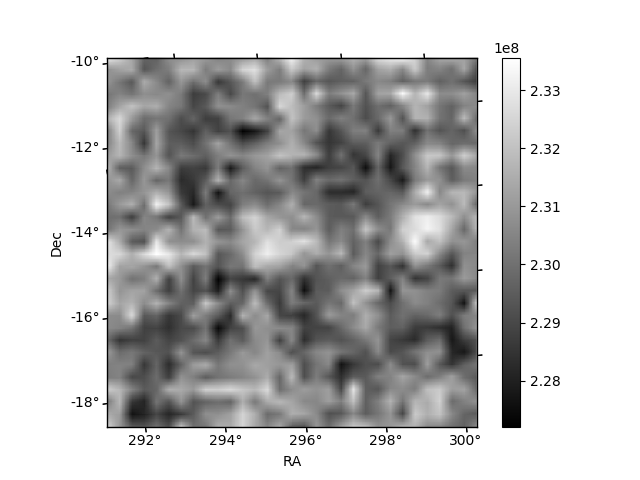
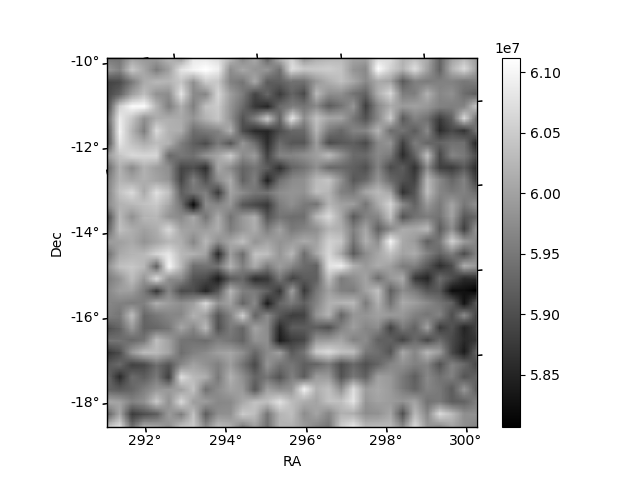
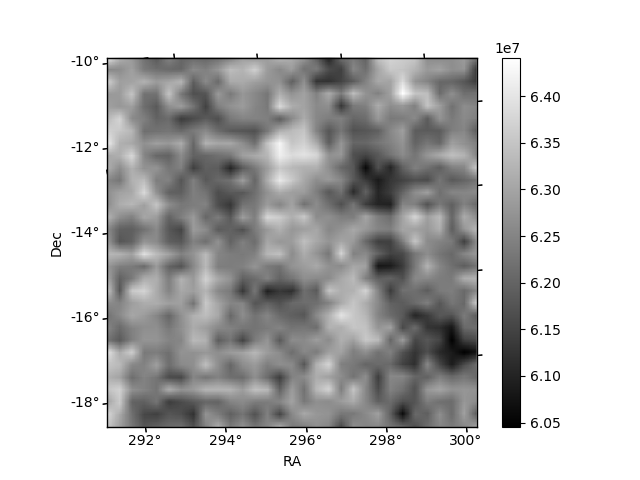
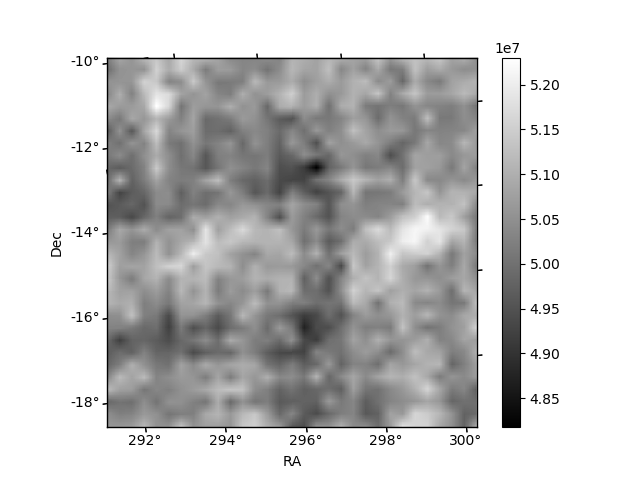
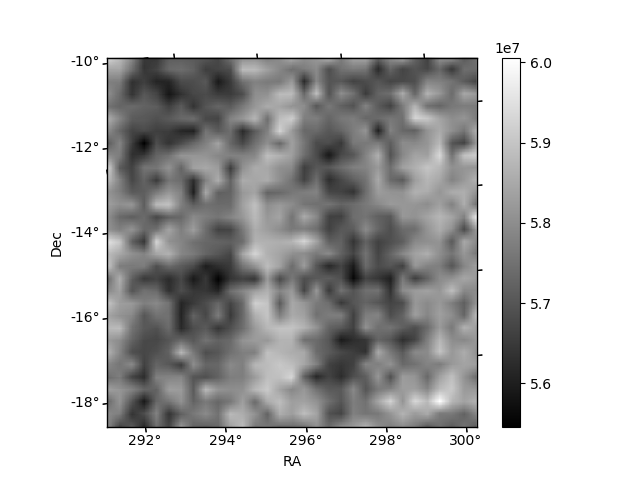
Histogram calculated using DETX and DETY for each event in the final _common_clean file
| Quadrant A | 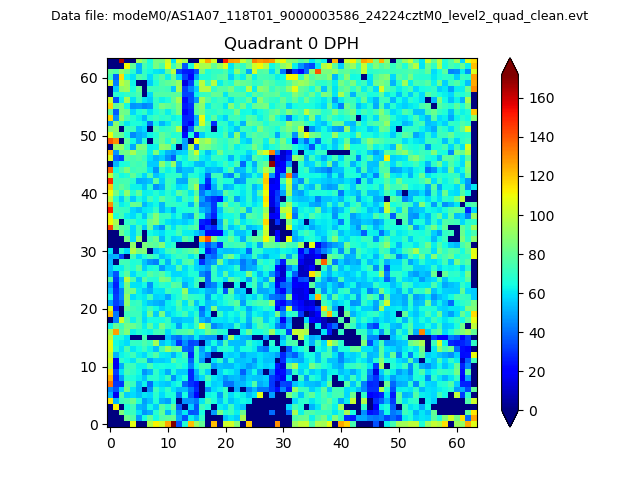 |
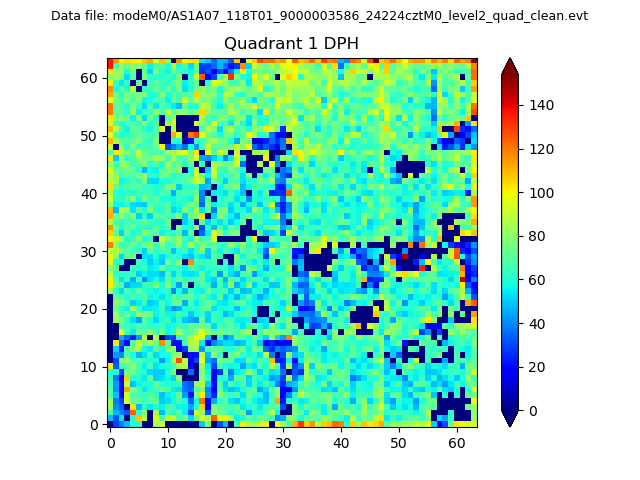 |
Quadrant B |
|---|---|---|---|
| Quadrant D | 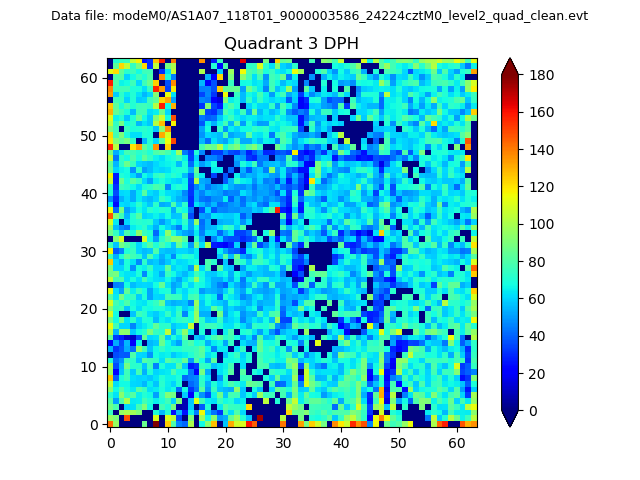 |
 |
Quadrant C |
| Plot type | Count rate plots | Images |
|---|---|---|
| Comparison with Poisson distribution Blue bars denote a histogram of data divided into 1 sec bins. Red curve is a Poisson curve with rate = median count rate of data. |
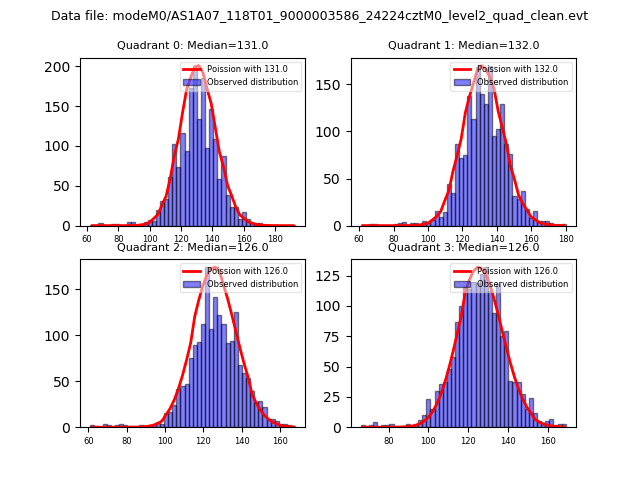 |
 |
| Quadrant-wise count rates Data is divided into 100 sec bins |
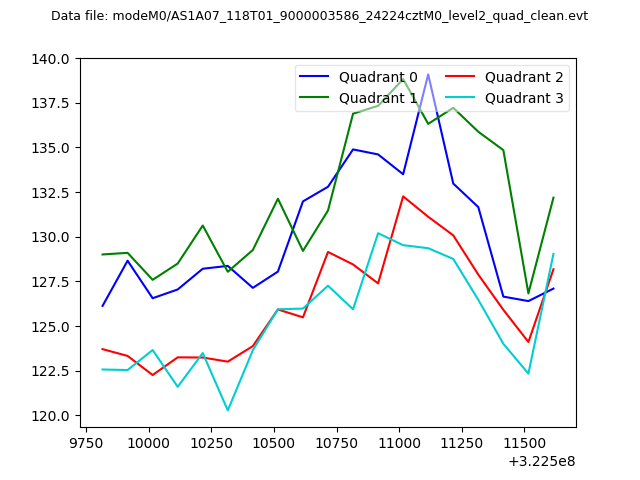 |
|
| Module-wise count rates for Quadrant A Data is divided into 100 sec bins |
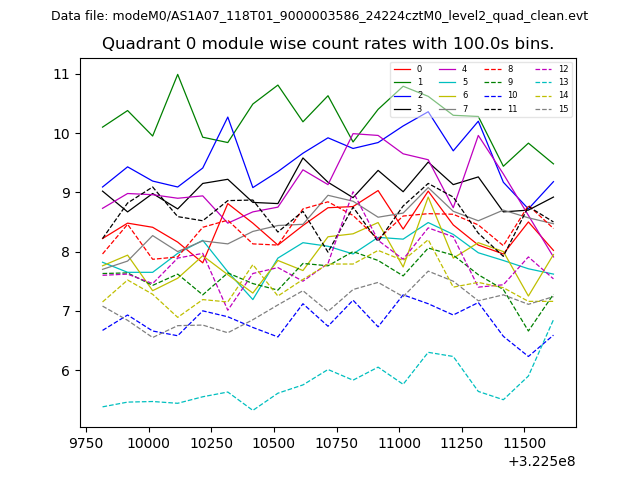 |
 |
| Module-wise count rates for Quadrant B Data is divided into 100 sec bins |
 |
 |
| Module-wise count rates for Quadrant C Data is divided into 100 sec bins |
 |
 |
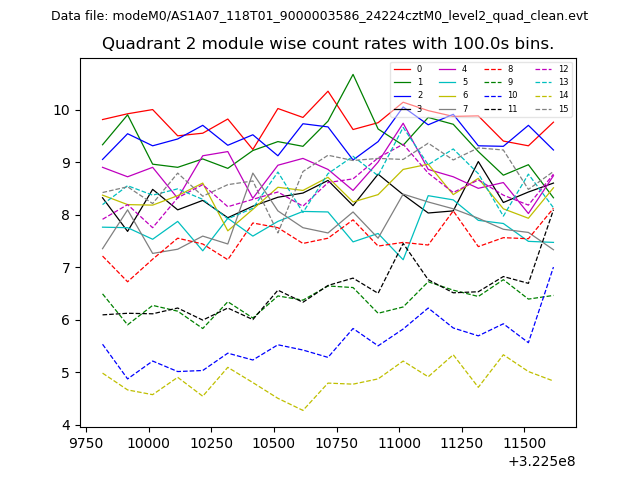
| Module-wise count rates for Quadrant D Data is divided into 100 sec bins |
 |
 |
| Parameter | Plot |
|---|---|
| CZT HV Monitor | 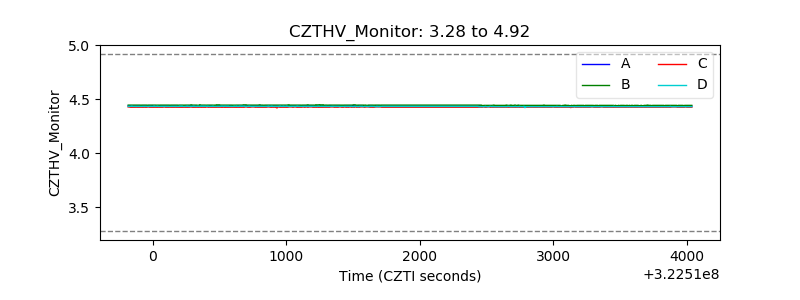 |
| D_VDD | 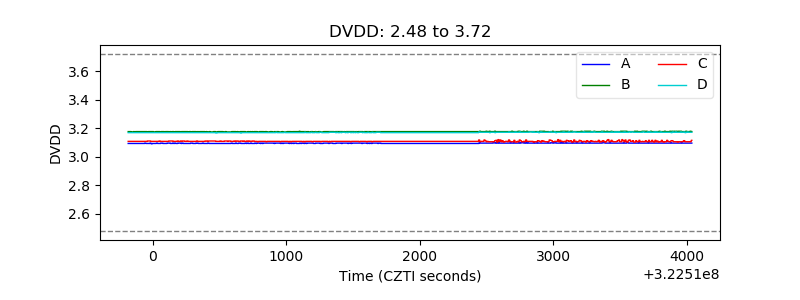 |
| Temperature 1 | 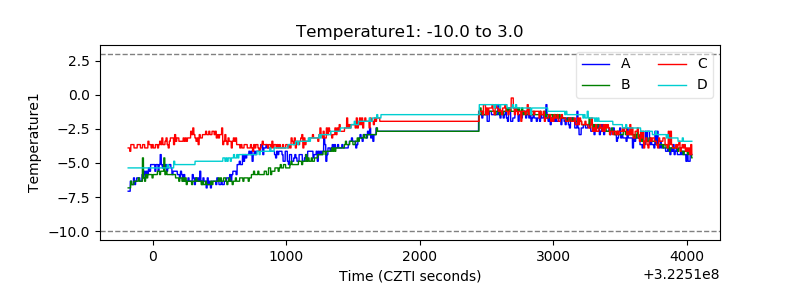 |
| Veto HV Monitor | 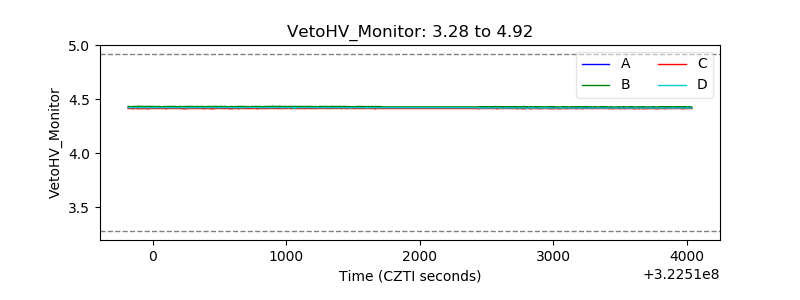 |
| Veto LLD | 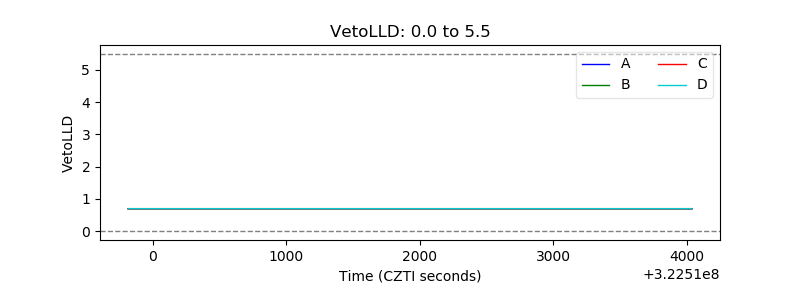 |
| Alpha Counter | 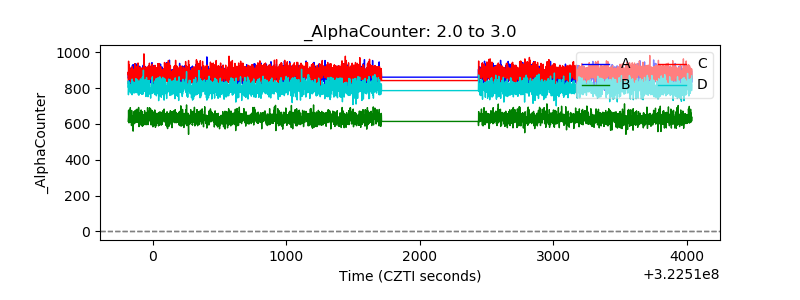 |
| _CPM_Rate | 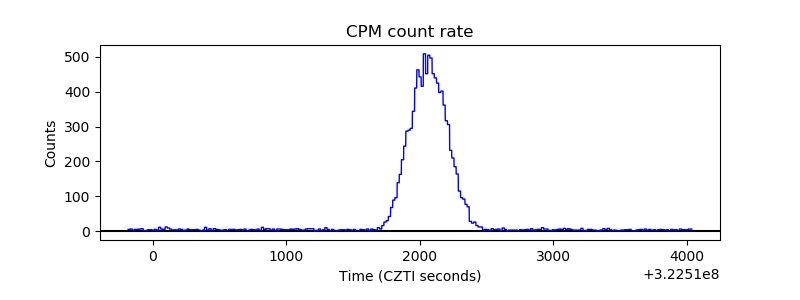 |
| CZT Counter | 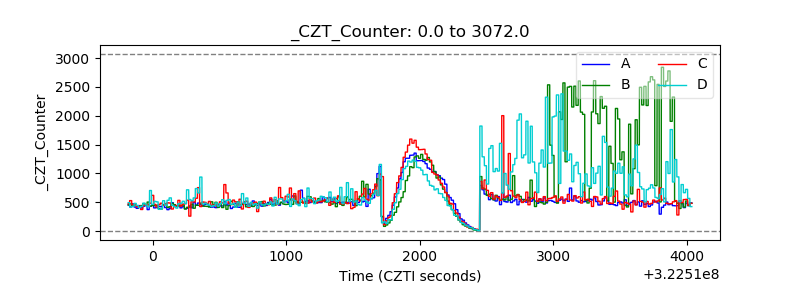 |
| +2.5 Volts monitor |  |
| +5 Volts monitor |  |
| _ROLL_ROT |  |
| _Roll_DEC | 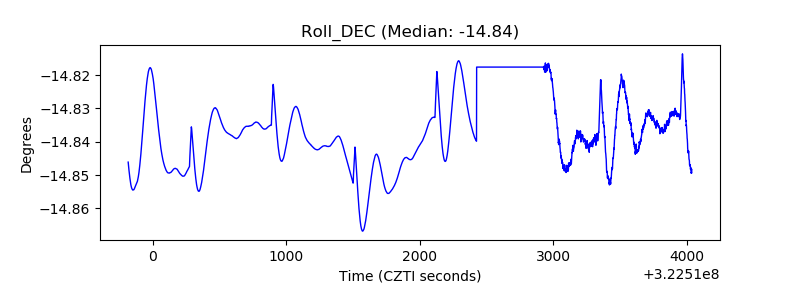 |
| _Roll_RA | 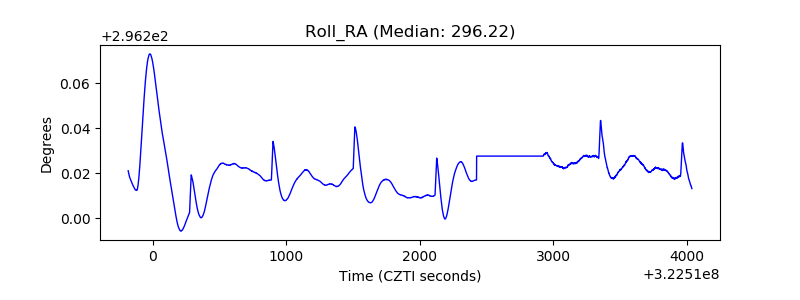 |
| Veto Counter |  |