| Param | Original file | Final file |
|---|---|---|
| Filename | modeM0/AS1A07_118T01_9000003586_24225cztM0_level2.evt | modeM0/AS1A07_118T01_9000003586_24225cztM0_level2_quad_clean.evt |
| Size (bytes) | 570,672,000 | 78,825,600 |
| Size | 544.2 MB | 75.2 MB |
| Events in quadrant A | 3,281,629 | 487,912 |
| Events in quadrant B | 4,514,418 | 492,389 |
| Events in quadrant C | 3,714,782 | 469,380 |
| Events in quadrant D | 5,313,016 | 465,231 |
| Mode M0 | |||
|---|---|---|---|
| Quadrant | BADHDUFLAG | Total packets | Discarded packets |
| A | 0 | 14004 | 2 |
| B | 0 | 17745 | 3 |
| C | 0 | 14938 | 2 |
| D | 0 | 20373 | 2 |
| Mode SS | |||
|---|---|---|---|
| Quadrant | BADHDUFLAG | Total packets | Discarded packets |
| A | 0 | 138 | 0 |
| B | 0 | 138 | 0 |
| C | 0 | 138 | 0 |
| D | 0 | 138 | 0 |
| Mode M9 | |||
|---|---|---|---|
| Quadrant | BADHDUFLAG | Total packets | Discarded packets |
| A | 0 | 13 | 0 |
| B | 0 | 14 | 0 |
| C | 0 | 14 | 0 |
| D | 0 | 14 | 0 |
| Quadrant | Total seconds | Saturated seconds | Saturation percentage |
|---|---|---|---|
| A | 6771 | 51 | 0.753212% |
| B | 6770 | 643 | 9.497784% |
| C | 6770 | 150 | 2.215657% |
| D | 6770 | 240 | 3.545052% |
Noise dominated data is calculated using 1-second bins in cleaned event files. If a bin has >2000 counts, and if more than 50% of those come from <1% of pixels, then it is considered to be noise-dominated and hence unusable.
| Quadrant | # 1 sec bins | Bins with >0 counts | Bins with >2000 counts | High rate bins dominated by noise | Noise dominated (total time) | Noise dominated (detector-on time) | Marked lightcurve |
|---|---|---|---|---|---|---|---|
| A | 7686 | 6771 | 0 | 0 | 0.00% | 0.00% |  |
| B | 7685 | 6770 | 453 | 453 | 5.89% | 6.69% |  |
| C | 7685 | 6770 | 31 | 31 | 0.40% | 0.46% |  |
| D | 7685 | 6770 | 110 | 110 | 1.43% | 1.62% |  |
Top three noisy pixels from each quadrant. If the there are fewer than three noisy pixels in the level2.evt file, extra rows are filled as -1
| Pixel properties | Quadrant properties | ||||||
|---|---|---|---|---|---|---|---|
| Quadrant | DetID | PixID | Counts | Sigma | Mean | Median | Sigma |
| A | 13 | 254 | 11606 | 62.65 | 849 | 830 | 172.0 |
| A | 3 | 137 | 7427 | 38.35 | 849 | 830 | 172.0 |
| A | 0 | 226 | 7209 | 37.08 | 849 | 830 | 172.0 |
| B | 0 | 245 | 1284949 | 8292.61 | 808 | 788 | 154.9 |
| B | 15 | 33 | 44967 | 285.29 | 808 | 788 | 154.9 |
| B | 12 | 111 | 18635 | 115.25 | 808 | 788 | 154.9 |
| C | 2 | 16 | 232780 | 1216.6 | 810 | 815 | 190.7 |
| C | 7 | 247 | 176788 | 922.93 | 810 | 815 | 190.7 |
| C | 14 | 238 | 127218 | 662.95 | 810 | 815 | 190.7 |
| D | 8 | 195 | 1666090 | 8258.64 | 822 | 799 | 201.6 |
| D | 12 | 233 | 277024 | 1369.88 | 822 | 799 | 201.6 |
| D | 7 | 238 | 249863 | 1235.18 | 822 | 799 | 201.6 |
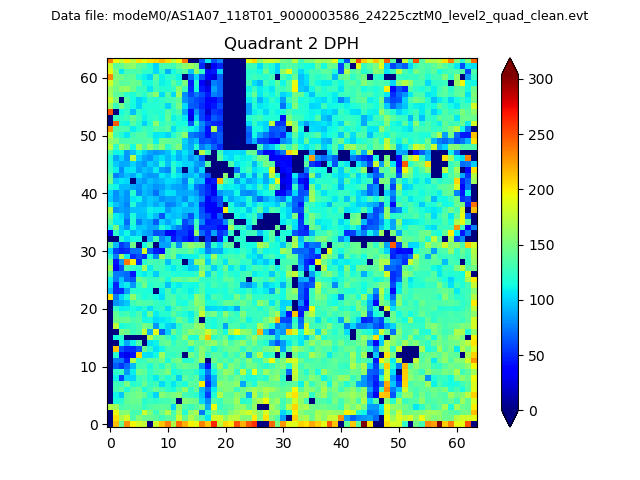
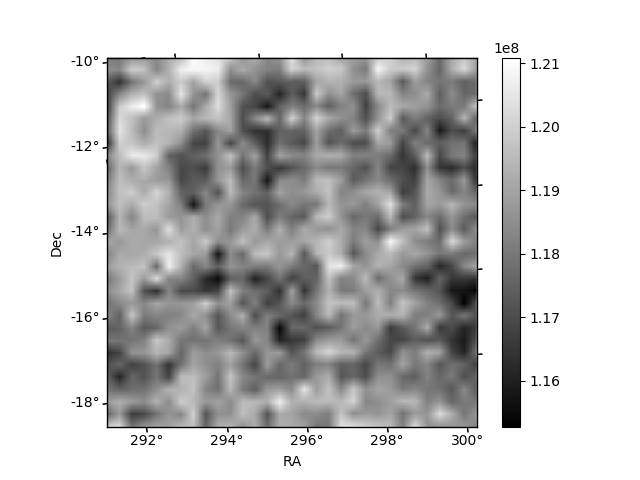
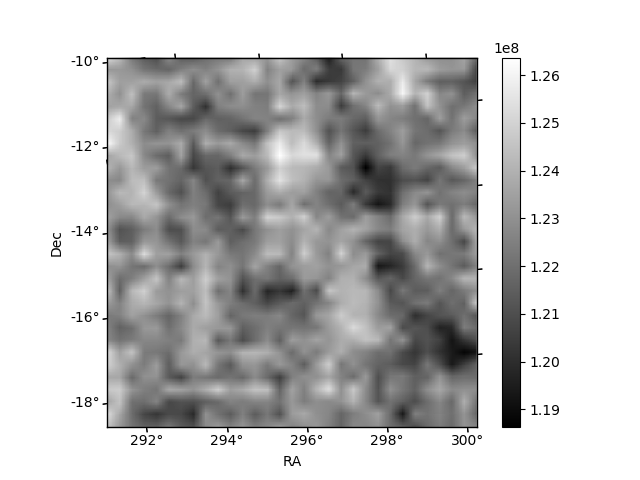
Histogram calculated using DETX and DETY for each event in the final _common_clean file
| Quadrant A | 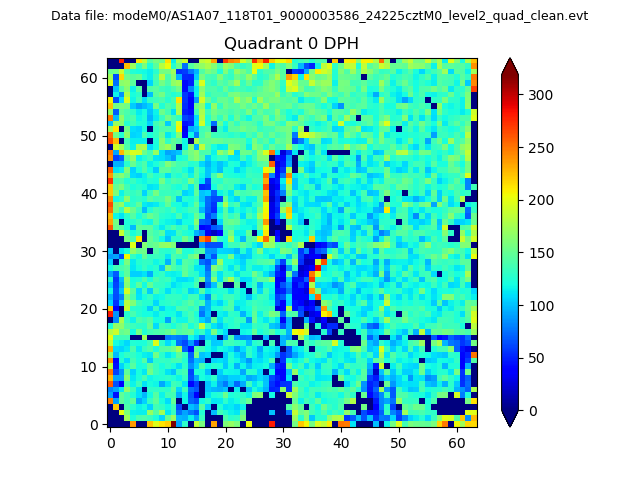 |
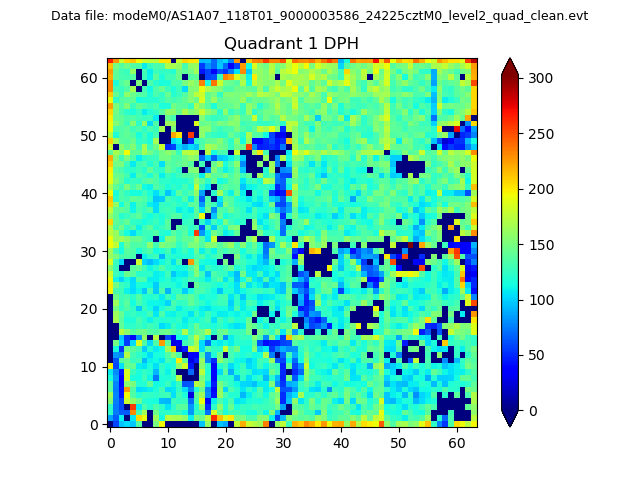 |
Quadrant B |
|---|---|---|---|
| Quadrant D | 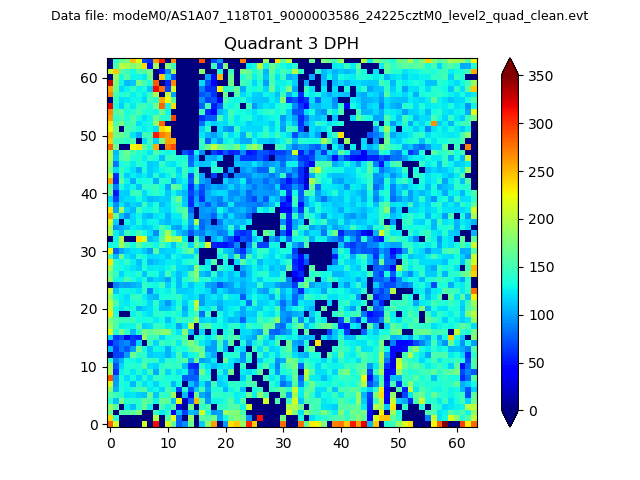 |
 |
Quadrant C |
| Plot type | Count rate plots | Images |
|---|---|---|
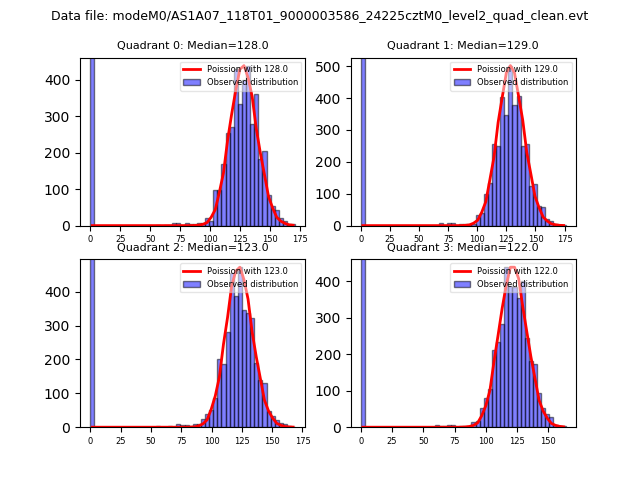
| Comparison with Poisson distribution Blue bars denote a histogram of data divided into 1 sec bins. Red curve is a Poisson curve with rate = median count rate of data. |
 |
 |
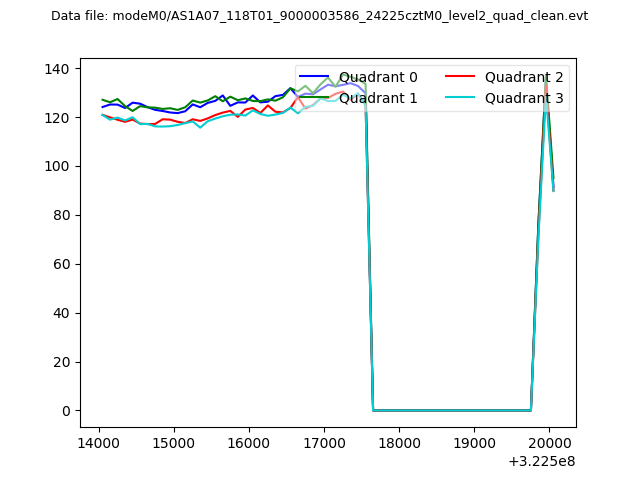
| Quadrant-wise count rates Data is divided into 100 sec bins |
 |
|
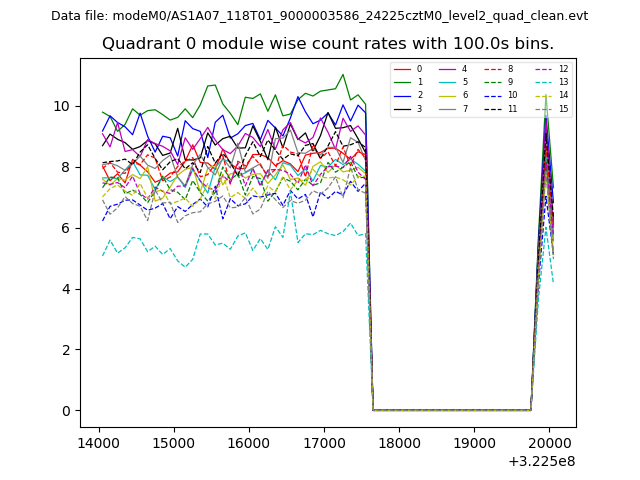
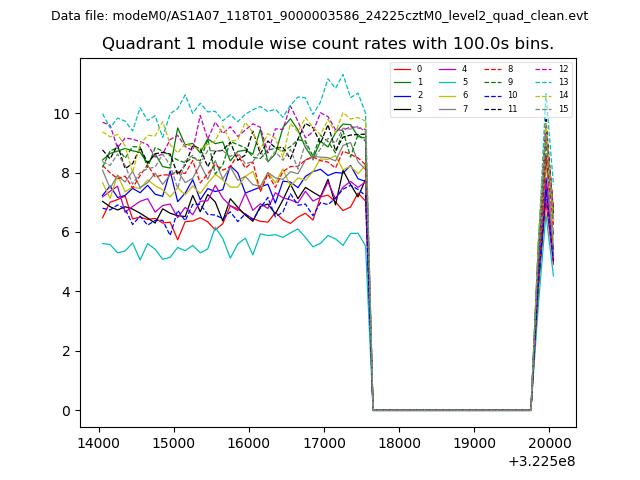
| Module-wise count rates for Quadrant A Data is divided into 100 sec bins |
 |
 |
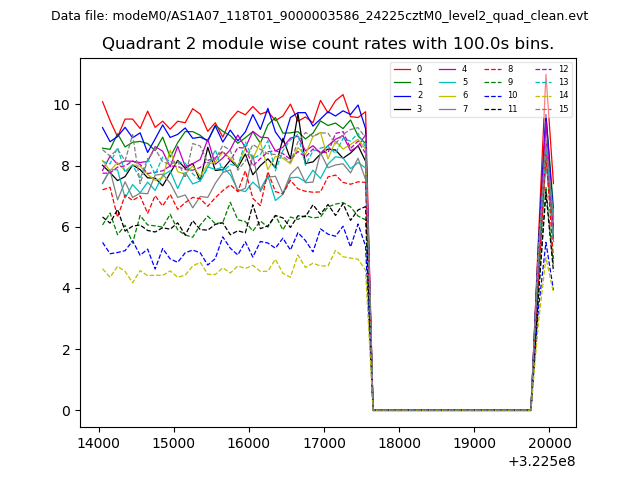
| Module-wise count rates for Quadrant B Data is divided into 100 sec bins |
 |
 |
| Module-wise count rates for Quadrant C Data is divided into 100 sec bins |
 |
 |
| Module-wise count rates for Quadrant D Data is divided into 100 sec bins |
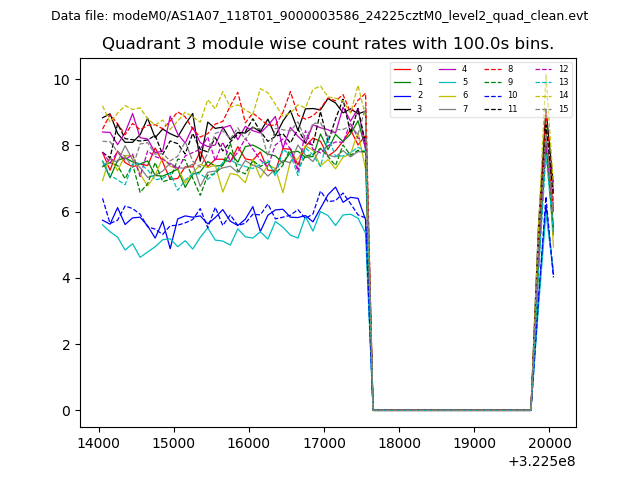 |
 |
| Parameter | Plot |
|---|---|
| CZT HV Monitor | 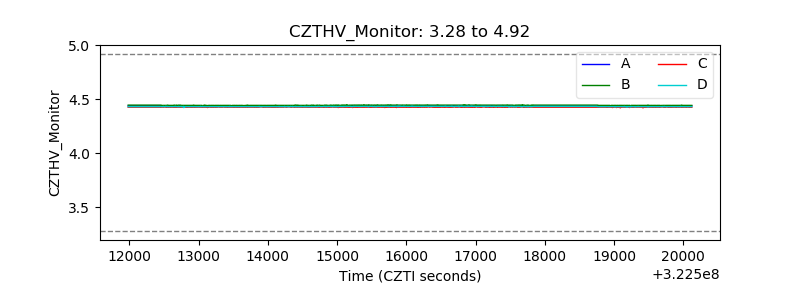 |
| D_VDD | 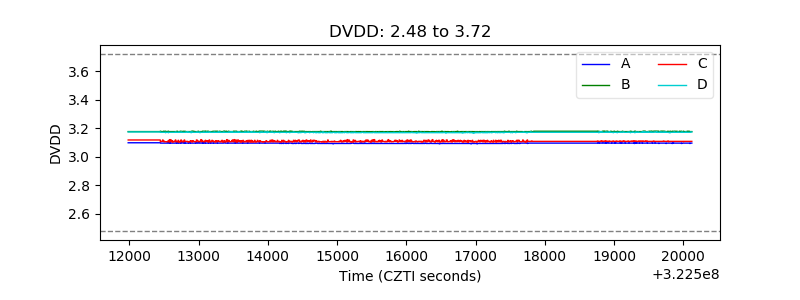 |
| Temperature 1 | 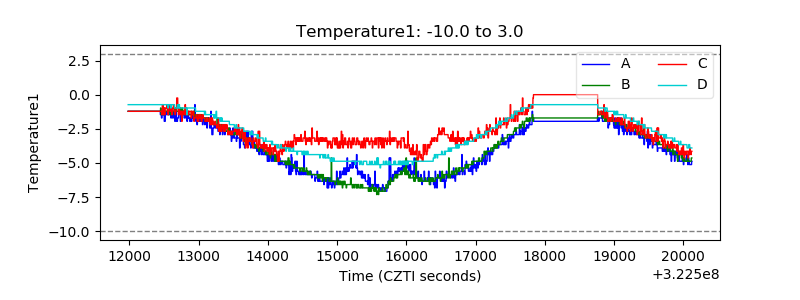 |
| Veto HV Monitor | 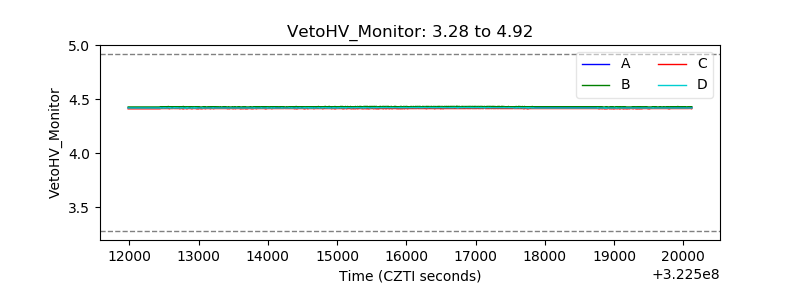 |
| Veto LLD | 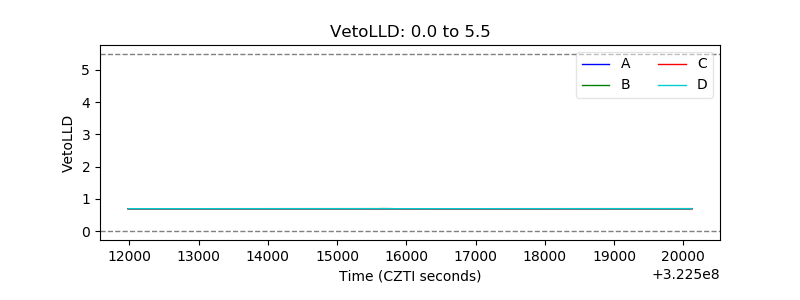 |
| Alpha Counter | 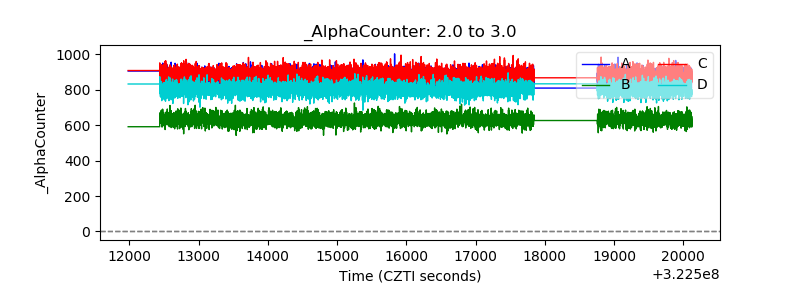 |
| _CPM_Rate | 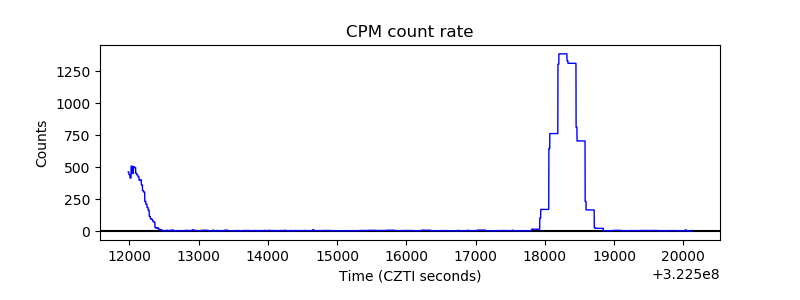 |
| CZT Counter | 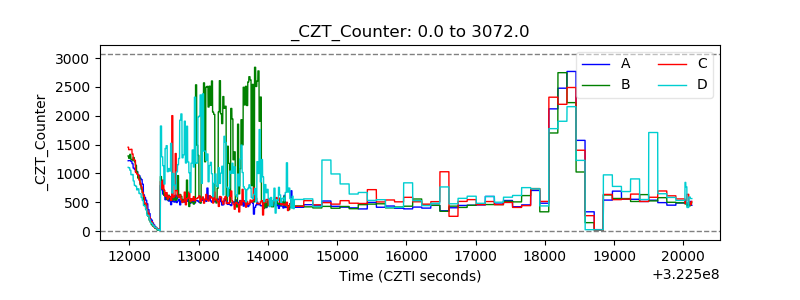 |
| +2.5 Volts monitor |  |
| +5 Volts monitor |  |
| _ROLL_ROT | 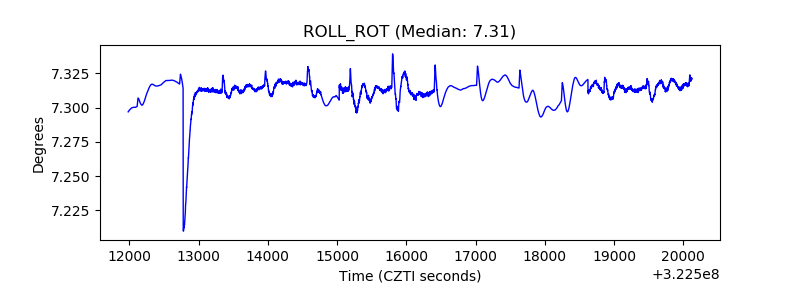 |
| _Roll_DEC | 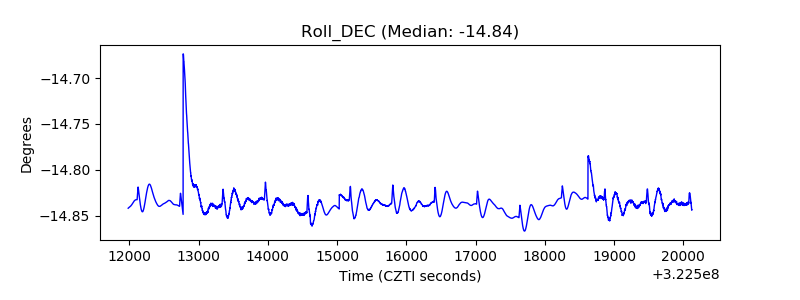 |
| _Roll_RA | 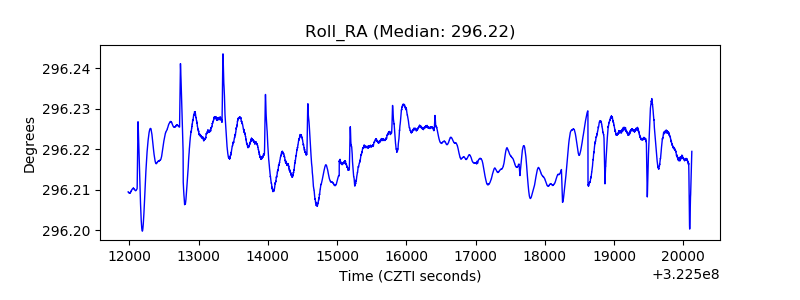 |
| Veto Counter | 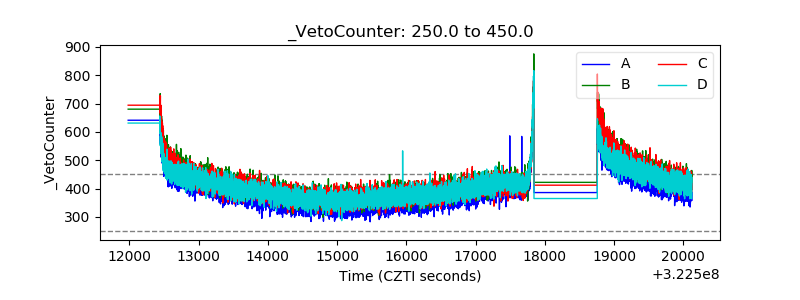 |