| Param | Original file | Final file |
|---|---|---|
| Filename | modeM0/AS1A07_118T01_9000003586_24228cztM0_level2.evt | modeM0/AS1A07_118T01_9000003586_24228cztM0_level2_quad_clean.evt |
| Size (bytes) | 498,381,120 | 100,664,640 |
| Size | 475.3 MB | 96.0 MB |
| Events in quadrant A | 3,252,483 | 659,448 |
| Events in quadrant B | 3,437,825 | 679,009 |
| Events in quadrant C | 3,550,290 | 647,125 |
| Events in quadrant D | 4,419,074 | 616,920 |
| Mode M0 | |||
|---|---|---|---|
| Quadrant | BADHDUFLAG | Total packets | Discarded packets |
| A | 0 | 13823 | 2 |
| B | 0 | 14363 | 2 |
| C | 0 | 14450 | 2 |
| D | 0 | 17288 | 2 |
| Mode SS | |||
|---|---|---|---|
| Quadrant | BADHDUFLAG | Total packets | Discarded packets |
| A | 0 | 130 | 0 |
| B | 0 | 130 | 0 |
| C | 0 | 130 | 0 |
| D | 0 | 130 | 0 |
| Mode M9 | |||
|---|---|---|---|
| Quadrant | BADHDUFLAG | Total packets | Discarded packets |
| A | 0 | 14 | 0 |
| B | 0 | 15 | 0 |
| C | 0 | 15 | 0 |
| D | 0 | 15 | 0 |
| Quadrant | Total seconds | Saturated seconds | Saturation percentage |
|---|---|---|---|
| A | 6394 | 38 | 0.594307% |
| B | 6394 | 106 | 1.657804% |
| C | 6394 | 99 | 1.548327% |
| D | 6394 | 239 | 3.737879% |
Noise dominated data is calculated using 1-second bins in cleaned event files. If a bin has >2000 counts, and if more than 50% of those come from <1% of pixels, then it is considered to be noise-dominated and hence unusable.
| Quadrant | # 1 sec bins | Bins with >0 counts | Bins with >2000 counts | High rate bins dominated by noise | Noise dominated (total time) | Noise dominated (detector-on time) | Marked lightcurve |
|---|---|---|---|---|---|---|---|
| A | 7609 | 6394 | 0 | 0 | 0.00% | 0.00% |  |
| B | 7609 | 6394 | 28 | 28 | 0.37% | 0.44% |  |
| C | 7609 | 6395 | 2 | 2 | 0.03% | 0.03% |  |
| D | 7609 | 6395 | 180 | 180 | 2.37% | 2.81% |  |
Top three noisy pixels from each quadrant. If the there are fewer than three noisy pixels in the level2.evt file, extra rows are filled as -1
| Pixel properties | Quadrant properties | ||||||
|---|---|---|---|---|---|---|---|
| Quadrant | DetID | PixID | Counts | Sigma | Mean | Median | Sigma |
| A | 3 | 1 | 16315 | 92.91 | 836 | 822 | 166.8 |
| A | 6 | 16 | 15246 | 86.49 | 836 | 822 | 166.8 |
| A | 13 | 254 | 11770 | 65.65 | 836 | 822 | 166.8 |
| B | 0 | 245 | 99219 | 617.7 | 839 | 820 | 159.3 |
| B | 12 | 17 | 39031 | 239.87 | 839 | 820 | 159.3 |
| B | 12 | 111 | 18306 | 109.77 | 839 | 820 | 159.3 |
| C | 7 | 247 | 155064 | 812.7 | 813 | 818 | 189.8 |
| C | 14 | 238 | 132342 | 692.98 | 813 | 818 | 189.8 |
| C | 2 | 16 | 92401 | 482.54 | 813 | 818 | 189.8 |
| D | 7 | 38 | 587983 | 3031.72 | 804 | 783 | 193.7 |
| D | 8 | 195 | 490120 | 2526.45 | 804 | 783 | 193.7 |
| D | 7 | 238 | 133051 | 682.9 | 804 | 783 | 193.7 |
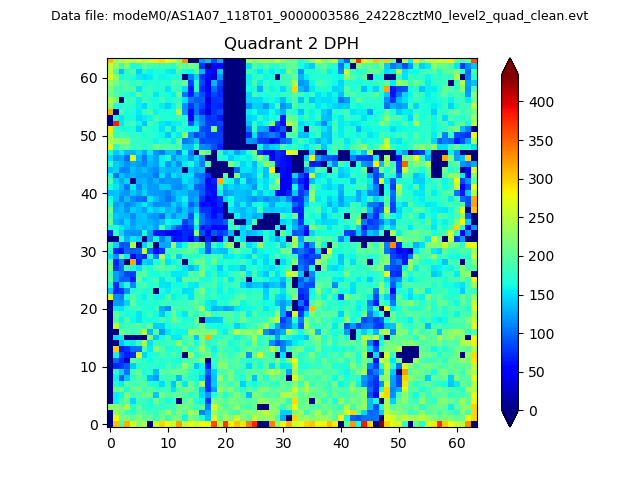
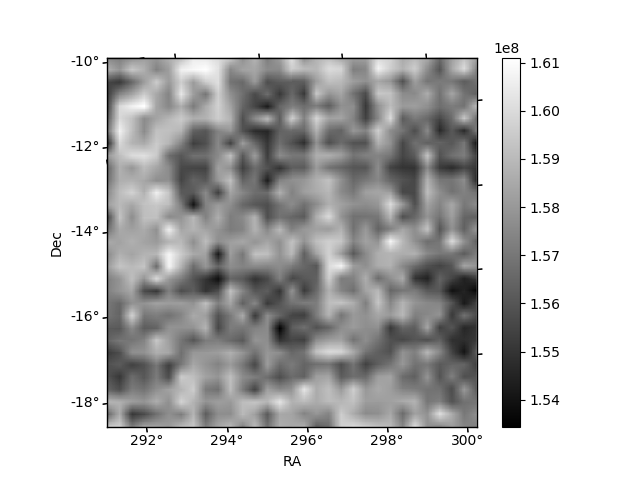
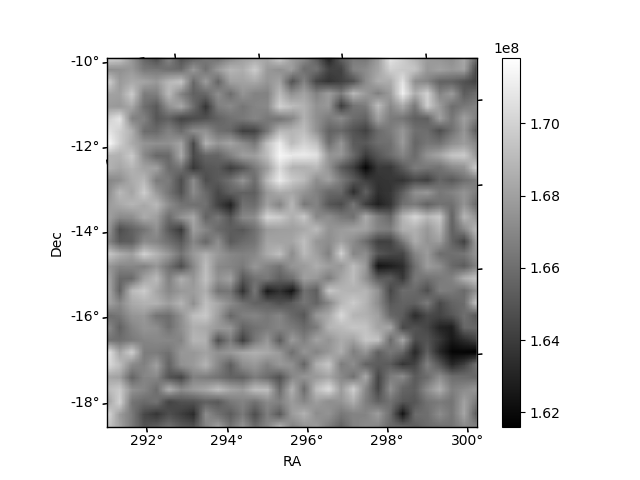
Histogram calculated using DETX and DETY for each event in the final _common_clean file
| Quadrant A | 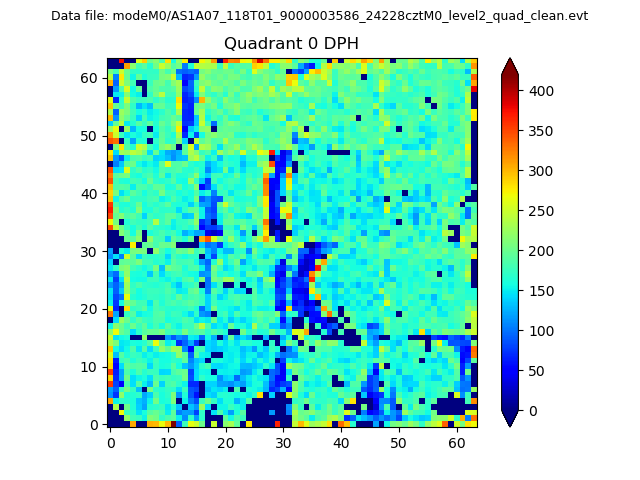 |
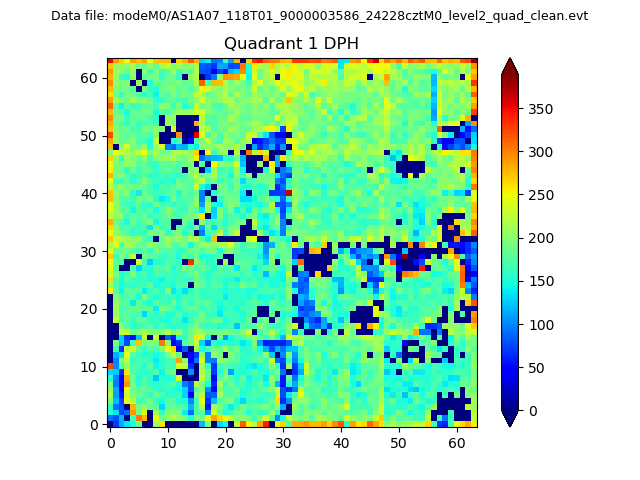 |
Quadrant B |
|---|---|---|---|
| Quadrant D | 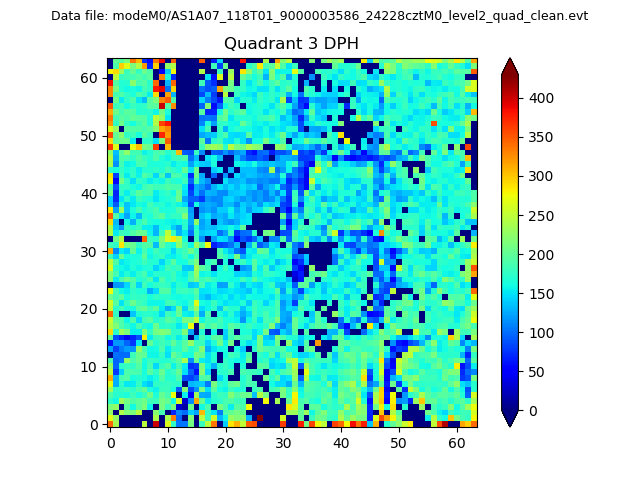 |
 |
Quadrant C |
| Plot type | Count rate plots | Images |
|---|---|---|
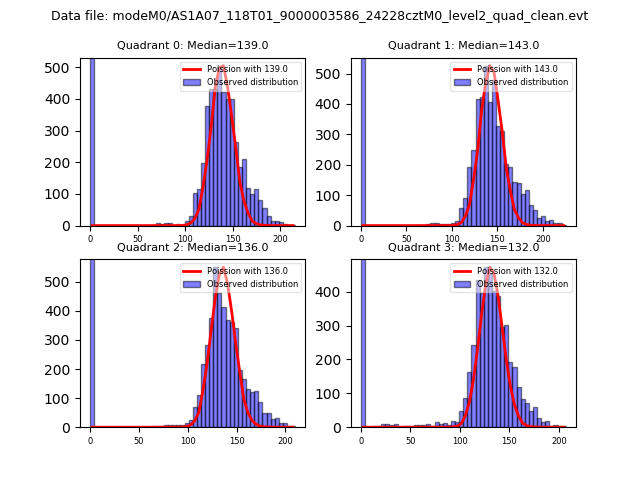
| Comparison with Poisson distribution Blue bars denote a histogram of data divided into 1 sec bins. Red curve is a Poisson curve with rate = median count rate of data. |
 |
 |
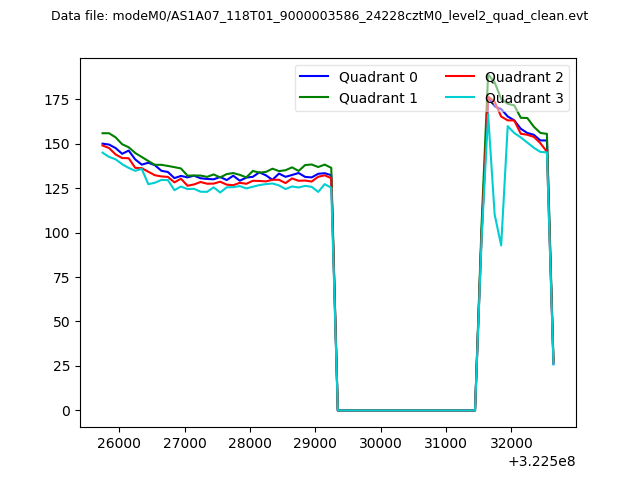
| Quadrant-wise count rates Data is divided into 100 sec bins |
 |
|
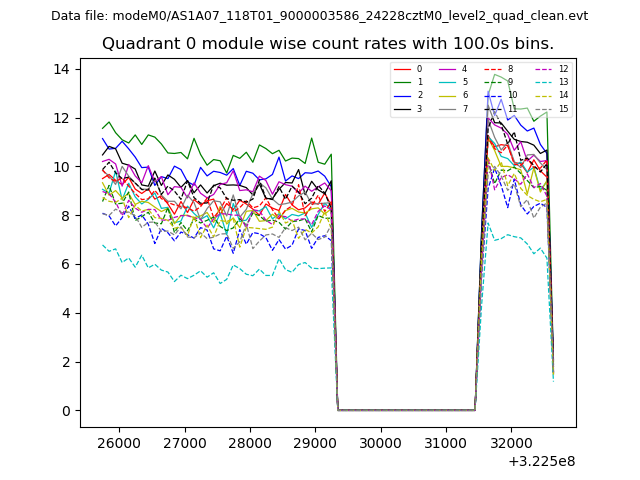
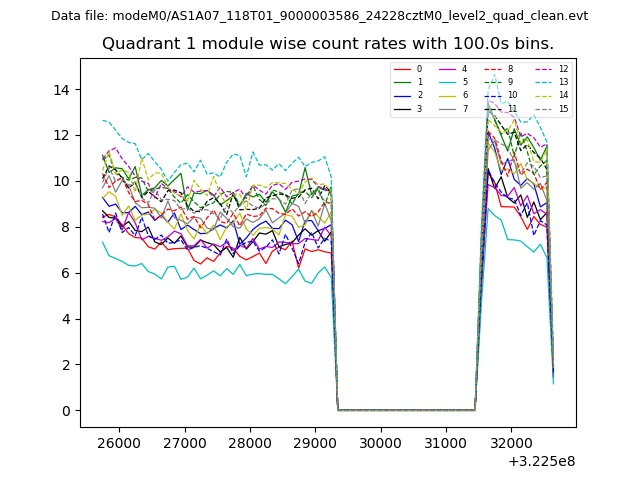
| Module-wise count rates for Quadrant A Data is divided into 100 sec bins |
 |
 |
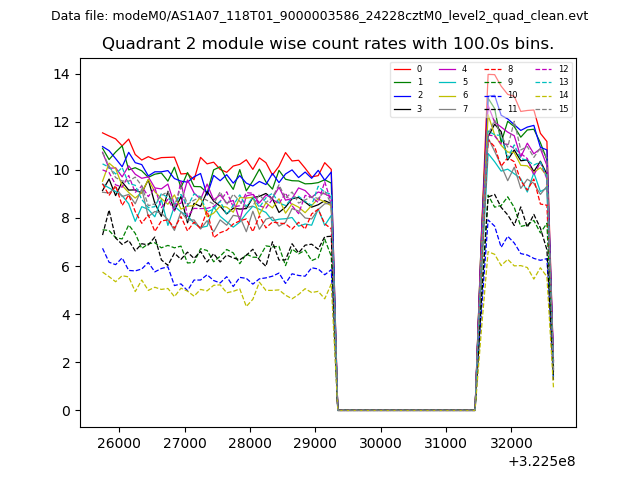
| Module-wise count rates for Quadrant B Data is divided into 100 sec bins |
 |
 |
| Module-wise count rates for Quadrant C Data is divided into 100 sec bins |
 |
 |
| Module-wise count rates for Quadrant D Data is divided into 100 sec bins |
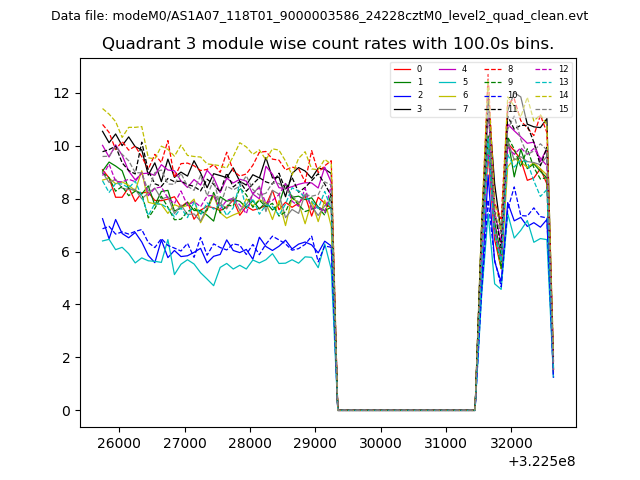 |
 |
| Parameter | Plot |
|---|---|
| CZT HV Monitor |  |
| D_VDD | 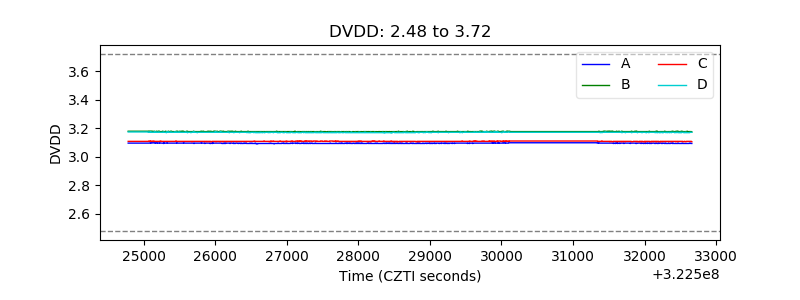 |
| Temperature 1 | 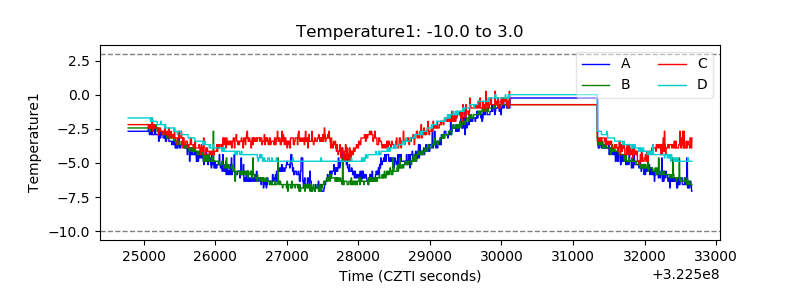 |
| Veto HV Monitor | 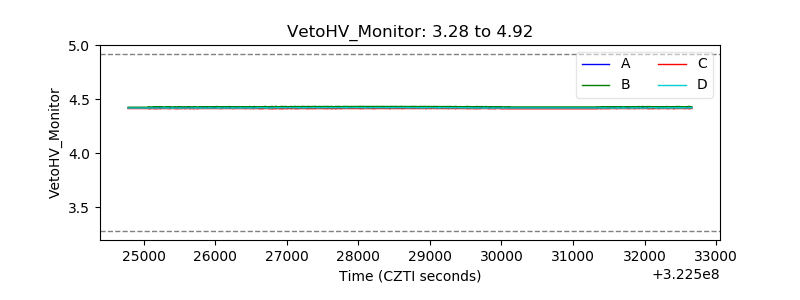 |
| Veto LLD | 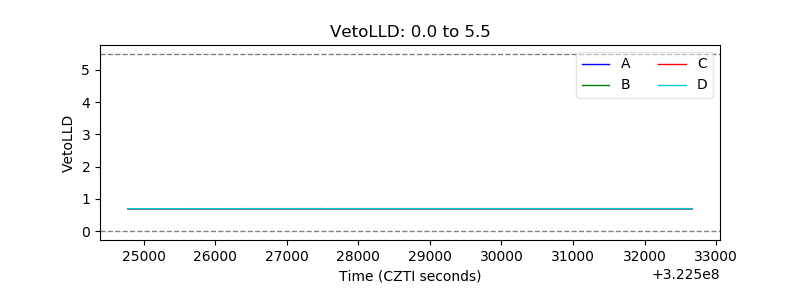 |
| Alpha Counter | 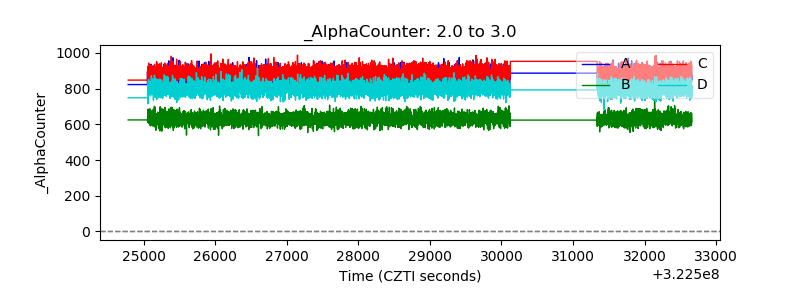 |
| _CPM_Rate | 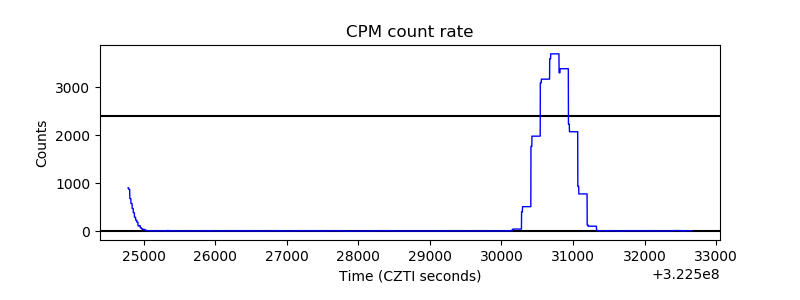 |
| CZT Counter | 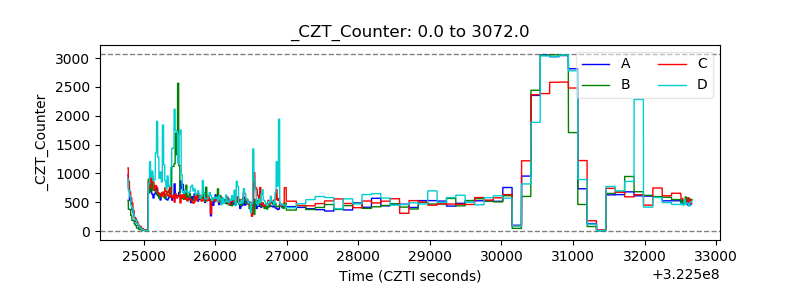 |
| +2.5 Volts monitor |  |
| +5 Volts monitor |  |
| _ROLL_ROT | 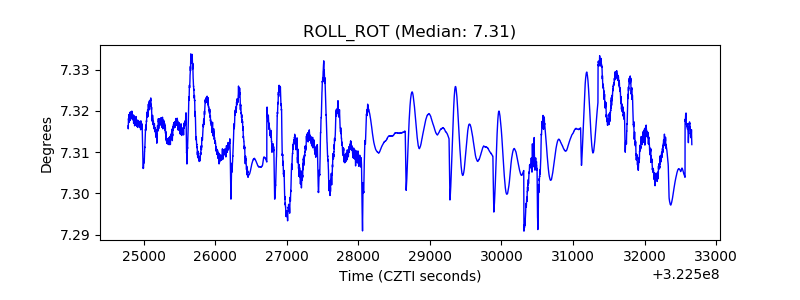 |
| _Roll_DEC | 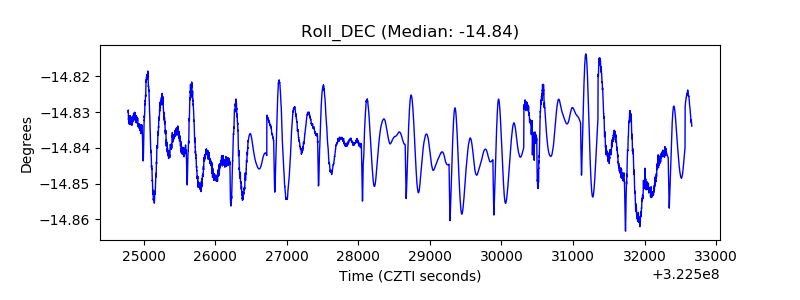 |
| _Roll_RA | 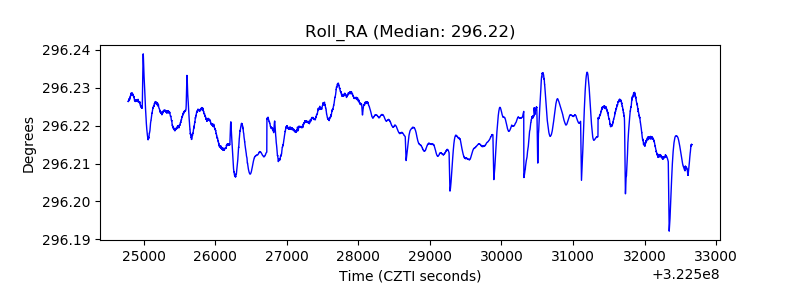 |
| Veto Counter | 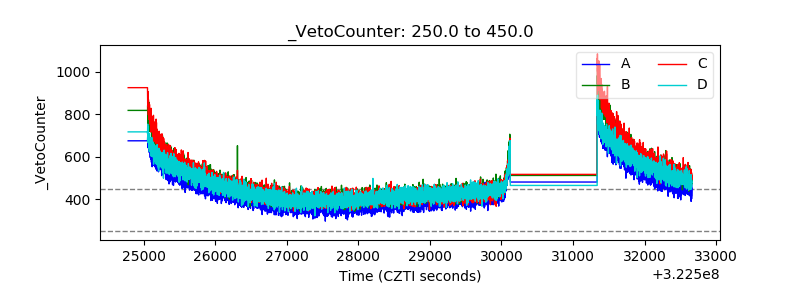 |