| Param | Original file | Final file |
|---|---|---|
| Filename | modeM0/AS1A07_118T01_9000003586_24229cztM0_level2.evt | modeM0/AS1A07_118T01_9000003586_24229cztM0_level2_quad_clean.evt |
| Size (bytes) | 479,975,040 | 113,192,640 |
| Size | 457.7 MB | 107.9 MB |
| Events in quadrant A | 3,304,980 | 752,517 |
| Events in quadrant B | 3,389,073 | 785,167 |
| Events in quadrant C | 3,461,341 | 746,582 |
| Events in quadrant D | 3,956,871 | 708,271 |
| Mode M0 | |||
|---|---|---|---|
| Quadrant | BADHDUFLAG | Total packets | Discarded packets |
| A | 0 | 13820 | 2 |
| B | 0 | 14102 | 2 |
| C | 0 | 14161 | 2 |
| D | 0 | 15919 | 2 |
| Mode SS | |||
|---|---|---|---|
| Quadrant | BADHDUFLAG | Total packets | Discarded packets |
| A | 0 | 126 | 0 |
| B | 0 | 126 | 0 |
| C | 0 | 126 | 0 |
| D | 0 | 126 | 0 |
| Mode M9 | |||
|---|---|---|---|
| Quadrant | BADHDUFLAG | Total packets | Discarded packets |
| A | 0 | 17 | 0 |
| B | 0 | 18 | 0 |
| C | 0 | 18 | 0 |
| D | 0 | 18 | 0 |
| Quadrant | Total seconds | Saturated seconds | Saturation percentage |
|---|---|---|---|
| A | 6246 | 42 | 0.672430% |
| B | 6246 | 63 | 1.008646% |
| C | 6246 | 90 | 1.440922% |
| D | 6246 | 194 | 3.105988% |
Noise dominated data is calculated using 1-second bins in cleaned event files. If a bin has >2000 counts, and if more than 50% of those come from <1% of pixels, then it is considered to be noise-dominated and hence unusable.
| Quadrant | # 1 sec bins | Bins with >0 counts | Bins with >2000 counts | High rate bins dominated by noise | Noise dominated (total time) | Noise dominated (detector-on time) | Marked lightcurve |
|---|---|---|---|---|---|---|---|
| A | 7541 | 6247 | 7 | 7 | 0.09% | 0.11% | 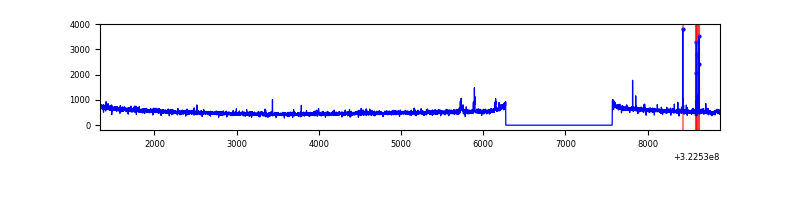 |
| B | 7541 | 6246 | 12 | 12 | 0.16% | 0.19% | 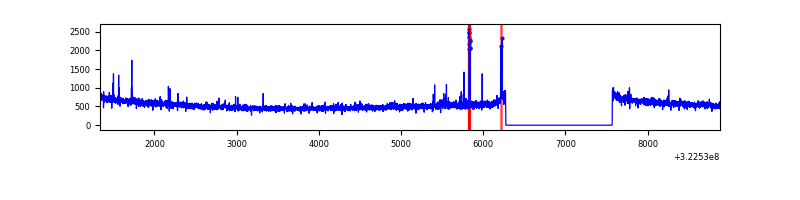 |
| C | 7541 | 6247 | 2 | 2 | 0.03% | 0.03% |  |
| D | 7541 | 6246 | 151 | 151 | 2.00% | 2.42% | 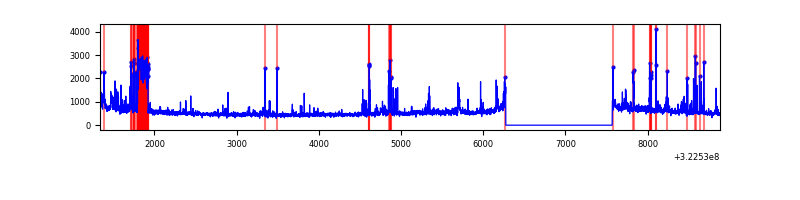 |
Top three noisy pixels from each quadrant. If the there are fewer than three noisy pixels in the level2.evt file, extra rows are filled as -1
| Pixel properties | Quadrant properties | ||||||
|---|---|---|---|---|---|---|---|
| Quadrant | DetID | PixID | Counts | Sigma | Mean | Median | Sigma |
| A | 3 | 1 | 36852 | 216.78 | 839 | 824 | 166.2 |
| A | 6 | 16 | 34573 | 203.07 | 839 | 824 | 166.2 |
| A | 13 | 254 | 11282 | 62.93 | 839 | 824 | 166.2 |
| B | 12 | 17 | 36116 | 222.01 | 848 | 830 | 158.9 |
| B | 12 | 111 | 18104 | 108.69 | 848 | 830 | 158.9 |
| B | 11 | 111 | 15975 | 95.29 | 848 | 830 | 158.9 |
| C | 14 | 238 | 132851 | 688.51 | 822 | 833 | 191.7 |
| C | 2 | 16 | 62185 | 319.97 | 822 | 833 | 191.7 |
| C | 7 | 247 | 60999 | 313.78 | 822 | 833 | 191.7 |
| D | 7 | 38 | 337386 | 1707.11 | 815 | 795 | 197.2 |
| D | 7 | 238 | 225371 | 1139.0 | 815 | 795 | 197.2 |
| D | 12 | 233 | 163196 | 823.66 | 815 | 795 | 197.2 |
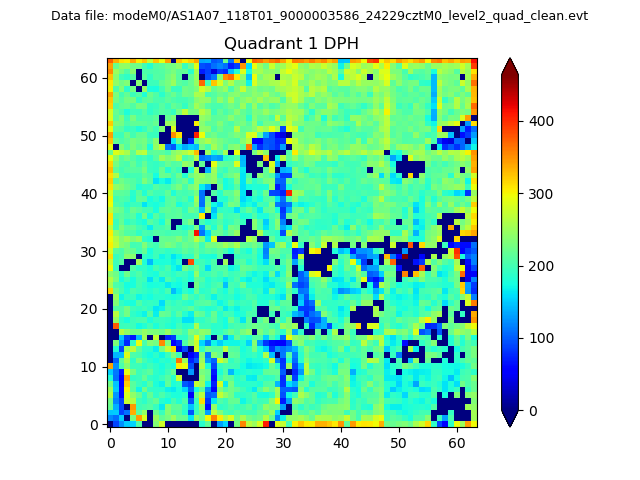
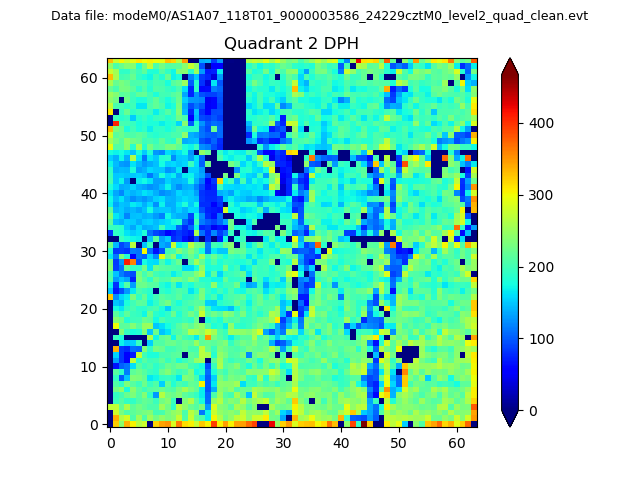
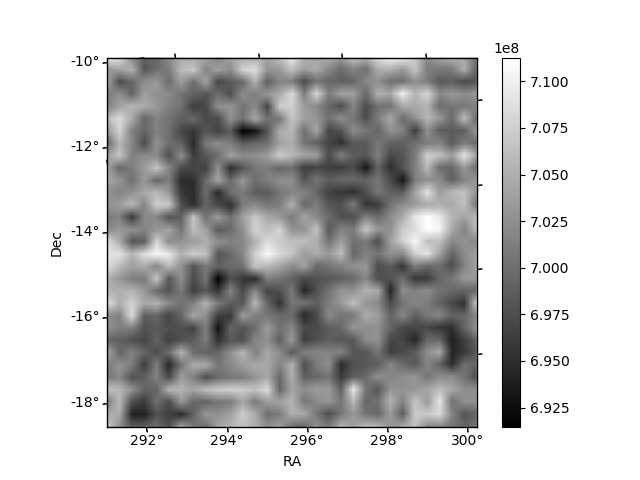
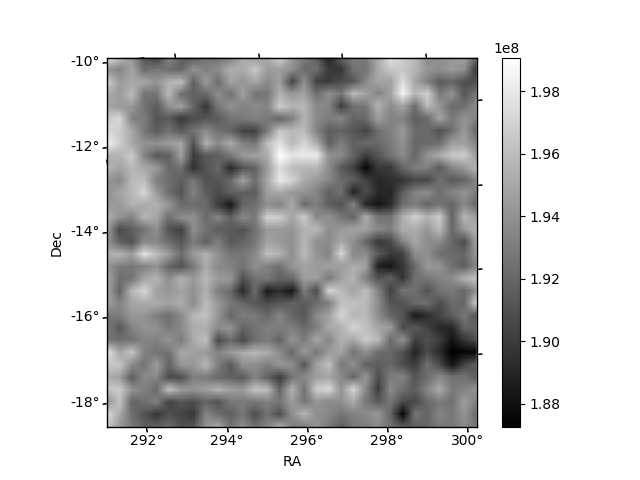
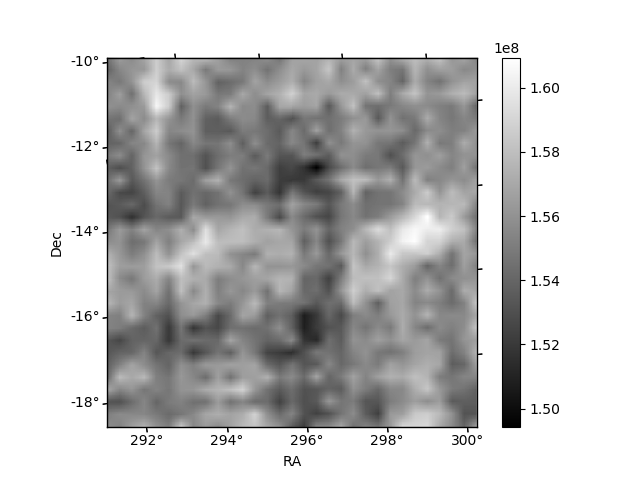
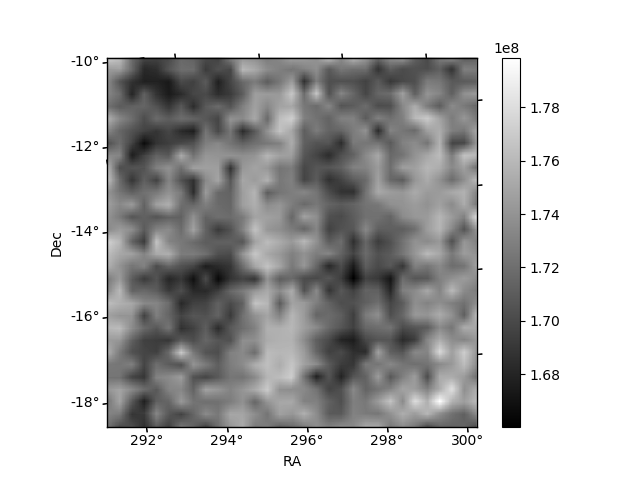
Histogram calculated using DETX and DETY for each event in the final _common_clean file
| Quadrant A | 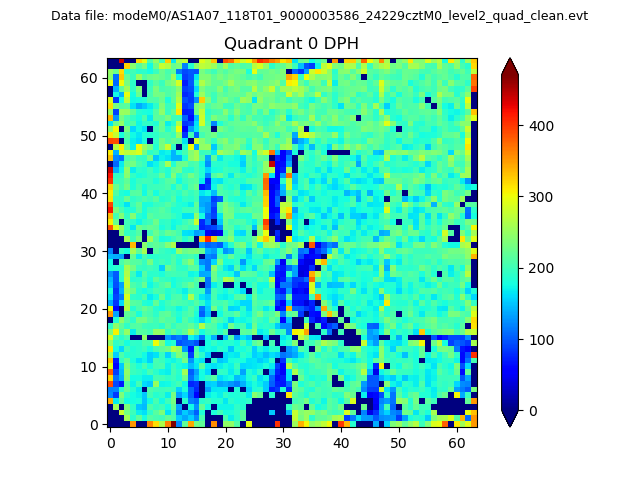 |
 |
Quadrant B |
|---|---|---|---|
| Quadrant D | 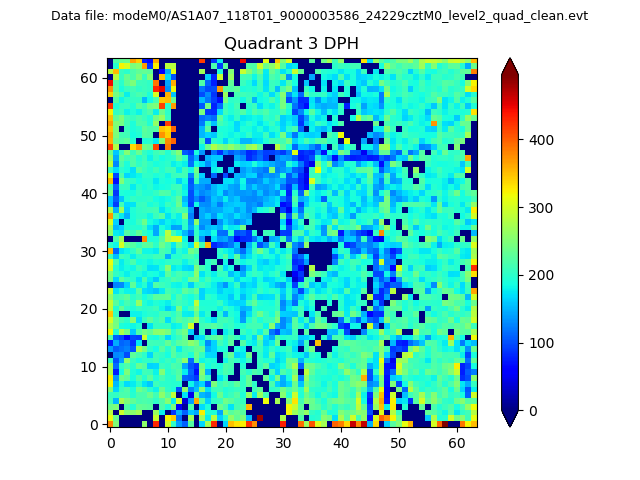 |
 |
Quadrant C |
| Plot type | Count rate plots | Images |
|---|---|---|
| Comparison with Poisson distribution Blue bars denote a histogram of data divided into 1 sec bins. Red curve is a Poisson curve with rate = median count rate of data. |
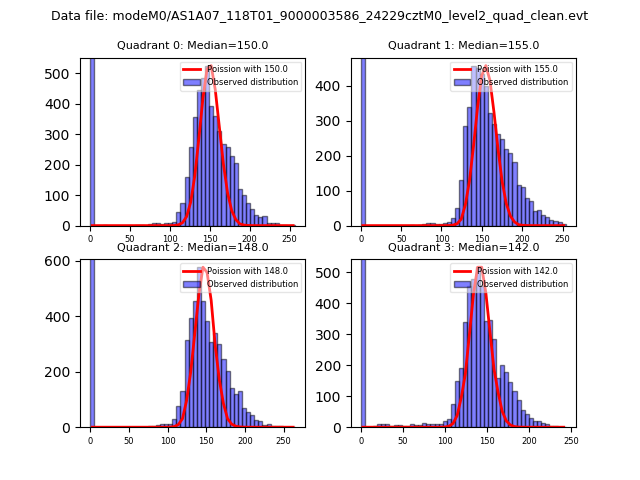 |
 |
| Quadrant-wise count rates Data is divided into 100 sec bins |
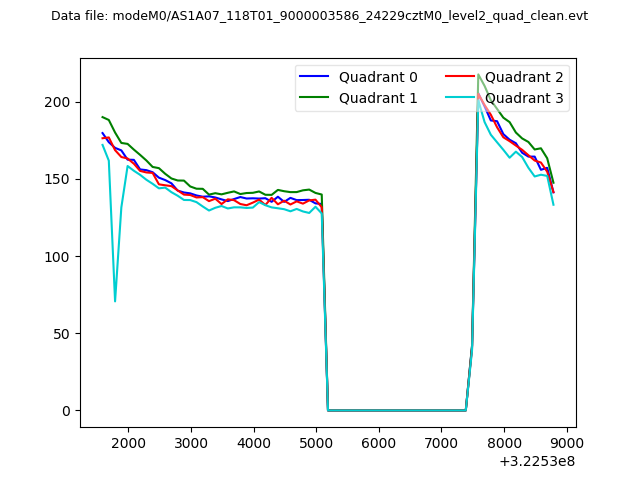 |
|
| Module-wise count rates for Quadrant A Data is divided into 100 sec bins |
 |
 |
| Module-wise count rates for Quadrant B Data is divided into 100 sec bins |
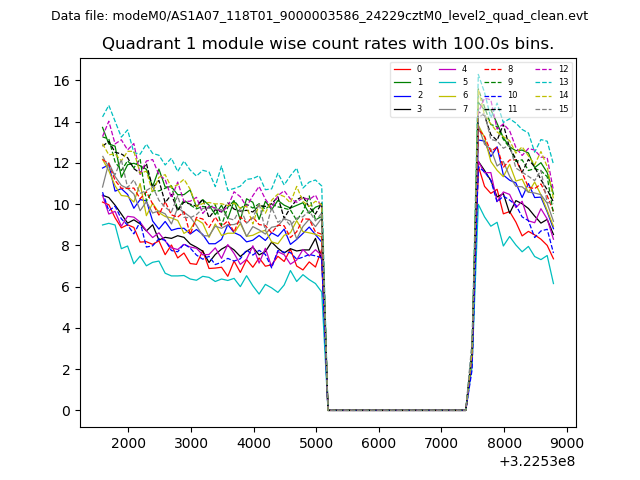 |
 |
| Module-wise count rates for Quadrant C Data is divided into 100 sec bins |
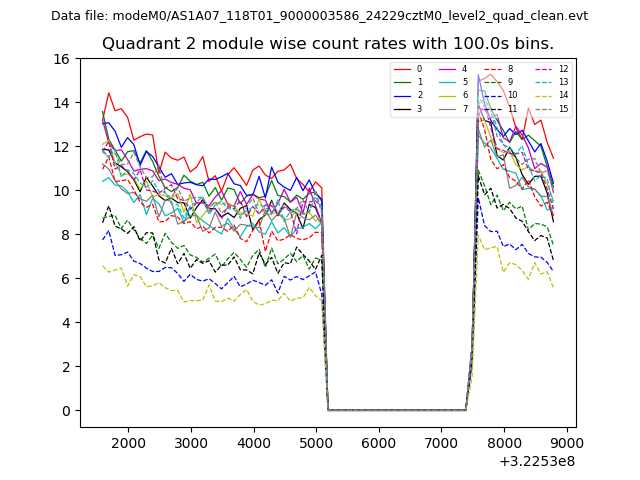 |
 |
| Module-wise count rates for Quadrant D Data is divided into 100 sec bins |
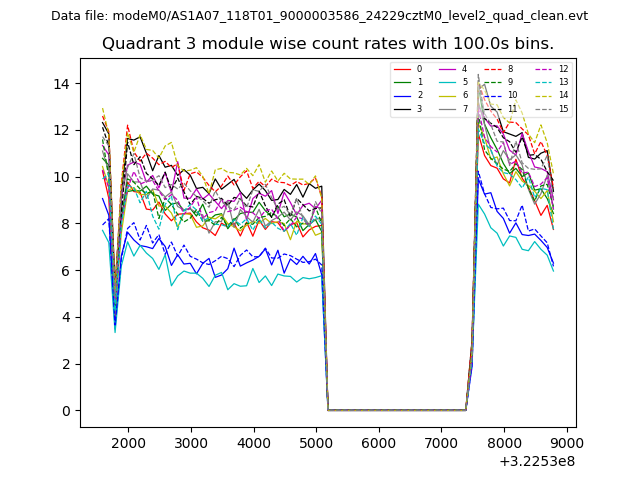 |
 |
| Parameter | Plot |
|---|---|
| CZT HV Monitor | 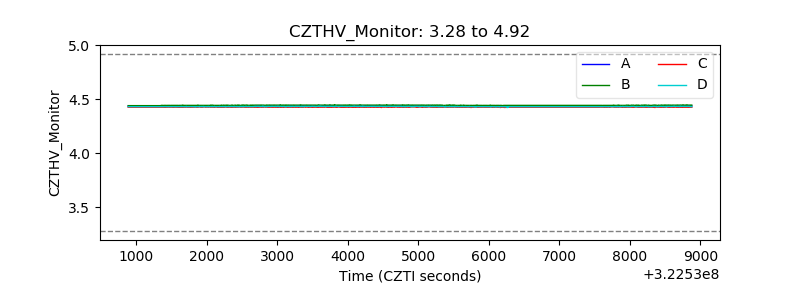 |
| D_VDD | 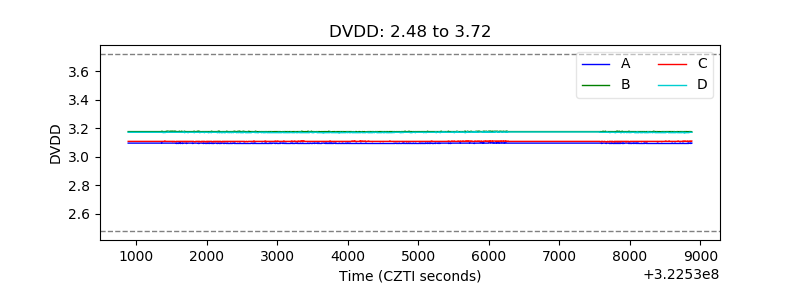 |
| Temperature 1 | 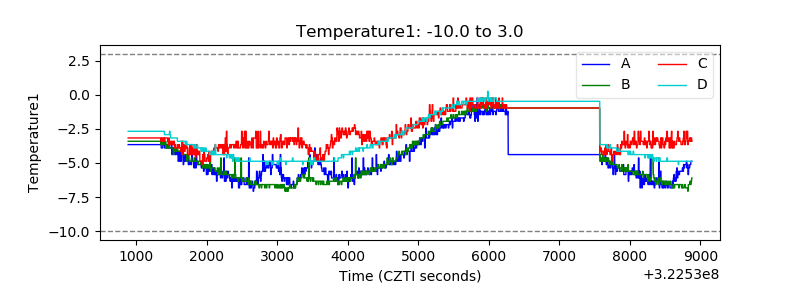 |
| Veto HV Monitor | 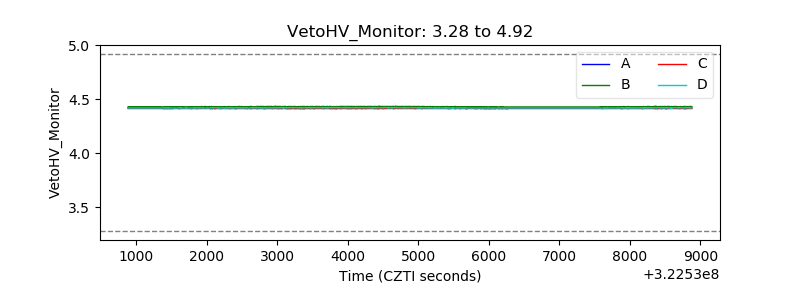 |
| Veto LLD | 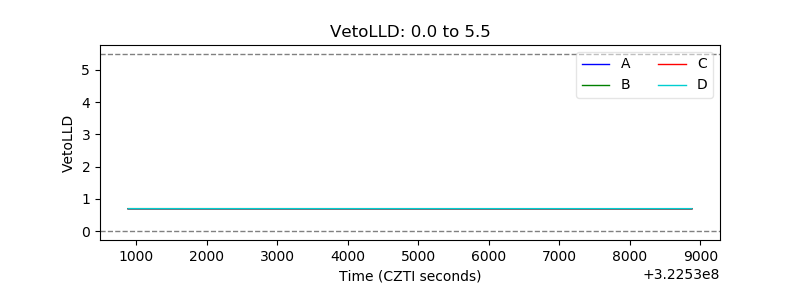 |
| Alpha Counter | 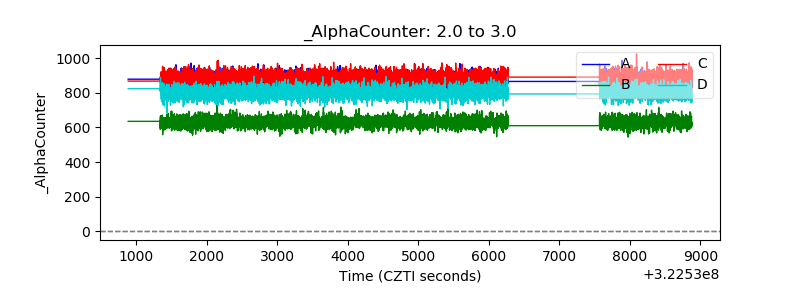 |
| _CPM_Rate | 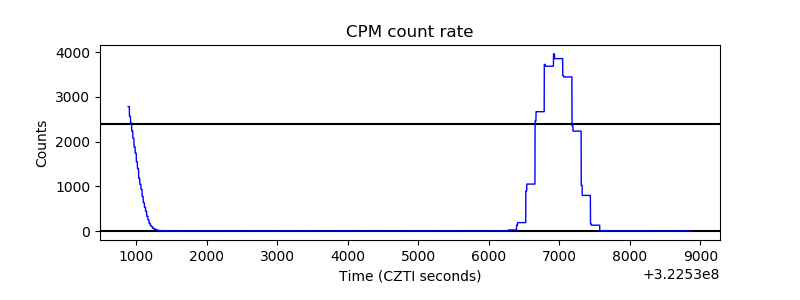 |
| CZT Counter | 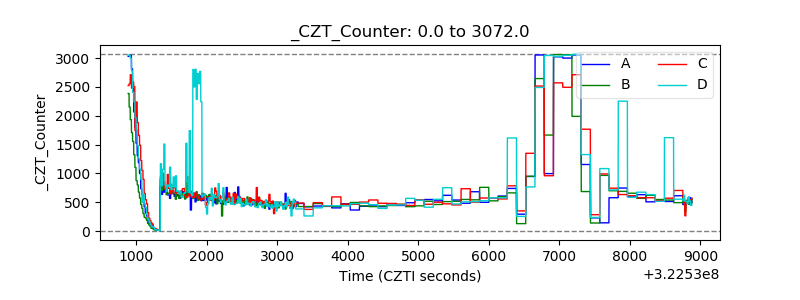 |
| +2.5 Volts monitor |  |
| +5 Volts monitor |  |
| _ROLL_ROT | 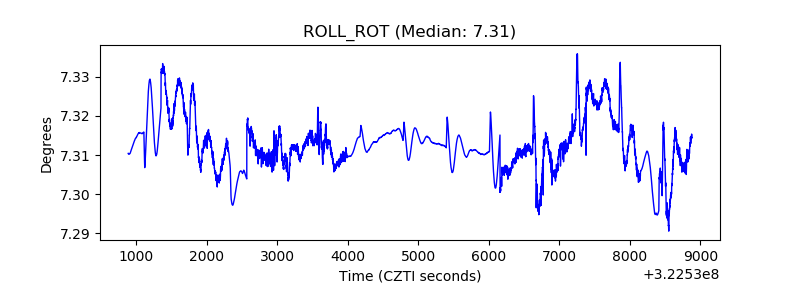 |
| _Roll_DEC | 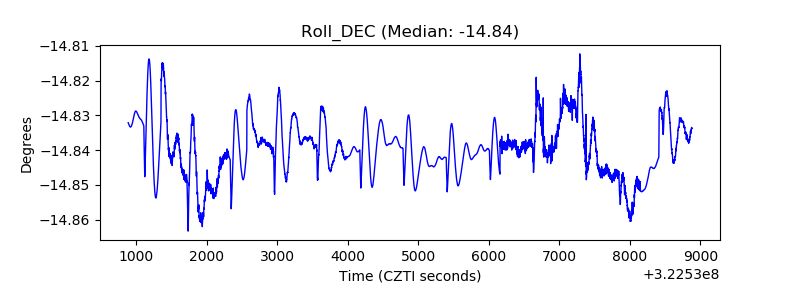 |
| _Roll_RA | 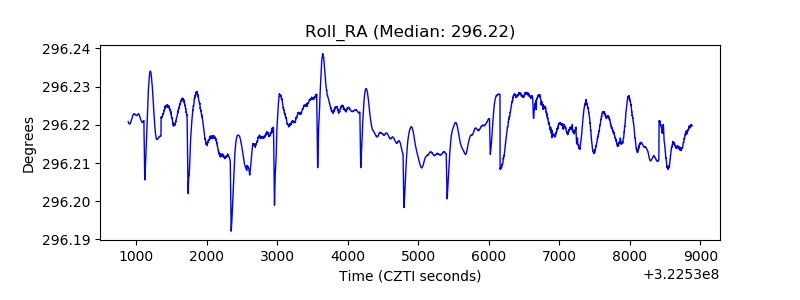 |
| Veto Counter | 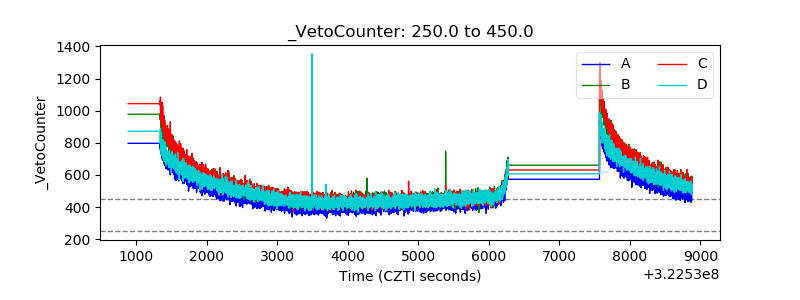 |