| Param | Original file | Final file |
|---|---|---|
| Filename | modeM0/AS1A07_118T01_9000003586_24231cztM0_level2.evt | modeM0/AS1A07_118T01_9000003586_24231cztM0_level2_quad_clean.evt |
| Size (bytes) | 603,864,000 | 111,205,440 |
| Size | 575.9 MB | 106.1 MB |
| Events in quadrant A | 4,208,807 | 743,226 |
| Events in quadrant B | 3,834,765 | 774,561 |
| Events in quadrant C | 4,538,563 | 731,450 |
| Events in quadrant D | 5,259,052 | 658,048 |
| Mode M0 | |||
|---|---|---|---|
| Quadrant | BADHDUFLAG | Total packets | Discarded packets |
| A | 0 | 16478 | 2 |
| B | 0 | 15359 | 2 |
| C | 0 | 17874 | 2 |
| D | 0 | 19744 | 2 |
| Mode SS | |||
|---|---|---|---|
| Quadrant | BADHDUFLAG | Total packets | Discarded packets |
| A | 0 | 132 | 0 |
| B | 0 | 132 | 0 |
| C | 0 | 132 | 0 |
| D | 0 | 132 | 0 |
| Mode M9 | |||
|---|---|---|---|
| Quadrant | BADHDUFLAG | Total packets | Discarded packets |
| A | 0 | 14 | 0 |
| B | 0 | 15 | 0 |
| C | 0 | 15 | 0 |
| D | 0 | 15 | 0 |
| Quadrant | Total seconds | Saturated seconds | Saturation percentage |
|---|---|---|---|
| A | 6606 | 243 | 3.678474% |
| B | 6606 | 177 | 2.679382% |
| C | 6606 | 302 | 4.571602% |
| D | 6606 | 665 | 10.066606% |
Noise dominated data is calculated using 1-second bins in cleaned event files. If a bin has >2000 counts, and if more than 50% of those come from <1% of pixels, then it is considered to be noise-dominated and hence unusable.
| Quadrant | # 1 sec bins | Bins with >0 counts | Bins with >2000 counts | High rate bins dominated by noise | Noise dominated (total time) | Noise dominated (detector-on time) | Marked lightcurve |
|---|---|---|---|---|---|---|---|
| A | 7981 | 6607 | 213 | 213 | 2.67% | 3.22% | 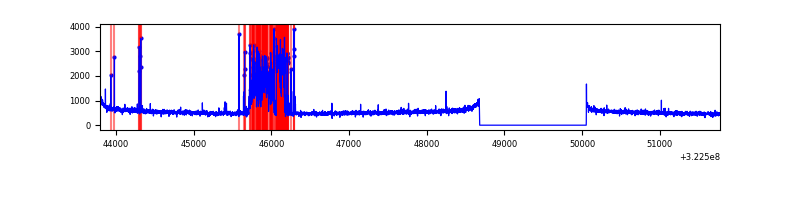 |
| B | 7981 | 6607 | 112 | 112 | 1.40% | 1.70% | 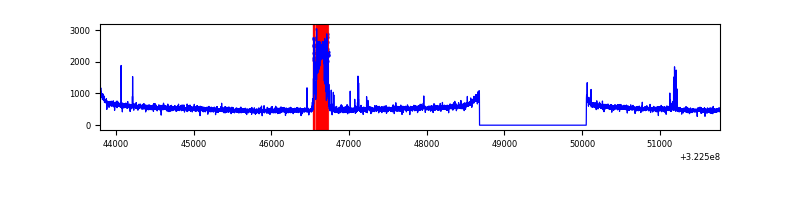 |
| C | 7981 | 6607 | 153 | 153 | 1.92% | 2.32% | 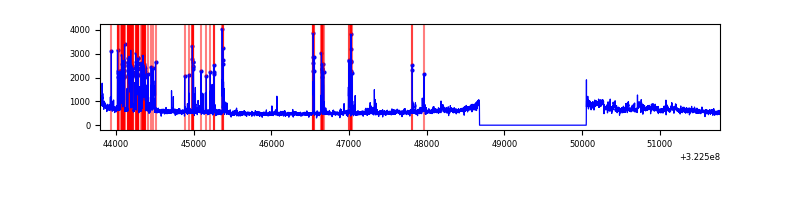 |
| D | 7981 | 6607 | 619 | 619 | 7.76% | 9.37% | 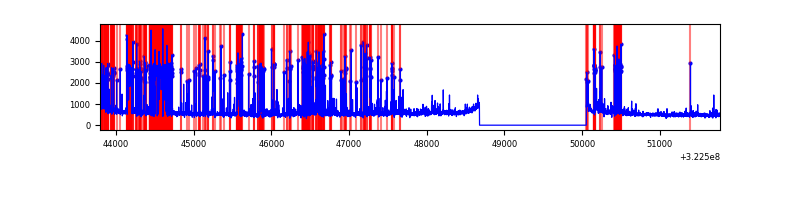 |
Top three noisy pixels from each quadrant. If the there are fewer than three noisy pixels in the level2.evt file, extra rows are filled as -1
| Pixel properties | Quadrant properties | ||||||
|---|---|---|---|---|---|---|---|
| Quadrant | DetID | PixID | Counts | Sigma | Mean | Median | Sigma |
| A | 6 | 16 | 793358 | 4531.0 | 882 | 868 | 174.9 |
| A | 3 | 1 | 18402 | 100.25 | 882 | 868 | 174.9 |
| A | 13 | 254 | 10923 | 57.49 | 882 | 868 | 174.9 |
| B | 12 | 17 | 335665 | 2017.16 | 889 | 872 | 166.0 |
| B | 0 | 245 | 20162 | 116.22 | 889 | 872 | 166.0 |
| B | 12 | 111 | 18742 | 107.67 | 889 | 872 | 166.0 |
| C | 2 | 16 | 709313 | 3528.13 | 859 | 868 | 200.8 |
| C | 7 | 247 | 336629 | 1672.12 | 859 | 868 | 200.8 |
| C | 14 | 238 | 136499 | 675.46 | 859 | 868 | 200.8 |
| D | 1 | 52 | 1841180 | 9241.96 | 823 | 801 | 199.1 |
| D | 12 | 233 | 118059 | 588.84 | 823 | 801 | 199.1 |
| D | 8 | 195 | 85452 | 425.1 | 823 | 801 | 199.1 |
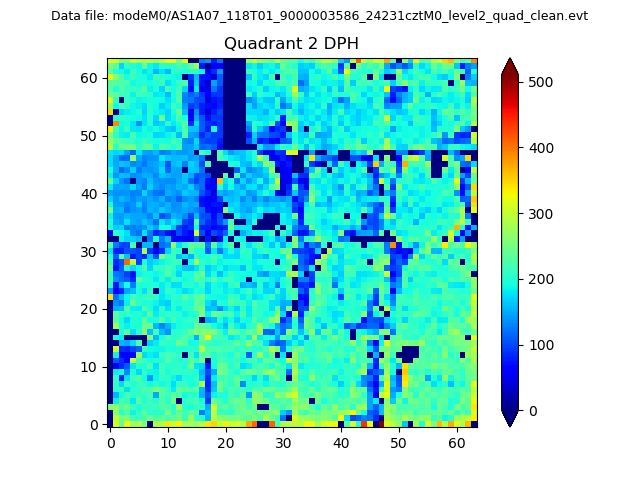
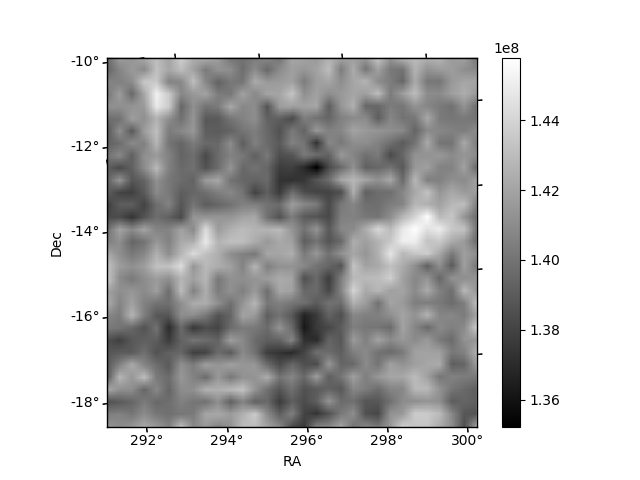
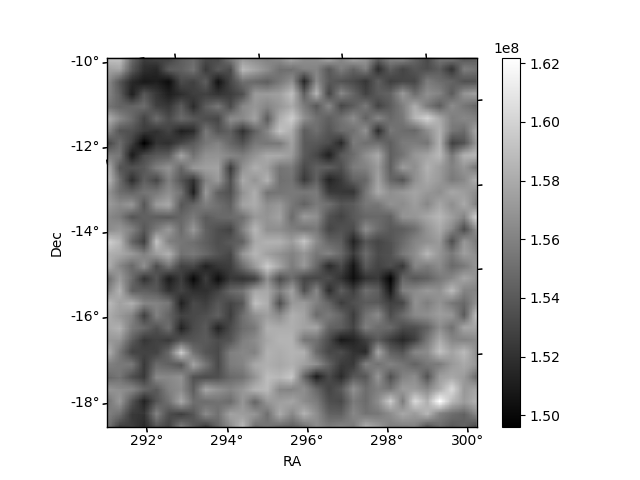
Histogram calculated using DETX and DETY for each event in the final _common_clean file
| Quadrant A | 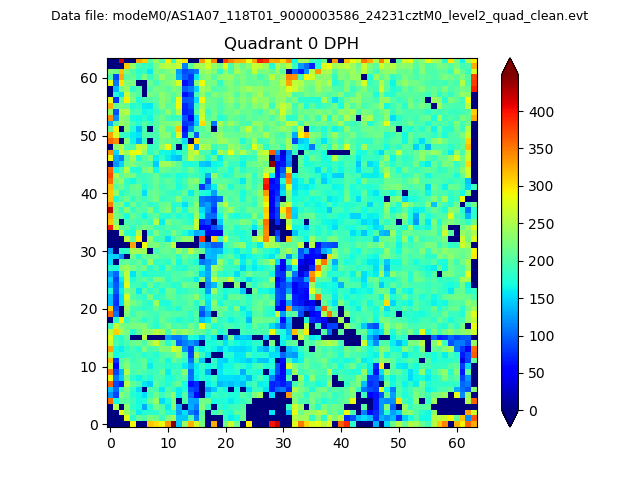 |
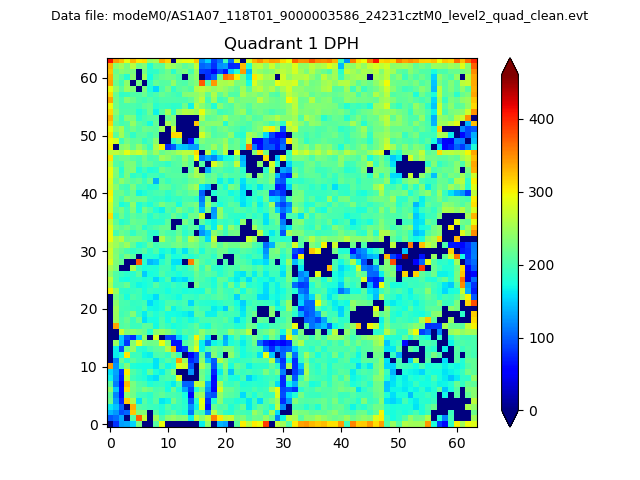 |
Quadrant B |
|---|---|---|---|
| Quadrant D | 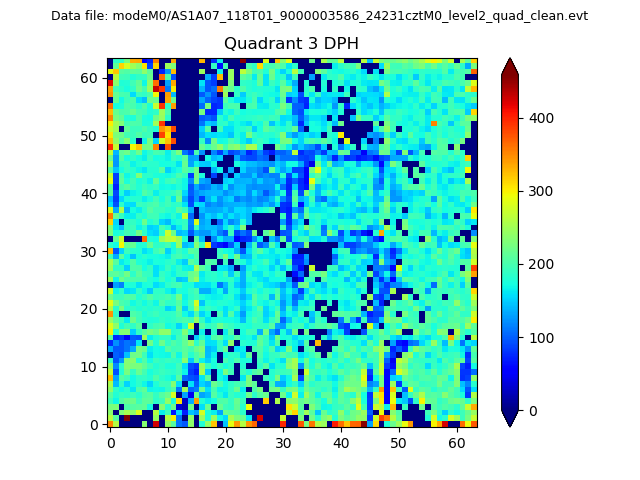 |
 |
Quadrant C |
| Plot type | Count rate plots | Images |
|---|---|---|
| Comparison with Poisson distribution Blue bars denote a histogram of data divided into 1 sec bins. Red curve is a Poisson curve with rate = median count rate of data. |
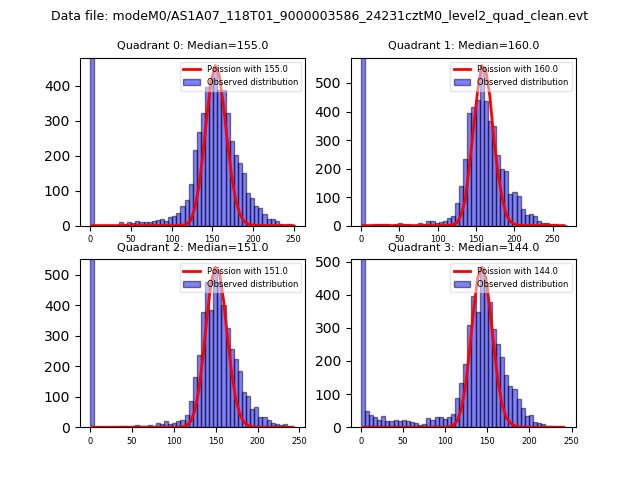 |
 |
| Quadrant-wise count rates Data is divided into 100 sec bins |
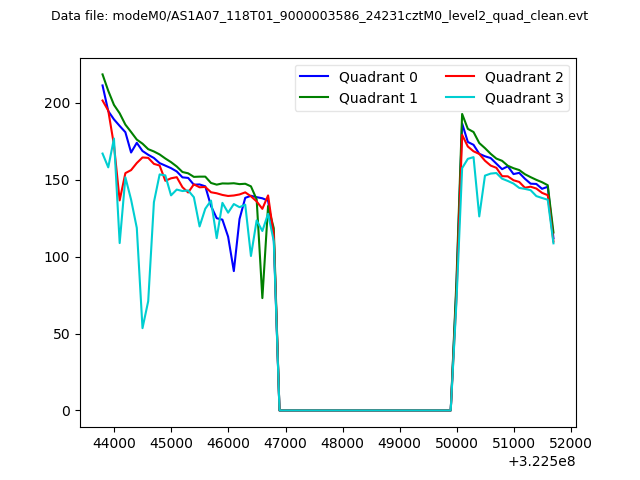 |
|
| Module-wise count rates for Quadrant A Data is divided into 100 sec bins |
 |
 |
| Module-wise count rates for Quadrant B Data is divided into 100 sec bins |
 |
 |
| Module-wise count rates for Quadrant C Data is divided into 100 sec bins |
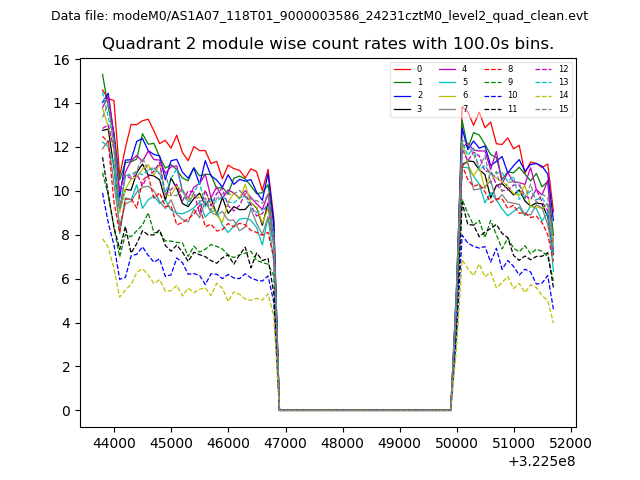 |
 |
| Module-wise count rates for Quadrant D Data is divided into 100 sec bins |
 |
 |
| Parameter | Plot |
|---|---|
| CZT HV Monitor | 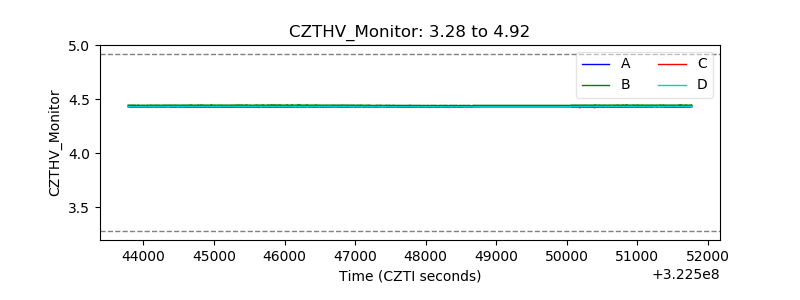 |
| D_VDD | 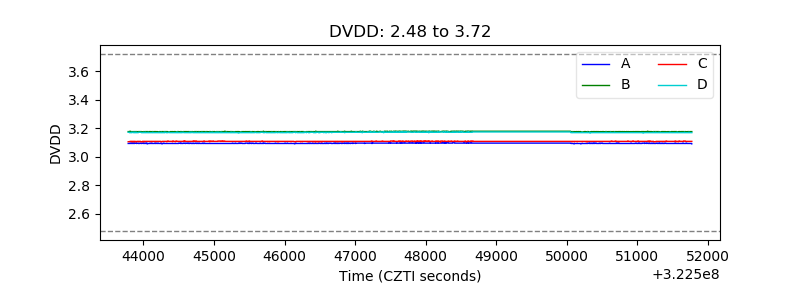 |
| Temperature 1 | 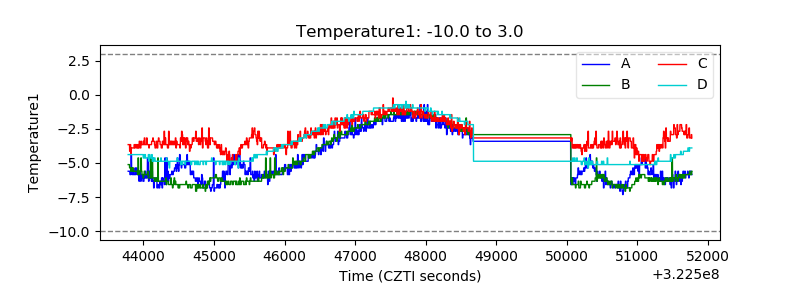 |
| Veto HV Monitor |  |
| Veto LLD | 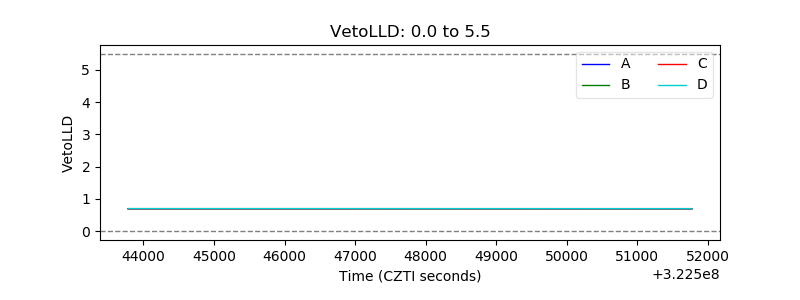 |
| Alpha Counter | 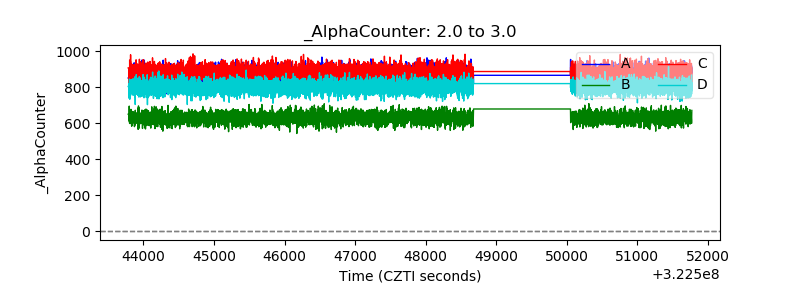 |
| _CPM_Rate | 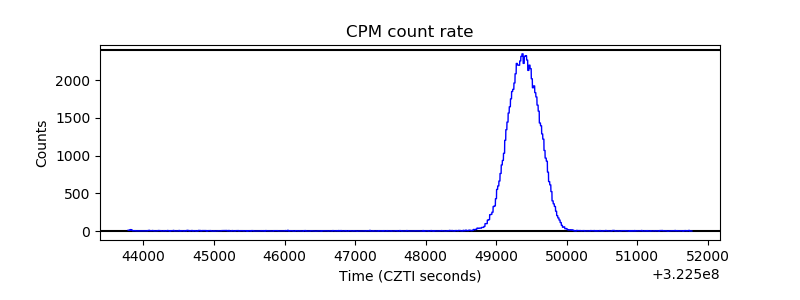 |
| CZT Counter |  |
| +2.5 Volts monitor |  |
| +5 Volts monitor |  |
| _ROLL_ROT | 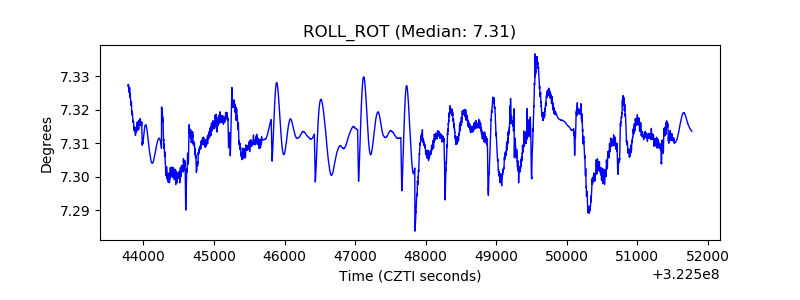 |
| _Roll_DEC |  |
| _Roll_RA |  |
| Veto Counter |  |