| Param | Original file | Final file |
|---|---|---|
| Filename | modeM0/AS1A07_118T01_9000003586_24232cztM0_level2.evt | modeM0/AS1A07_118T01_9000003586_24232cztM0_level2_quad_clean.evt |
| Size (bytes) | 472,798,080 | 94,648,320 |
| Size | 450.9 MB | 90.3 MB |
| Events in quadrant A | 3,222,055 | 610,632 |
| Events in quadrant B | 3,328,796 | 628,191 |
| Events in quadrant C | 3,827,028 | 597,207 |
| Events in quadrant D | 3,504,693 | 582,196 |
| Mode M0 | |||
|---|---|---|---|
| Quadrant | BADHDUFLAG | Total packets | Discarded packets |
| A | 0 | 13404 | 1 |
| B | 0 | 13713 | 1 |
| C | 0 | 15587 | 1 |
| D | 0 | 14384 | 1 |
| Mode SS | |||
|---|---|---|---|
| Quadrant | BADHDUFLAG | Total packets | Discarded packets |
| A | 0 | 132 | 0 |
| B | 0 | 132 | 0 |
| C | 0 | 132 | 0 |
| D | 0 | 132 | 0 |
| Mode M9 | |||
|---|---|---|---|
| Quadrant | BADHDUFLAG | Total packets | Discarded packets |
| A | 0 | 12 | 0 |
| B | 0 | 12 | 0 |
| C | 0 | 12 | 0 |
| D | 0 | 12 | 0 |
| Quadrant | Total seconds | Saturated seconds | Saturation percentage |
|---|---|---|---|
| A | 6420 | 40 | 0.623053% |
| B | 6420 | 71 | 1.105919% |
| C | 6420 | 112 | 1.744548% |
| D | 6420 | 54 | 0.841121% |
Noise dominated data is calculated using 1-second bins in cleaned event files. If a bin has >2000 counts, and if more than 50% of those come from <1% of pixels, then it is considered to be noise-dominated and hence unusable.
| Quadrant | # 1 sec bins | Bins with >0 counts | Bins with >2000 counts | High rate bins dominated by noise | Noise dominated (total time) | Noise dominated (detector-on time) | Marked lightcurve |
|---|---|---|---|---|---|---|---|
| A | 7675 | 6421 | 0 | 0 | 0.00% | 0.00% | 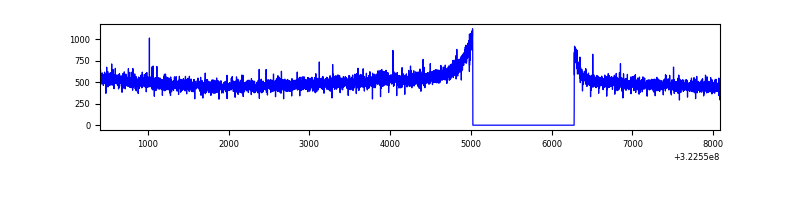 |
| B | 7675 | 6421 | 2 | 2 | 0.03% | 0.03% | 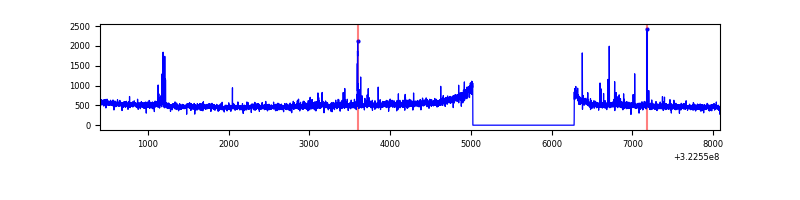 |
| C | 7675 | 6421 | 4 | 4 | 0.05% | 0.06% | 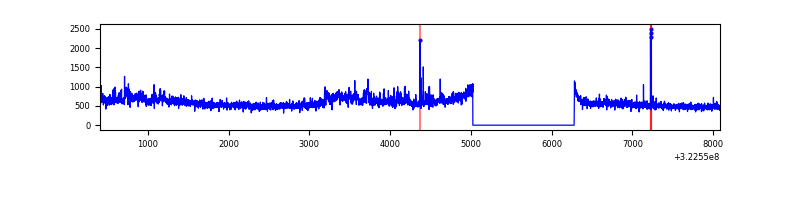 |
| D | 7675 | 6421 | 40 | 40 | 0.52% | 0.62% | 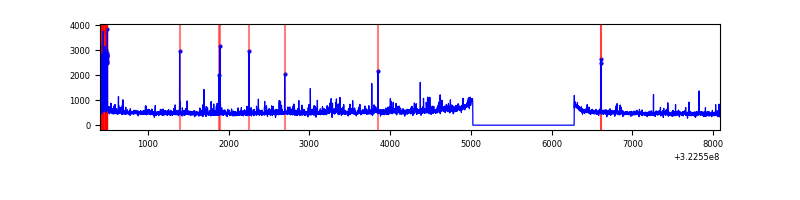 |
Top three noisy pixels from each quadrant. If the there are fewer than three noisy pixels in the level2.evt file, extra rows are filled as -1
| Pixel properties | Quadrant properties | ||||||
|---|---|---|---|---|---|---|---|
| Quadrant | DetID | PixID | Counts | Sigma | Mean | Median | Sigma |
| A | 3 | 1 | 12255 | 68.47 | 833 | 815 | 167.1 |
| A | 13 | 254 | 10134 | 55.78 | 833 | 815 | 167.1 |
| A | 0 | 226 | 7197 | 38.2 | 833 | 815 | 167.1 |
| B | 0 | 245 | 34491 | 214.45 | 832 | 812 | 157.0 |
| B | 12 | 17 | 27036 | 166.98 | 832 | 812 | 157.0 |
| B | 12 | 111 | 18182 | 110.6 | 832 | 812 | 157.0 |
| C | 7 | 247 | 502084 | 2654.82 | 806 | 813 | 188.8 |
| C | 14 | 238 | 129011 | 678.96 | 806 | 813 | 188.8 |
| C | 2 | 16 | 48968 | 255.04 | 806 | 813 | 188.8 |
| D | 8 | 195 | 169669 | 858.49 | 815 | 796 | 196.7 |
| D | 1 | 52 | 148545 | 751.1 | 815 | 796 | 196.7 |
| D | 12 | 233 | 87846 | 442.53 | 815 | 796 | 196.7 |
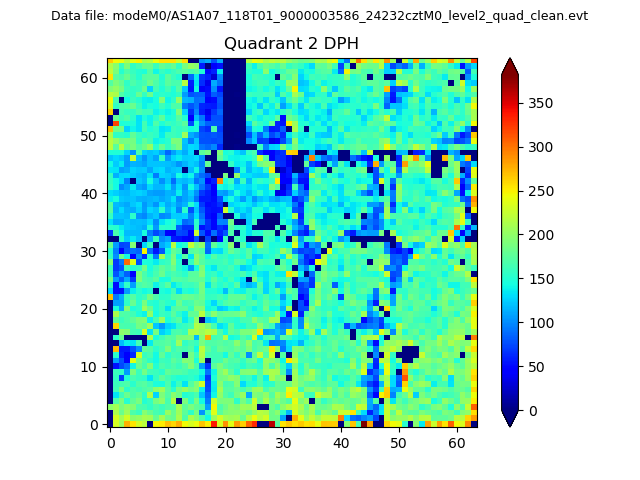
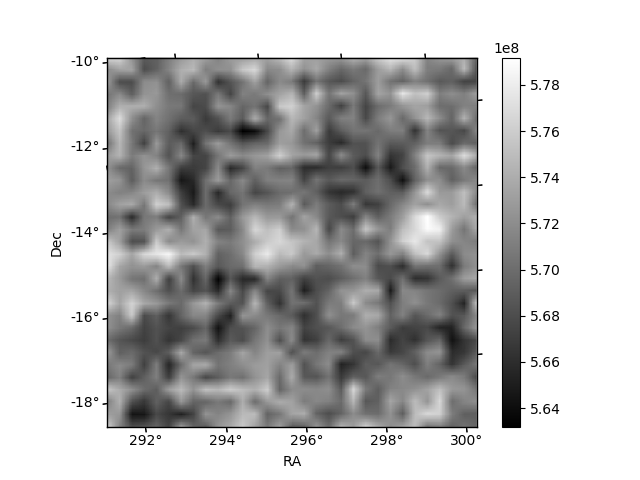
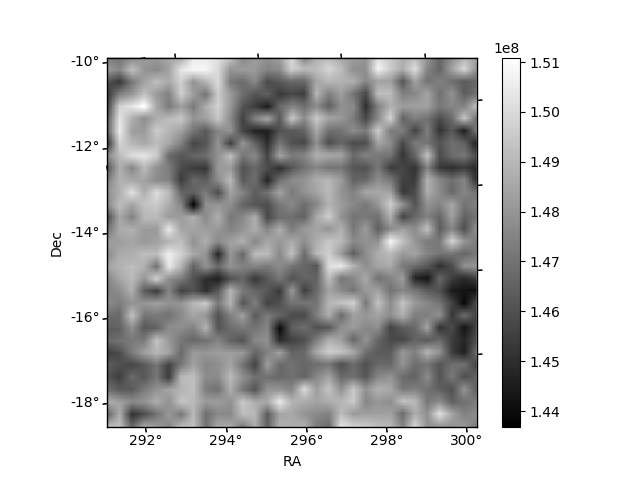
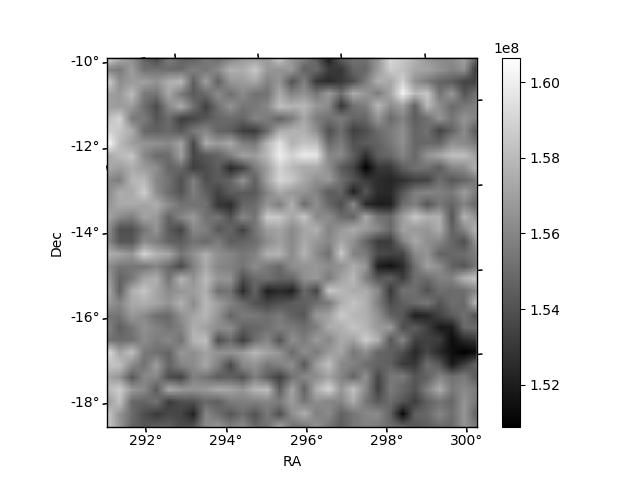
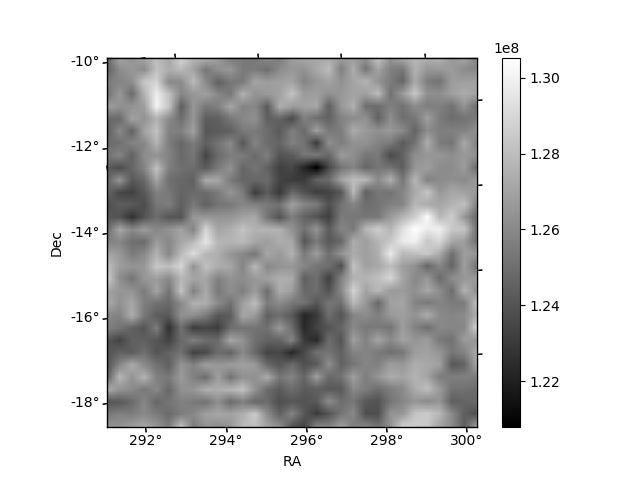
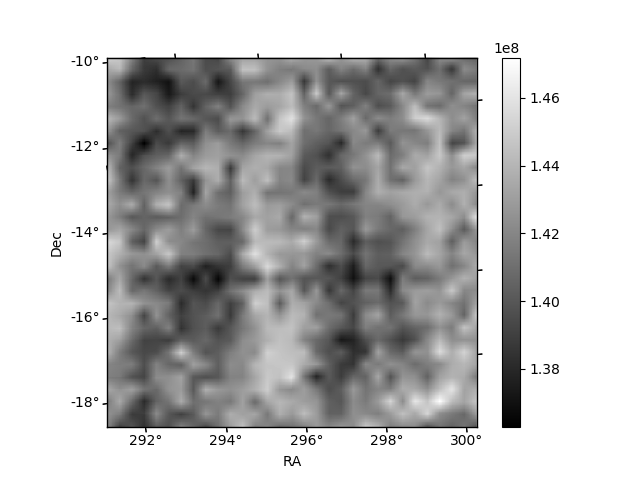
Histogram calculated using DETX and DETY for each event in the final _common_clean file
| Quadrant A | 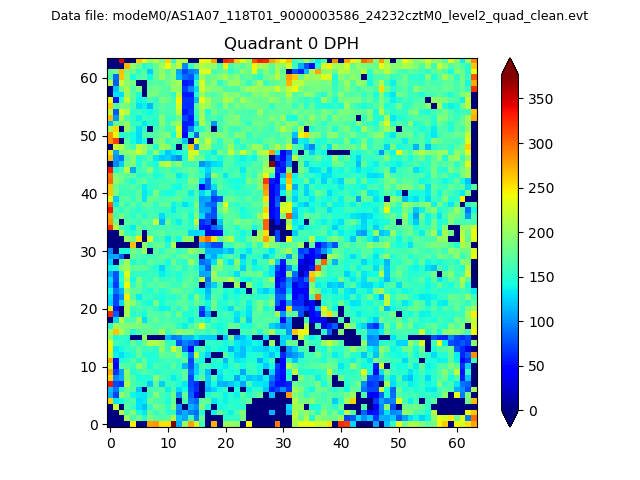 |
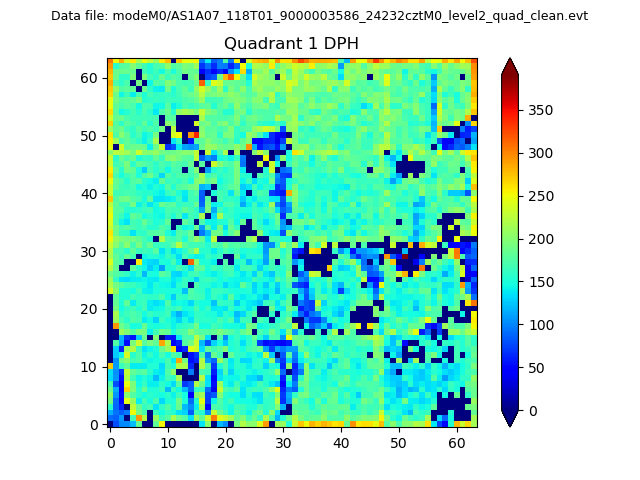 |
Quadrant B |
|---|---|---|---|
| Quadrant D | 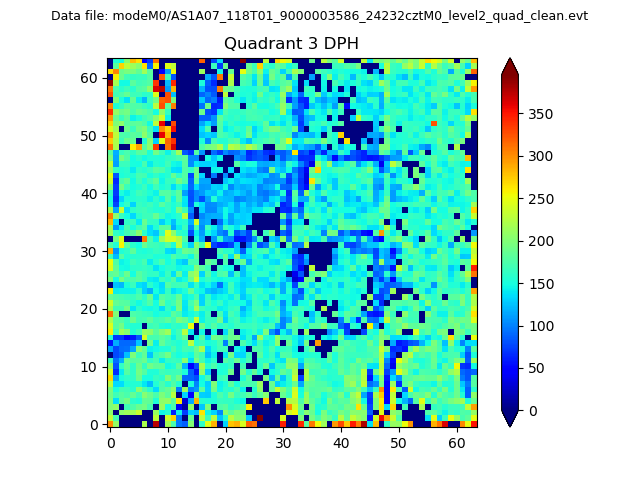 |
 |
Quadrant C |
| Plot type | Count rate plots | Images |
|---|---|---|
| Comparison with Poisson distribution Blue bars denote a histogram of data divided into 1 sec bins. Red curve is a Poisson curve with rate = median count rate of data. |
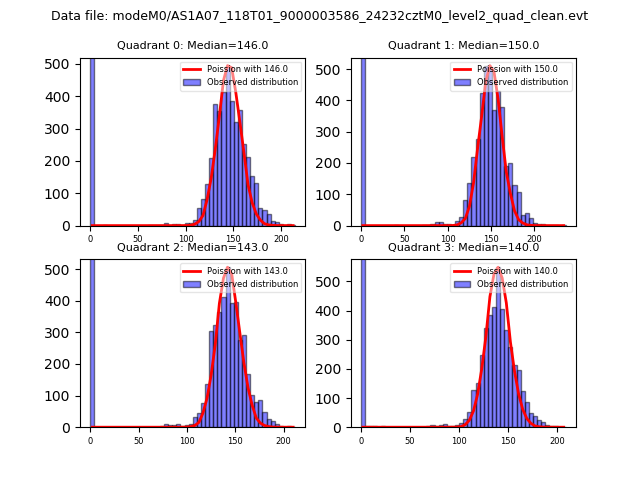 |
 |
| Quadrant-wise count rates Data is divided into 100 sec bins |
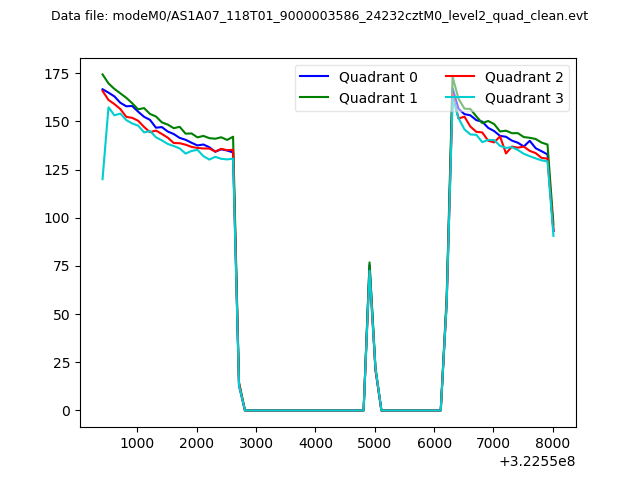 |
|
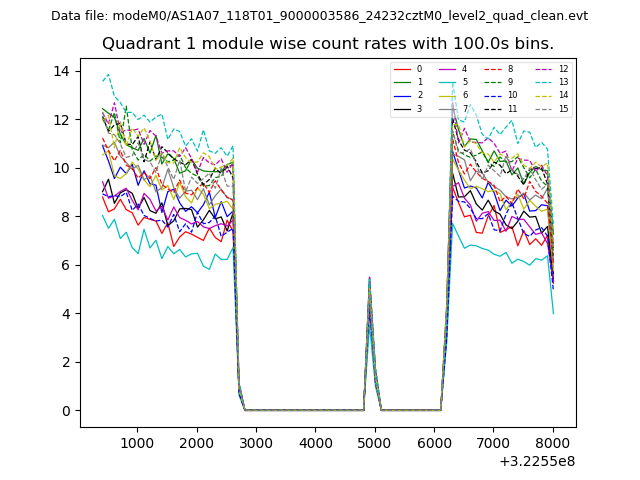
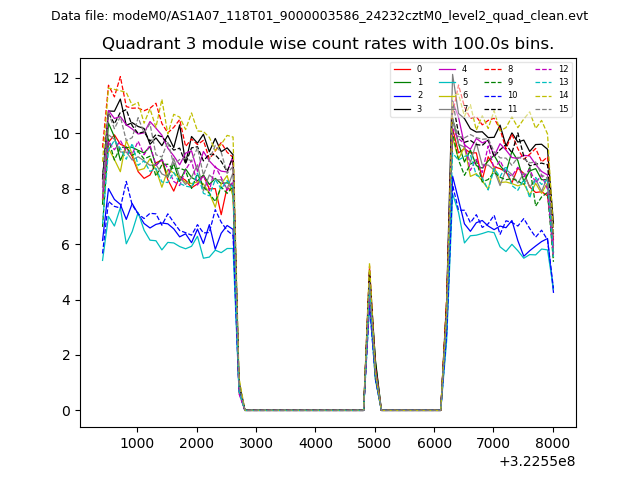
| Module-wise count rates for Quadrant A Data is divided into 100 sec bins |
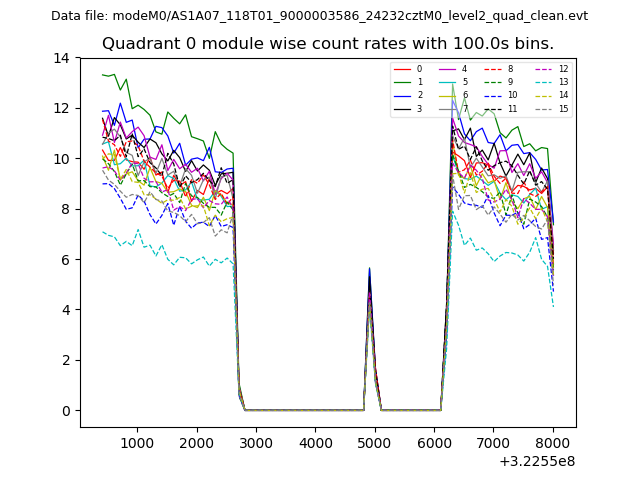 |
 |
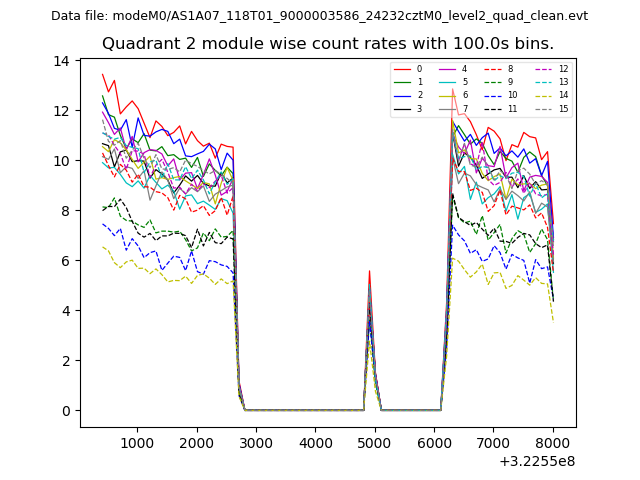
| Module-wise count rates for Quadrant B Data is divided into 100 sec bins |
 |
 |
| Module-wise count rates for Quadrant C Data is divided into 100 sec bins |
 |
 |
| Module-wise count rates for Quadrant D Data is divided into 100 sec bins |
 |
 |
| Parameter | Plot |
|---|---|
| CZT HV Monitor | 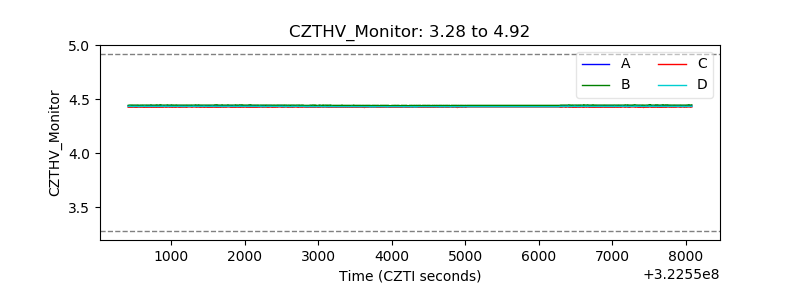 |
| D_VDD | 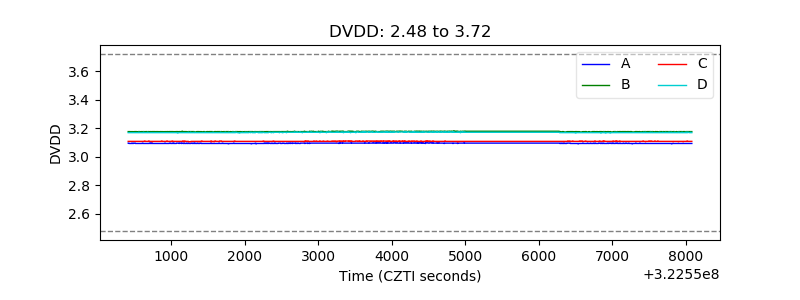 |
| Temperature 1 | 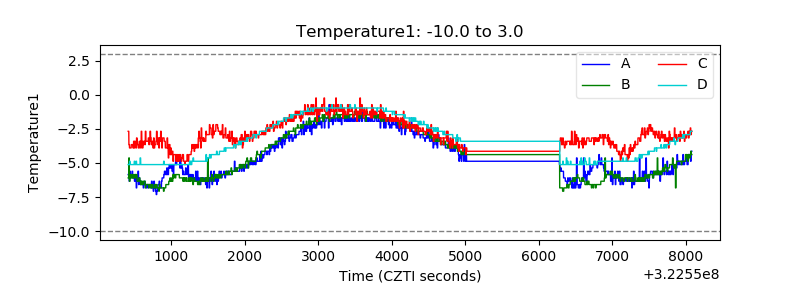 |
| Veto HV Monitor | 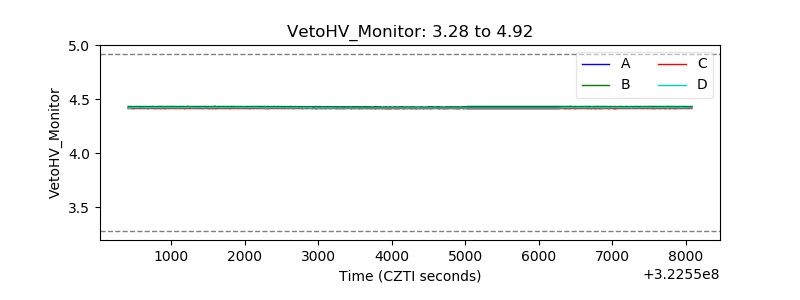 |
| Veto LLD | 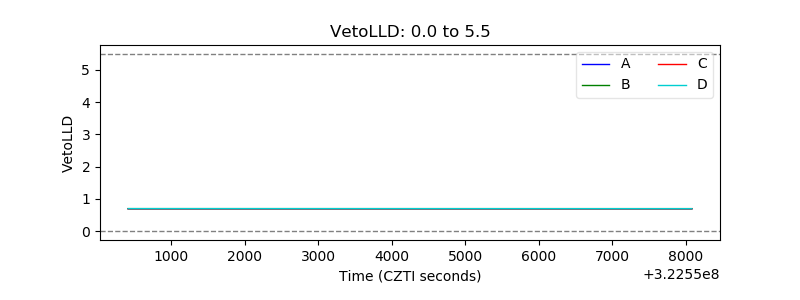 |
| Alpha Counter | 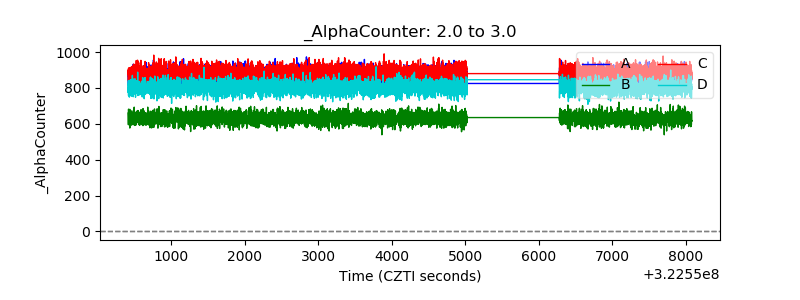 |
| _CPM_Rate | 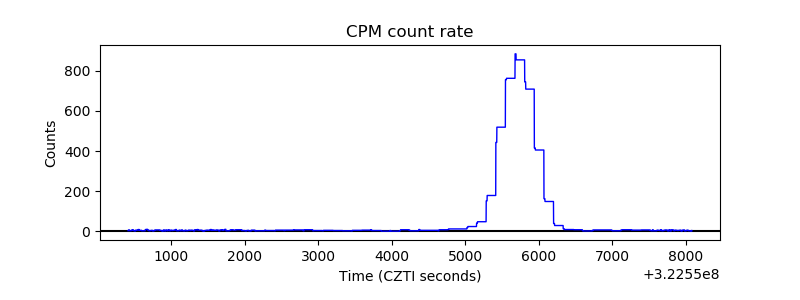 |
| CZT Counter | 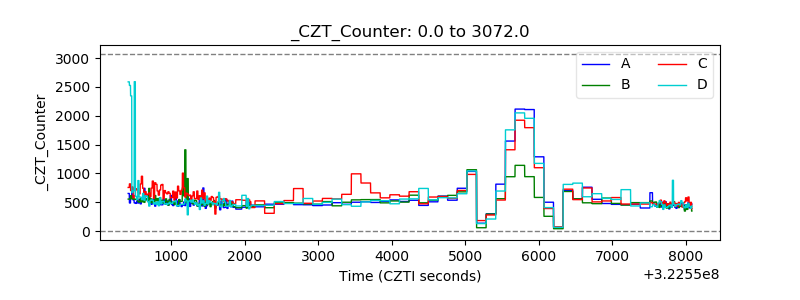 |
| +2.5 Volts monitor |  |
| +5 Volts monitor |  |
| _ROLL_ROT | 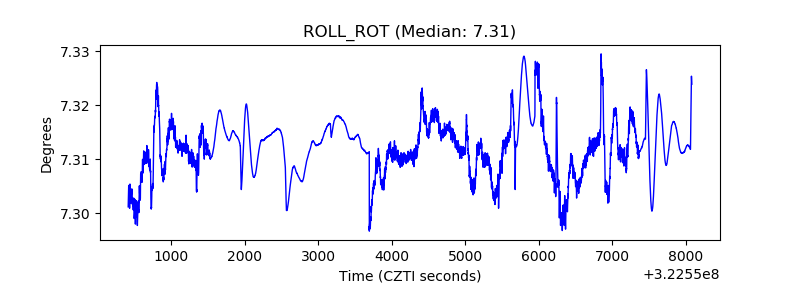 |
| _Roll_DEC | 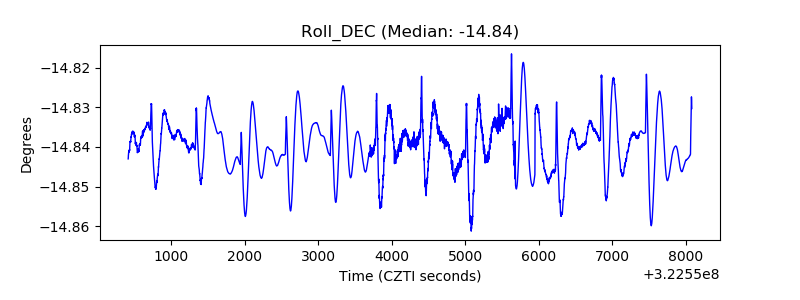 |
| _Roll_RA | 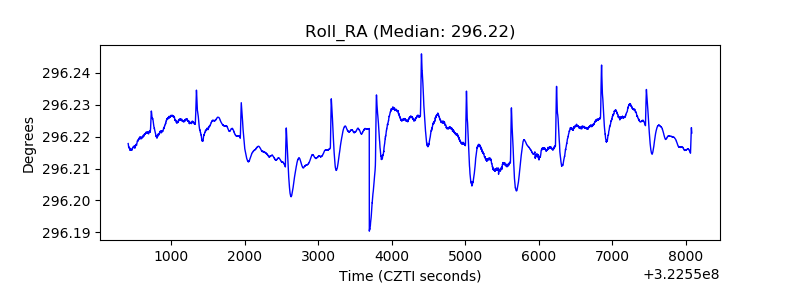 |
| Veto Counter | 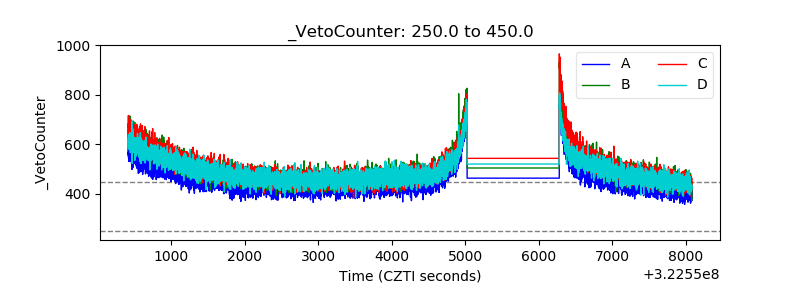 |