| Param | Original file | Final file |
|---|---|---|
| Filename | modeM0/AS1A07_118T01_9000003586_24235cztM0_level2.evt | modeM0/AS1A07_118T01_9000003586_24235cztM0_level2_quad_clean.evt |
| Size (bytes) | 595,258,560 | 94,438,080 |
| Size | 567.7 MB | 90.1 MB |
| Events in quadrant A | 3,618,022 | 591,715 |
| Events in quadrant B | 4,883,655 | 604,355 |
| Events in quadrant C | 4,171,718 | 573,586 |
| Events in quadrant D | 4,847,487 | 570,069 |
| Mode M0 | |||
|---|---|---|---|
| Quadrant | BADHDUFLAG | Total packets | Discarded packets |
| A | 0 | 15473 | 1 |
| B | 0 | 19168 | 1 |
| C | 0 | 16954 | 1 |
| D | 0 | 19286 | 1 |
| Mode SS | |||
|---|---|---|---|
| Quadrant | BADHDUFLAG | Total packets | Discarded packets |
| A | 0 | 150 | 0 |
| B | 0 | 150 | 0 |
| C | 0 | 150 | 0 |
| D | 0 | 150 | 0 |
| Quadrant | Total seconds | Saturated seconds | Saturation percentage |
|---|---|---|---|
| A | 7465 | 240 | 3.215003% |
| B | 7466 | 641 | 8.585588% |
| C | 7466 | 361 | 4.835253% |
| D | 7466 | 451 | 6.040718% |
Noise dominated data is calculated using 1-second bins in cleaned event files. If a bin has >2000 counts, and if more than 50% of those come from <1% of pixels, then it is considered to be noise-dominated and hence unusable.
| Quadrant | # 1 sec bins | Bins with >0 counts | Bins with >2000 counts | High rate bins dominated by noise | Noise dominated (total time) | Noise dominated (detector-on time) | Marked lightcurve |
|---|---|---|---|---|---|---|---|
| A | 7490 | 7465 | 0 | 0 | 0.00% | 0.00% | 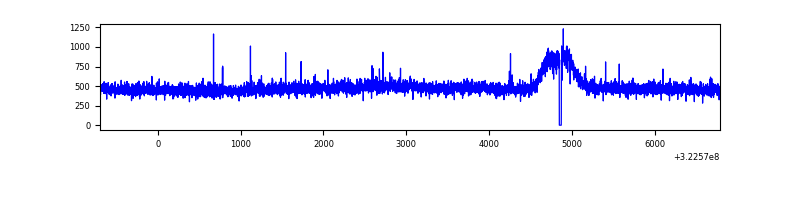 |
| B | 7491 | 7466 | 278 | 278 | 3.71% | 3.72% | 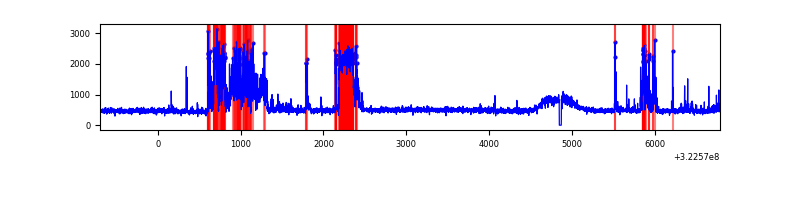 |
| C | 7491 | 7466 | 48 | 48 | 0.64% | 0.64% | 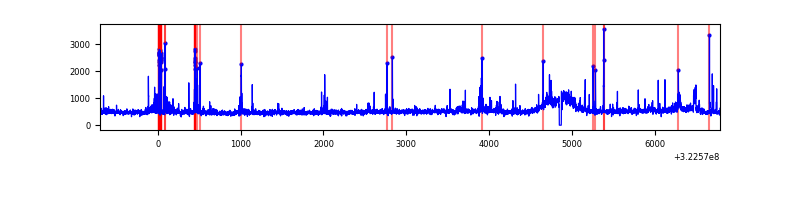 |
| D | 7491 | 7467 | 219 | 219 | 2.92% | 2.93% | 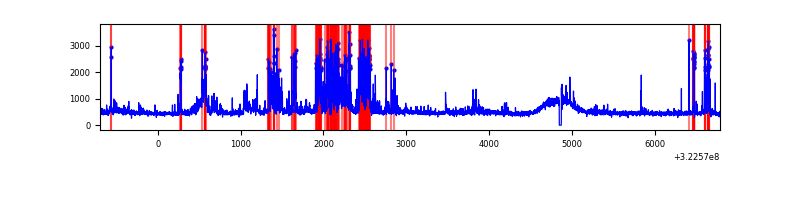 |
Top three noisy pixels from each quadrant. If the there are fewer than three noisy pixels in the level2.evt file, extra rows are filled as -1
| Pixel properties | Quadrant properties | ||||||
|---|---|---|---|---|---|---|---|
| Quadrant | DetID | PixID | Counts | Sigma | Mean | Median | Sigma |
| A | 3 | 1 | 25156 | 128.9 | 932 | 908 | 188.1 |
| A | 13 | 254 | 13144 | 65.04 | 932 | 908 | 188.1 |
| A | 3 | 137 | 8312 | 39.36 | 932 | 908 | 188.1 |
| B | 12 | 17 | 1161725 | 6596.87 | 905 | 882 | 176.0 |
| B | 15 | 33 | 54808 | 306.45 | 905 | 882 | 176.0 |
| B | 15 | 32 | 40281 | 223.9 | 905 | 882 | 176.0 |
| C | 2 | 16 | 344776 | 1630.82 | 890 | 896 | 210.9 |
| C | 7 | 247 | 208329 | 983.73 | 890 | 896 | 210.9 |
| C | 14 | 238 | 138611 | 653.1 | 890 | 896 | 210.9 |
| D | 12 | 233 | 975886 | 4394.58 | 906 | 875 | 221.9 |
| D | 7 | 238 | 216781 | 973.13 | 906 | 875 | 221.9 |
| D | 12 | 33 | 123468 | 552.55 | 906 | 875 | 221.9 |
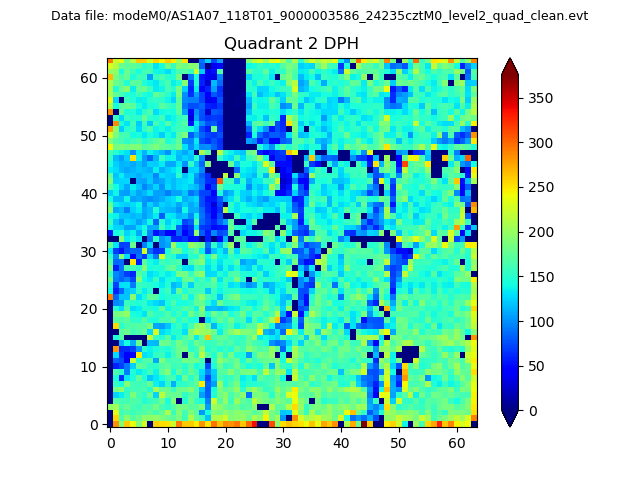
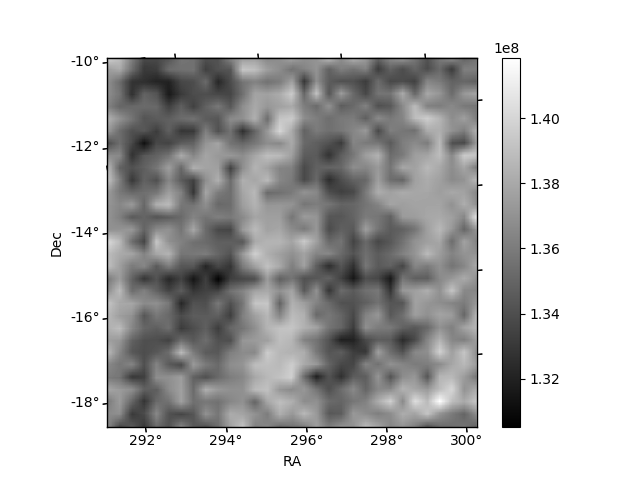
Histogram calculated using DETX and DETY for each event in the final _common_clean file
| Quadrant A | 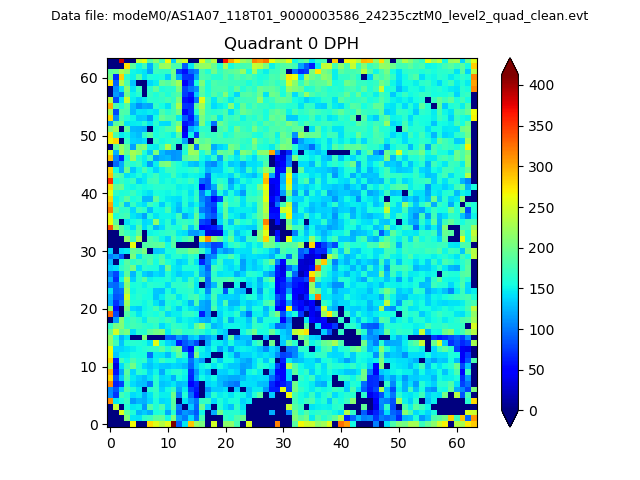 |
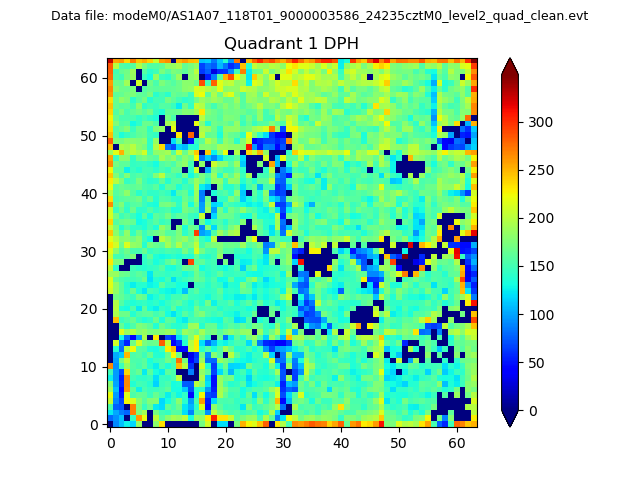 |
Quadrant B |
|---|---|---|---|
| Quadrant D | 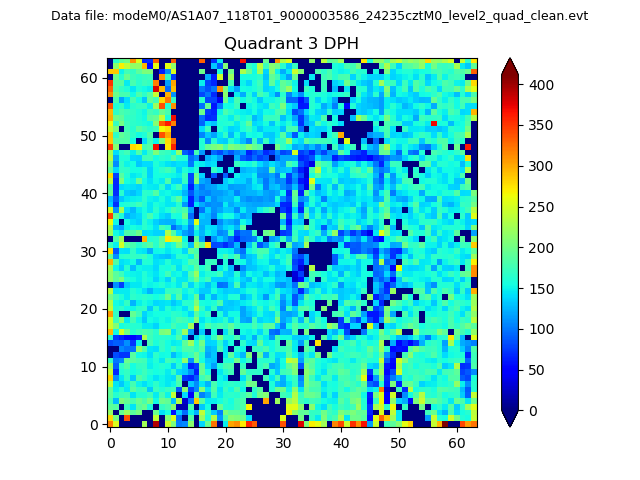 |
 |
Quadrant C |
| Plot type | Count rate plots | Images |
|---|---|---|
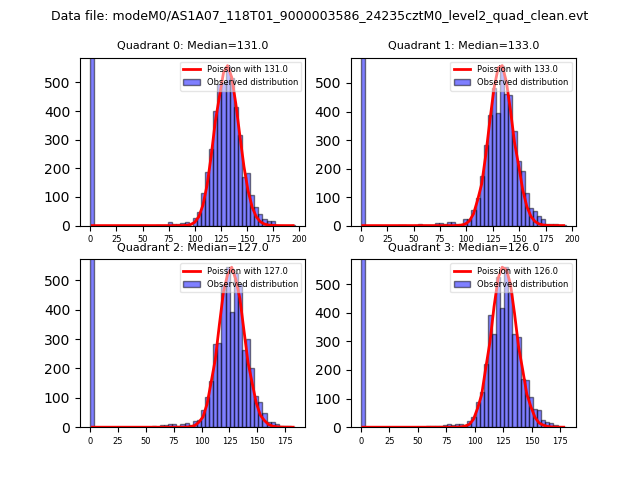
| Comparison with Poisson distribution Blue bars denote a histogram of data divided into 1 sec bins. Red curve is a Poisson curve with rate = median count rate of data. |
 |
 |
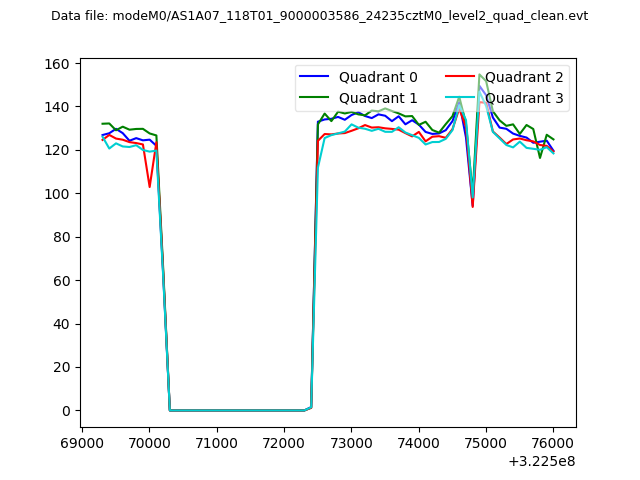
| Quadrant-wise count rates Data is divided into 100 sec bins |
 |
|
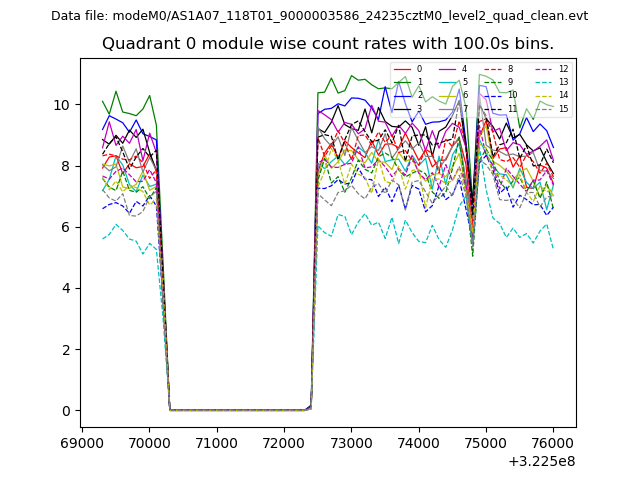
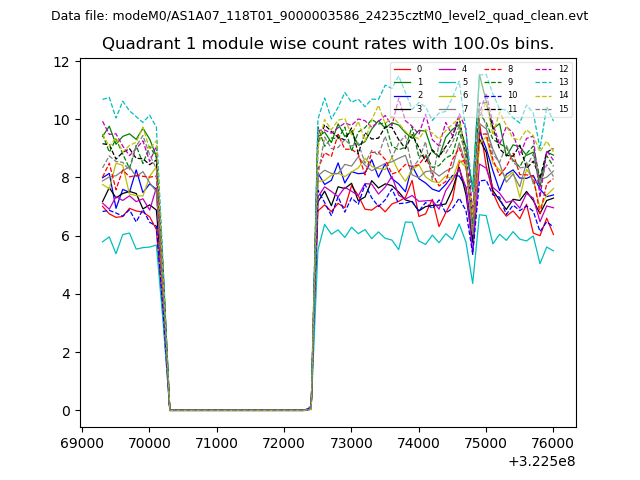
| Module-wise count rates for Quadrant A Data is divided into 100 sec bins |
 |
 |
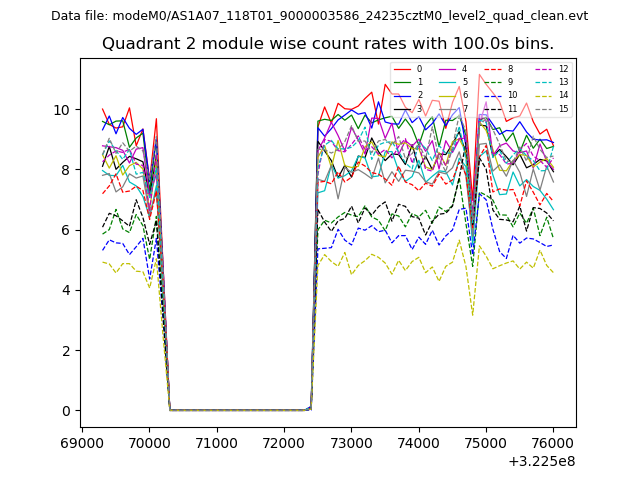
| Module-wise count rates for Quadrant B Data is divided into 100 sec bins |
 |
 |
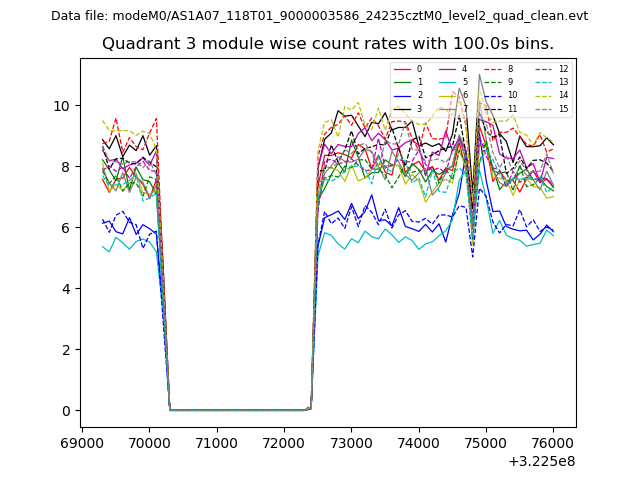
| Module-wise count rates for Quadrant C Data is divided into 100 sec bins |
 |
 |
| Module-wise count rates for Quadrant D Data is divided into 100 sec bins |
 |
 |
| Parameter | Plot |
|---|---|
| CZT HV Monitor | 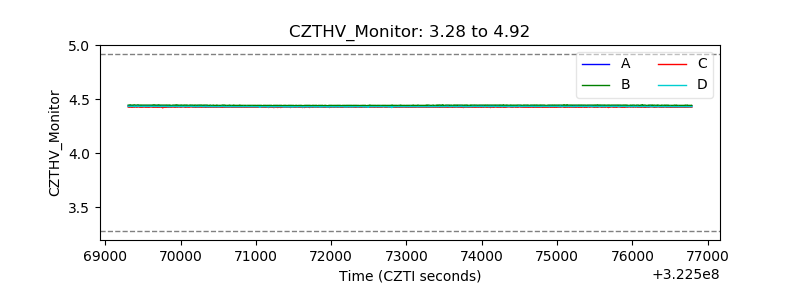 |
| D_VDD | 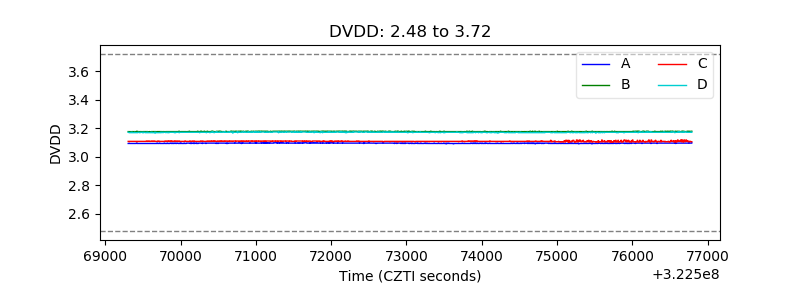 |
| Temperature 1 | 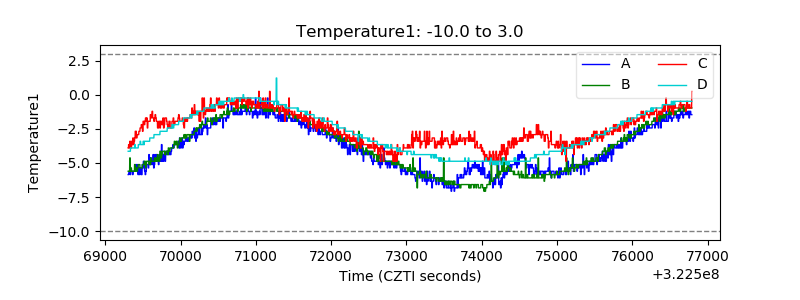 |
| Veto HV Monitor |  |
| Veto LLD | 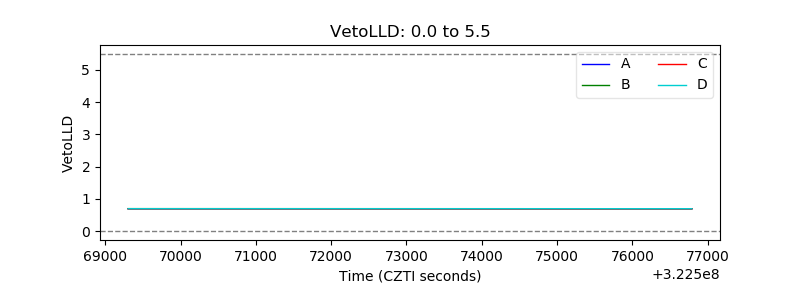 |
| Alpha Counter |  |
| _CPM_Rate | 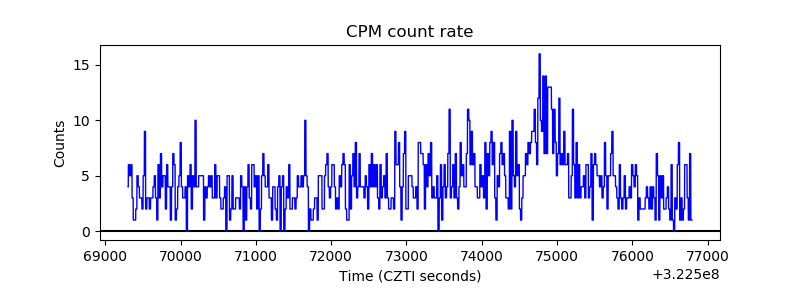 |
| CZT Counter | 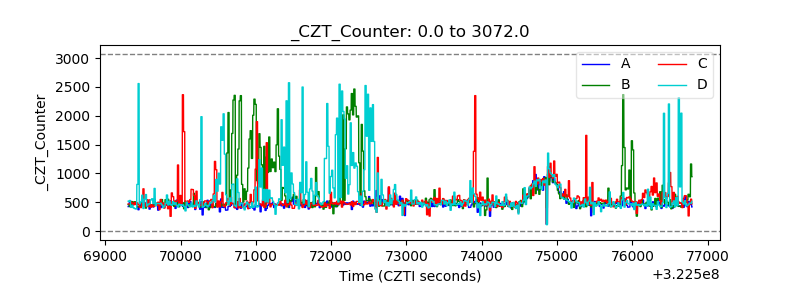 |
| +2.5 Volts monitor |  |
| +5 Volts monitor |  |
| _ROLL_ROT | 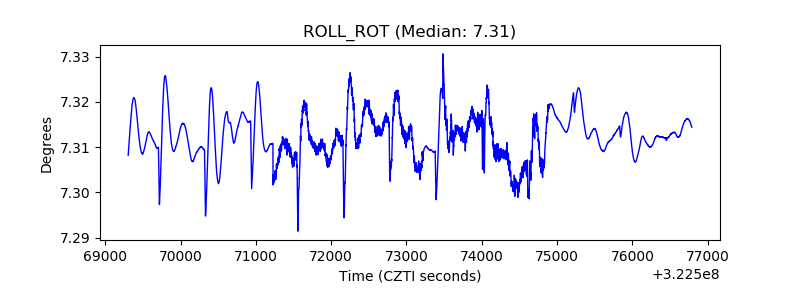 |
| _Roll_DEC | 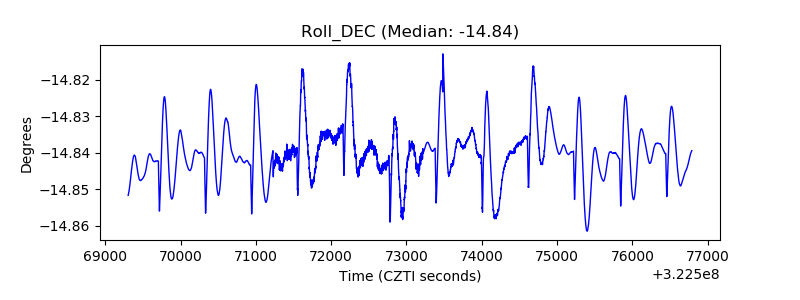 |
| _Roll_RA | 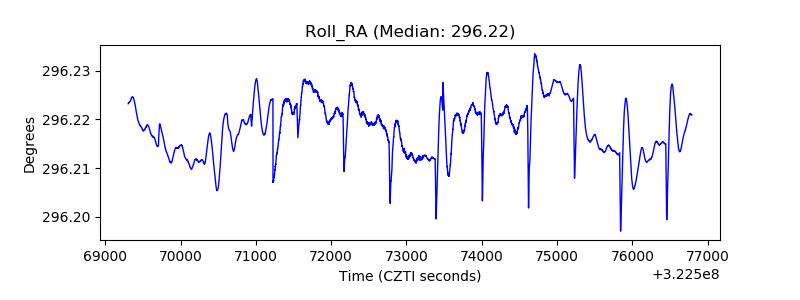 |
| Veto Counter | 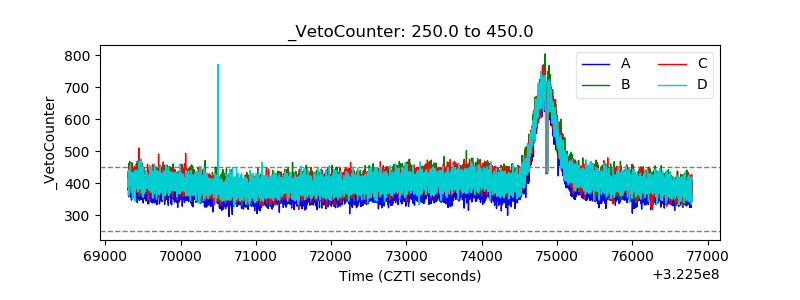 |