| Param | Original file | Final file |
|---|---|---|
| Filename | modeM0/AS1A07_118T01_9000003586_24236cztM0_level2.evt | modeM0/AS1A07_118T01_9000003586_24236cztM0_level2_quad_clean.evt |
| Size (bytes) | 666,587,520 | 88,937,280 |
| Size | 635.7 MB | 84.8 MB |
| Events in quadrant A | 3,651,546 | 556,098 |
| Events in quadrant B | 4,074,788 | 567,408 |
| Events in quadrant C | 4,722,755 | 535,568 |
| Events in quadrant D | 7,222,404 | 503,745 |
| Mode M0 | |||
|---|---|---|---|
| Quadrant | BADHDUFLAG | Total packets | Discarded packets |
| A | 0 | 15699 | 1 |
| B | 0 | 16831 | 1 |
| C | 0 | 19046 | 1 |
| D | 0 | 26499 | 1 |
| Mode SS | |||
|---|---|---|---|
| Quadrant | BADHDUFLAG | Total packets | Discarded packets |
| A | 0 | 154 | 0 |
| B | 0 | 154 | 0 |
| C | 0 | 154 | 0 |
| D | 0 | 154 | 0 |
| Mode M9 | |||
|---|---|---|---|
| Quadrant | BADHDUFLAG | Total packets | Discarded packets |
| A | 0 | 2 | 0 |
| B | 0 | 2 | 0 |
| C | 0 | 2 | 0 |
| D | 0 | 2 | 0 |
| Quadrant | Total seconds | Saturated seconds | Saturation percentage |
|---|---|---|---|
| A | 7617 | 162 | 2.126822% |
| B | 7618 | 259 | 3.399842% |
| C | 7618 | 269 | 3.531111% |
| D | 7618 | 1669 | 21.908637% |
Noise dominated data is calculated using 1-second bins in cleaned event files. If a bin has >2000 counts, and if more than 50% of those come from <1% of pixels, then it is considered to be noise-dominated and hence unusable.
| Quadrant | # 1 sec bins | Bins with >0 counts | Bins with >2000 counts | High rate bins dominated by noise | Noise dominated (total time) | Noise dominated (detector-on time) | Marked lightcurve |
|---|---|---|---|---|---|---|---|
| A | 7797 | 7617 | 0 | 0 | 0.00% | 0.00% | 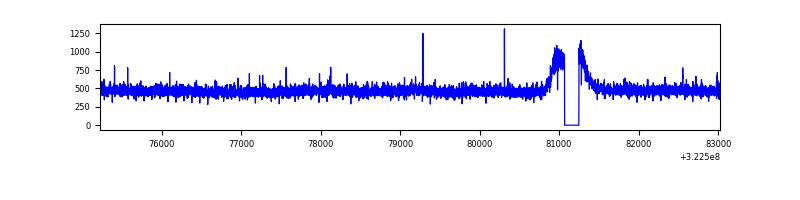 |
| B | 7798 | 7618 | 63 | 63 | 0.81% | 0.83% | 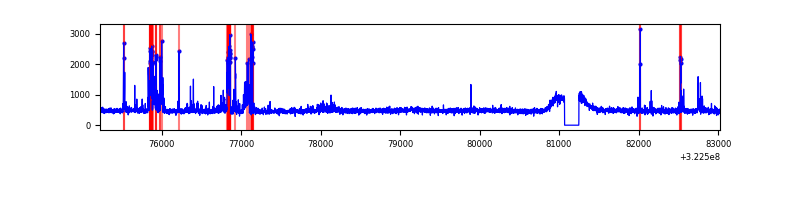 |
| C | 7798 | 7618 | 19 | 19 | 0.24% | 0.25% | 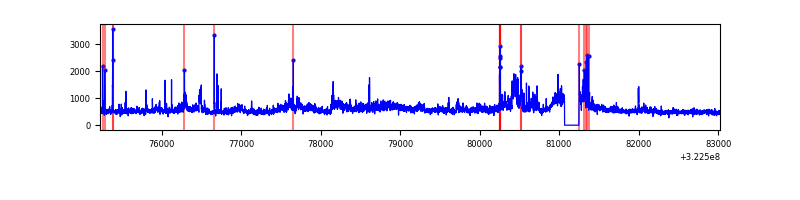 |
| D | 7798 | 7618 | 1411 | 1411 | 18.09% | 18.52% | 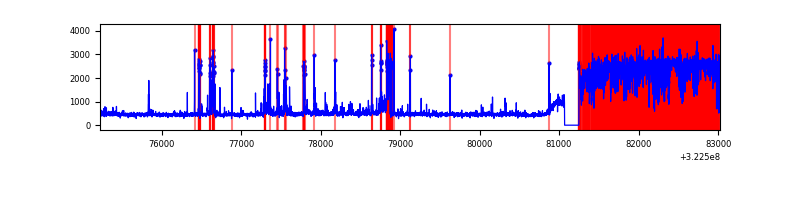 |
Top three noisy pixels from each quadrant. If the there are fewer than three noisy pixels in the level2.evt file, extra rows are filled as -1
| Pixel properties | Quadrant properties | ||||||
|---|---|---|---|---|---|---|---|
| Quadrant | DetID | PixID | Counts | Sigma | Mean | Median | Sigma |
| A | 3 | 1 | 13335 | 65.13 | 941 | 918 | 190.7 |
| A | 13 | 254 | 13080 | 63.79 | 941 | 918 | 190.7 |
| A | 3 | 137 | 8402 | 39.25 | 941 | 918 | 190.7 |
| B | 0 | 245 | 205686 | 1139.56 | 931 | 906 | 179.7 |
| B | 12 | 17 | 163420 | 904.36 | 931 | 906 | 179.7 |
| B | 0 | 190 | 23063 | 123.3 | 931 | 906 | 179.7 |
| C | 7 | 247 | 867119 | 4081.13 | 898 | 903 | 212.2 |
| C | 2 | 16 | 186091 | 872.5 | 898 | 903 | 212.2 |
| C | 14 | 238 | 140169 | 656.14 | 898 | 903 | 212.2 |
| D | 7 | 238 | 3420468 | 16532.51 | 844 | 817 | 206.8 |
| D | 12 | 233 | 465812 | 2248.05 | 844 | 817 | 206.8 |
| D | 1 | 52 | 53600 | 255.18 | 844 | 817 | 206.8 |
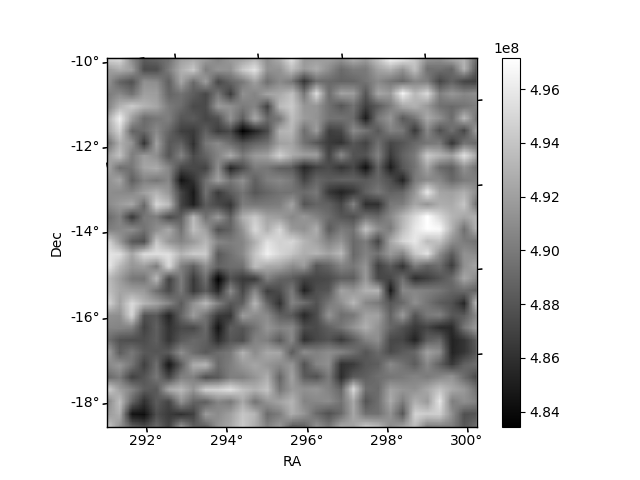
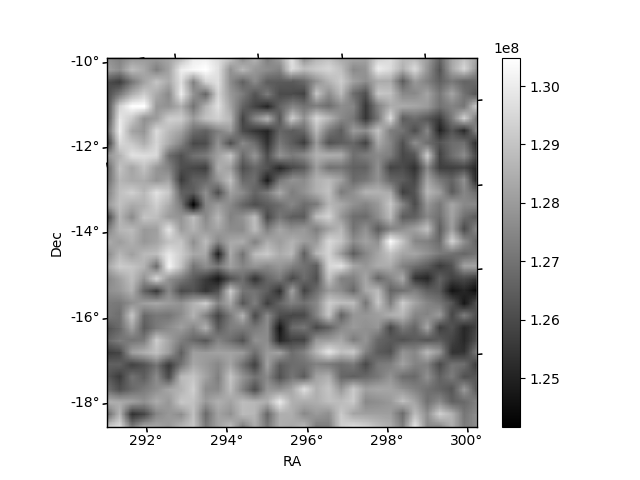
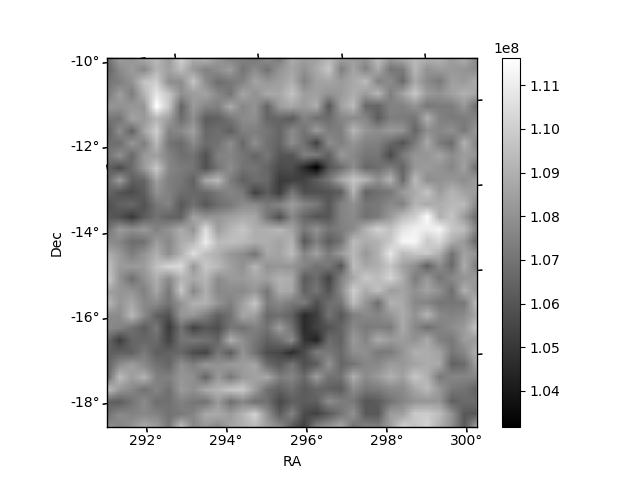
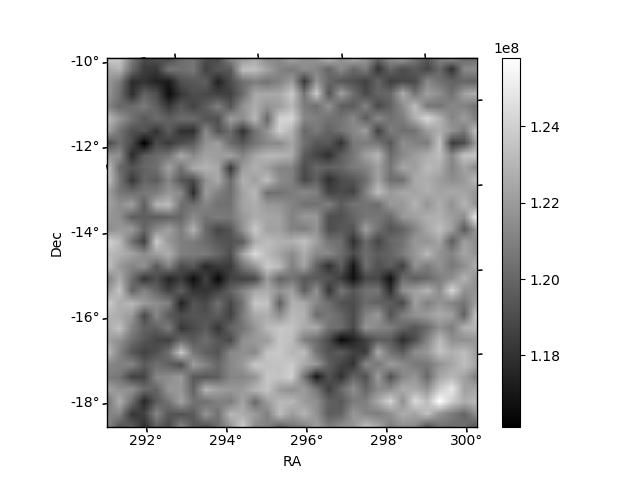
Histogram calculated using DETX and DETY for each event in the final _common_clean file
| Quadrant A | 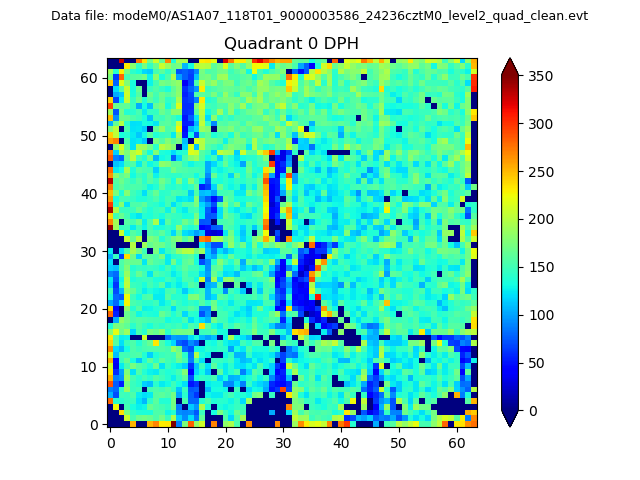 |
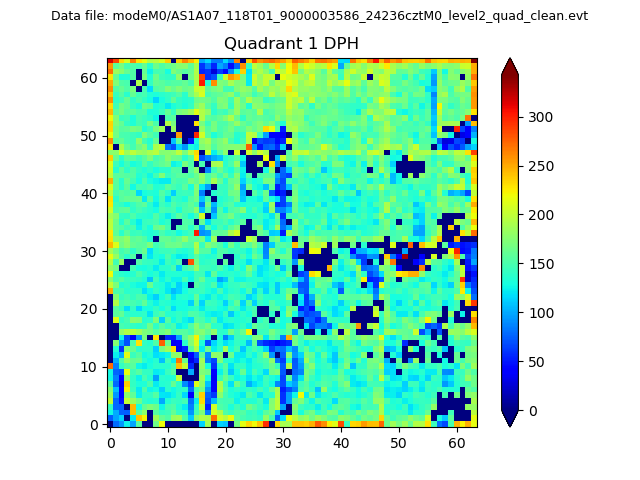 |
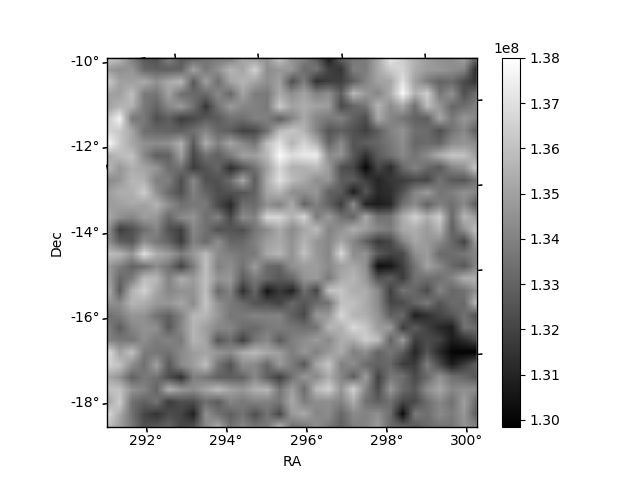
Quadrant B |
|---|---|---|---|
| Quadrant D | 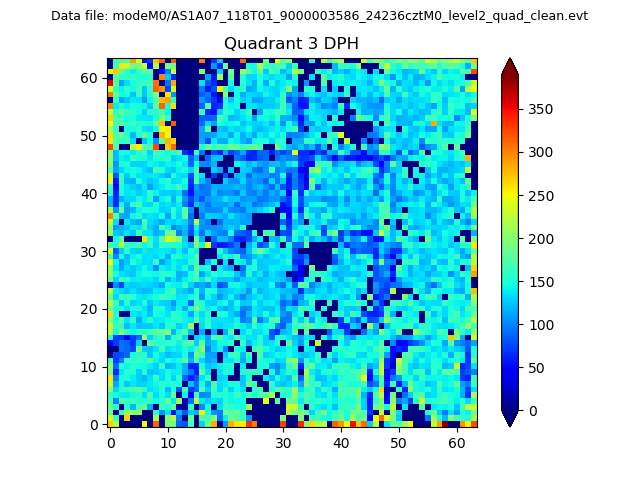 |
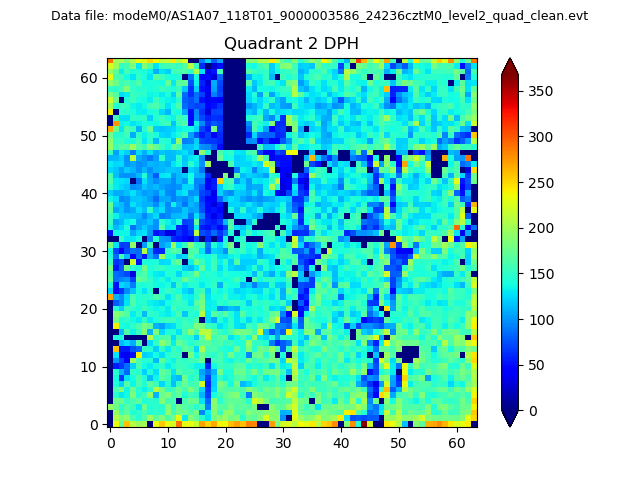 |
Quadrant C |
| Plot type | Count rate plots | Images |
|---|---|---|
| Comparison with Poisson distribution Blue bars denote a histogram of data divided into 1 sec bins. Red curve is a Poisson curve with rate = median count rate of data. |
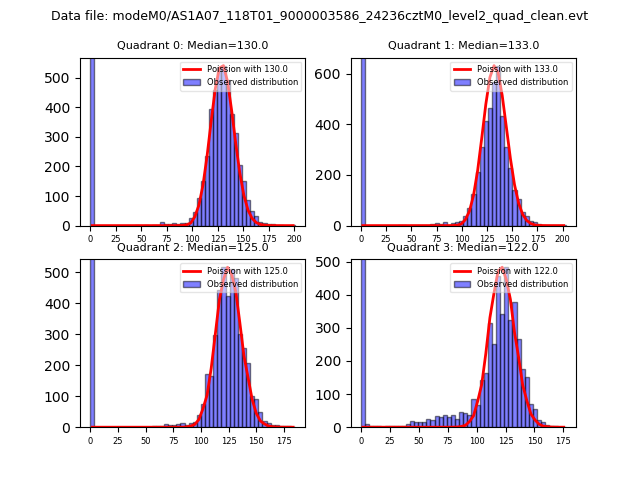 |
 |
| Quadrant-wise count rates Data is divided into 100 sec bins |
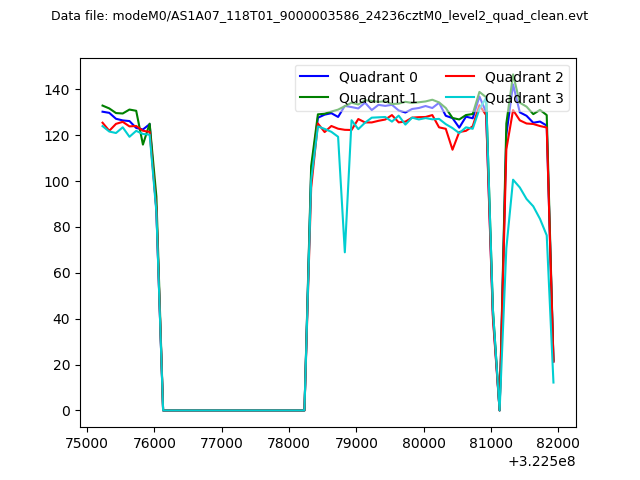 |
|
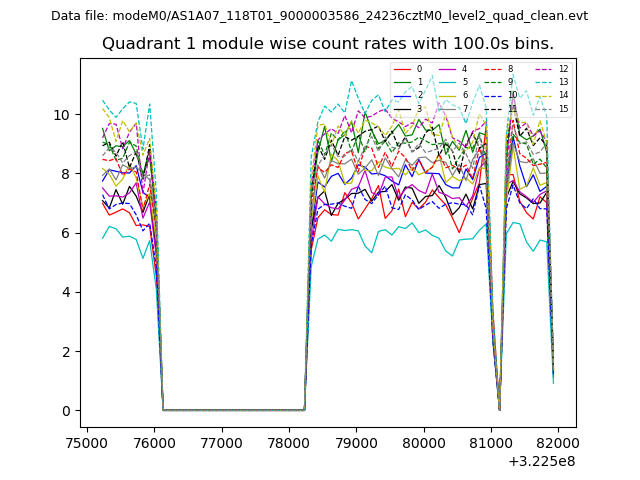
| Module-wise count rates for Quadrant A Data is divided into 100 sec bins |
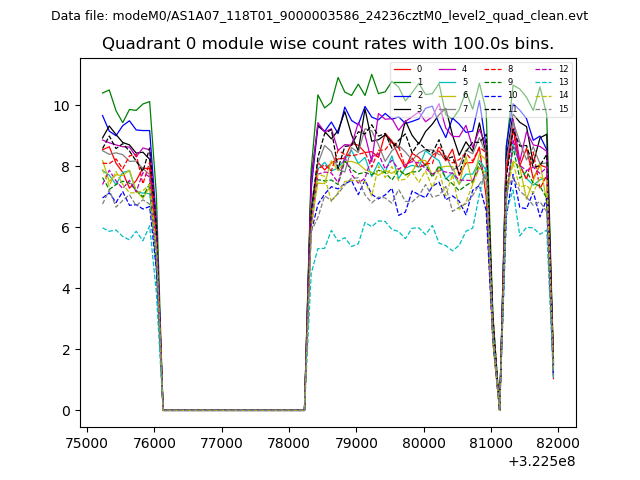 |
 |
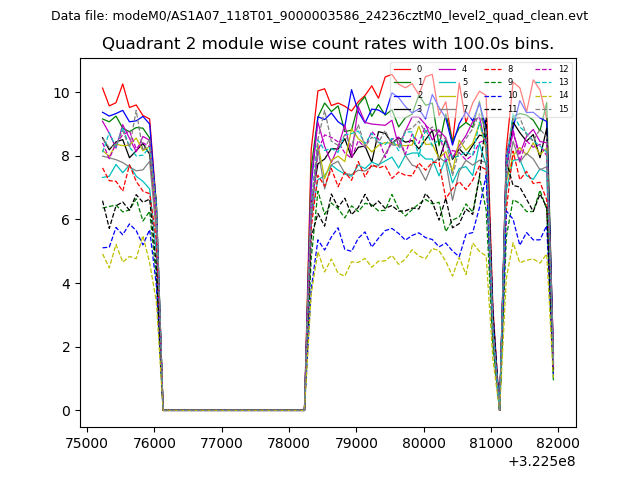
| Module-wise count rates for Quadrant B Data is divided into 100 sec bins |
 |
 |
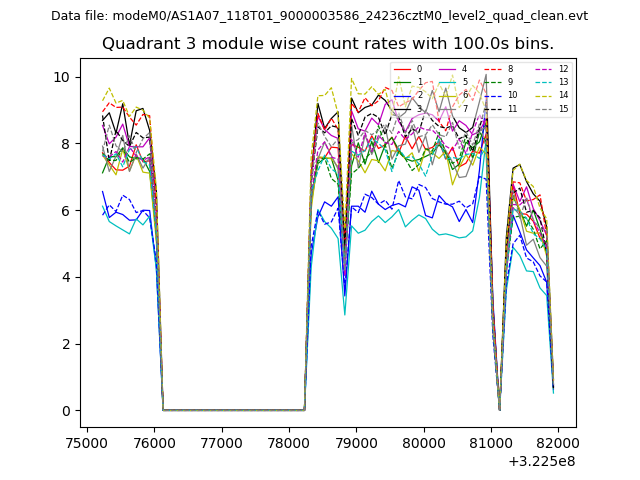
| Module-wise count rates for Quadrant C Data is divided into 100 sec bins |
 |
 |
| Module-wise count rates for Quadrant D Data is divided into 100 sec bins |
 |
 |
| Parameter | Plot |
|---|---|
| CZT HV Monitor | 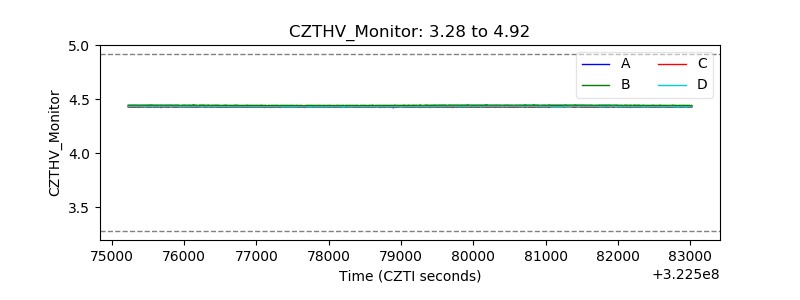 |
| D_VDD |  |
| Temperature 1 | 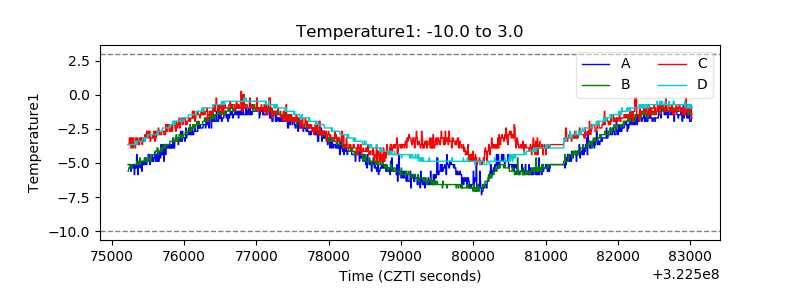 |
| Veto HV Monitor |  |
| Veto LLD | 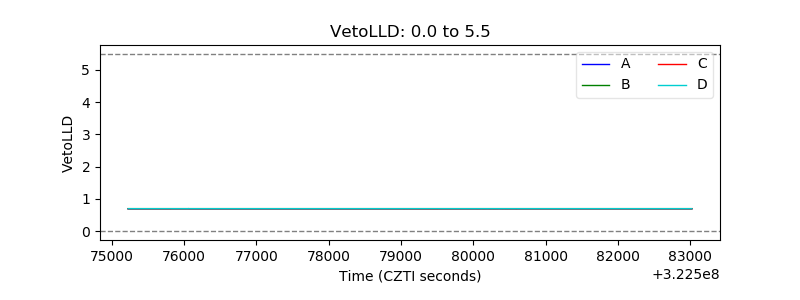 |
| Alpha Counter | 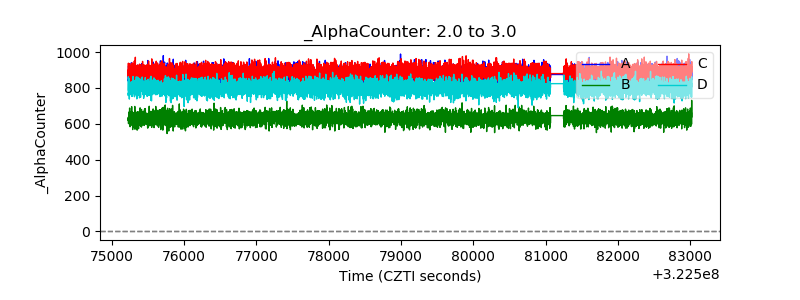 |
| _CPM_Rate | 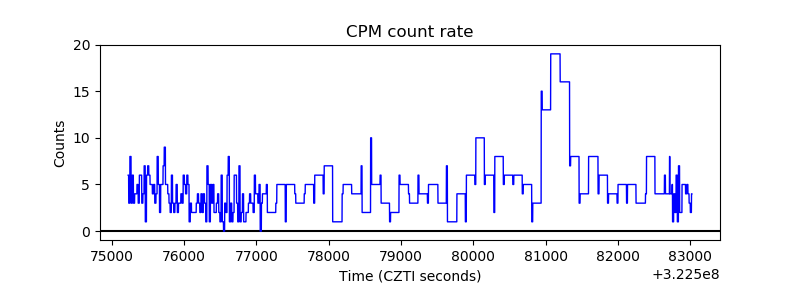 |
| CZT Counter | 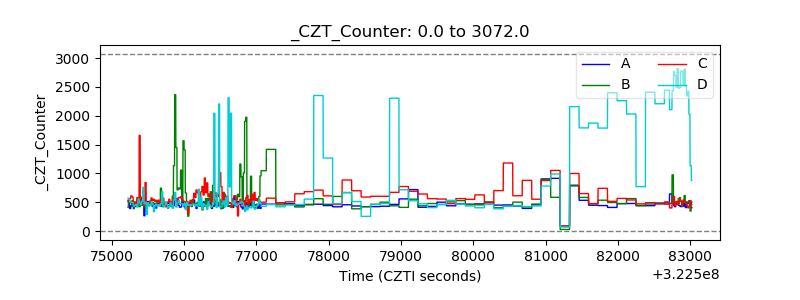 |
| +2.5 Volts monitor |  |
| +5 Volts monitor |  |
| _ROLL_ROT | 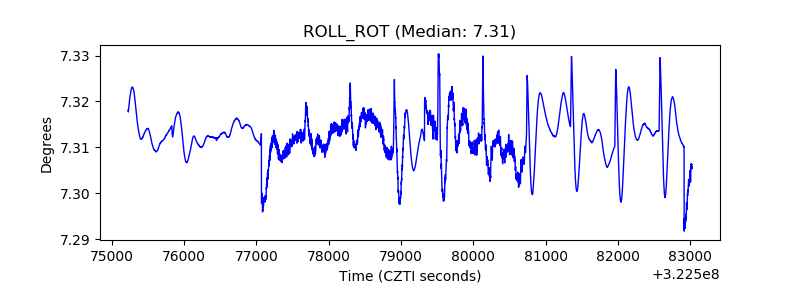 |
| _Roll_DEC | 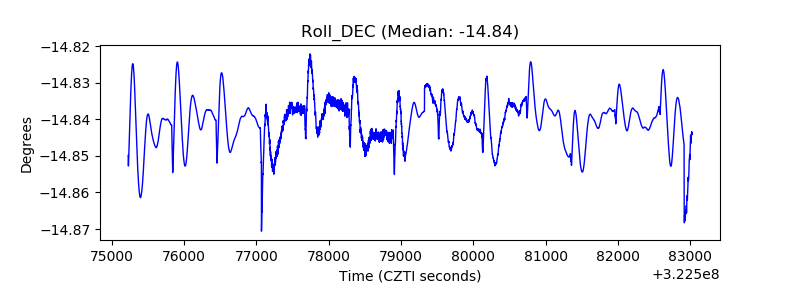 |
| _Roll_RA | 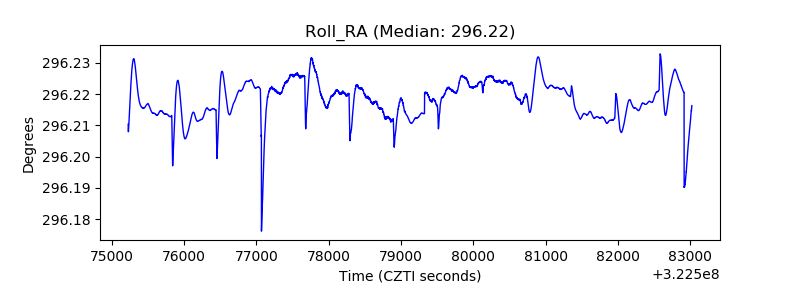 |
| Veto Counter | 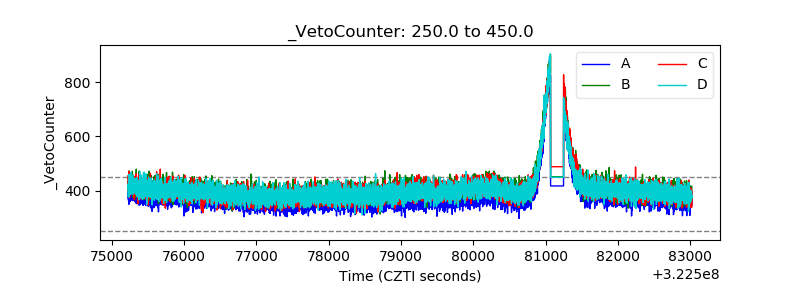 |