| Param | Original file | Final file |
|---|---|---|
| Filename | modeM0/AS1A07_118T01_9000003586_24243cztM0_level2.evt | modeM0/AS1A07_118T01_9000003586_24243cztM0_level2_quad_clean.evt |
| Size (bytes) | 518,584,320 | 104,523,840 |
| Size | 494.6 MB | 99.7 MB |
| Events in quadrant A | 3,261,362 | 690,775 |
| Events in quadrant B | 3,395,734 | 715,792 |
| Events in quadrant C | 3,565,529 | 681,542 |
| Events in quadrant D | 5,056,468 | 638,447 |
| Mode M0 | |||
|---|---|---|---|
| Quadrant | BADHDUFLAG | Total packets | Discarded packets |
| A | 0 | 13751 | 2 |
| B | 0 | 14123 | 2 |
| C | 0 | 14772 | 2 |
| D | 0 | 19336 | 2 |
| Mode SS | |||
|---|---|---|---|
| Quadrant | BADHDUFLAG | Total packets | Discarded packets |
| A | 0 | 128 | 0 |
| B | 0 | 128 | 0 |
| C | 0 | 128 | 0 |
| D | 0 | 128 | 0 |
| Mode M9 | |||
|---|---|---|---|
| Quadrant | BADHDUFLAG | Total packets | Discarded packets |
| A | 0 | 17 | 0 |
| B | 0 | 18 | 0 |
| C | 0 | 18 | 0 |
| D | 0 | 18 | 0 |
| Quadrant | Total seconds | Saturated seconds | Saturation percentage |
|---|---|---|---|
| A | 6289 | 47 | 0.747337% |
| B | 6289 | 76 | 1.208459% |
| C | 6289 | 99 | 1.574177% |
| D | 6289 | 229 | 3.641278% |
Noise dominated data is calculated using 1-second bins in cleaned event files. If a bin has >2000 counts, and if more than 50% of those come from <1% of pixels, then it is considered to be noise-dominated and hence unusable.
| Quadrant | # 1 sec bins | Bins with >0 counts | Bins with >2000 counts | High rate bins dominated by noise | Noise dominated (total time) | Noise dominated (detector-on time) | Marked lightcurve |
|---|---|---|---|---|---|---|---|
| A | 7554 | 6290 | 2 | 2 | 0.03% | 0.03% | 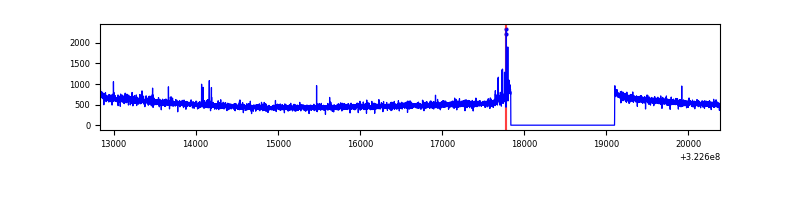 |
| B | 7554 | 6290 | 6 | 6 | 0.08% | 0.10% | 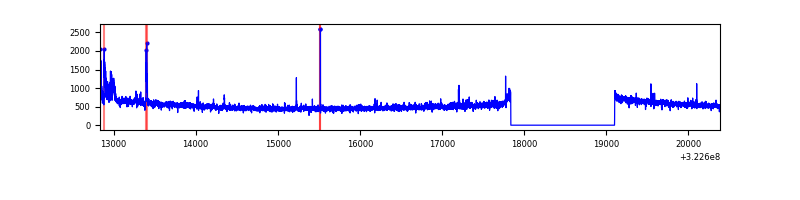 |
| C | 7554 | 6290 | 1 | 1 | 0.01% | 0.02% | 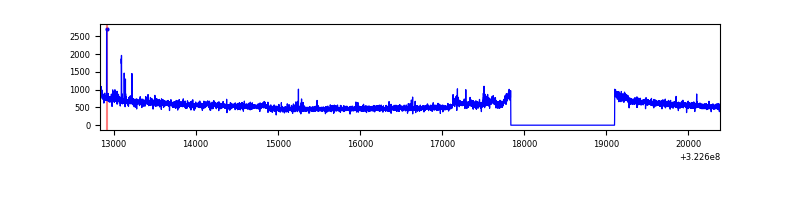 |
| D | 7554 | 6290 | 268 | 268 | 3.55% | 4.26% | 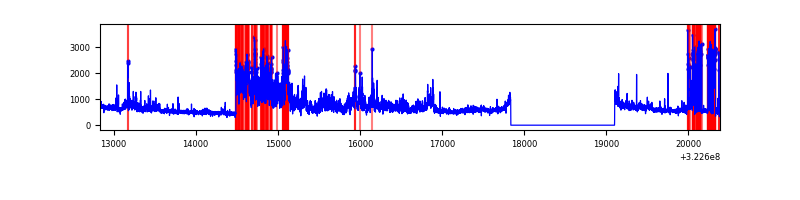 |
Top three noisy pixels from each quadrant. If the there are fewer than three noisy pixels in the level2.evt file, extra rows are filled as -1
| Pixel properties | Quadrant properties | ||||||
|---|---|---|---|---|---|---|---|
| Quadrant | DetID | PixID | Counts | Sigma | Mean | Median | Sigma |
| A | 6 | 16 | 24605 | 142.46 | 835 | 820 | 167.0 |
| A | 3 | 1 | 15342 | 86.98 | 835 | 820 | 167.0 |
| A | 13 | 254 | 11534 | 64.17 | 835 | 820 | 167.0 |
| B | 15 | 33 | 78428 | 492.89 | 842 | 822 | 157.4 |
| B | 12 | 111 | 18488 | 112.2 | 842 | 822 | 157.4 |
| B | 11 | 111 | 16026 | 96.56 | 842 | 822 | 157.4 |
| C | 7 | 247 | 219035 | 1149.41 | 814 | 823 | 189.8 |
| C | 14 | 238 | 129269 | 676.58 | 814 | 823 | 189.8 |
| C | 2 | 16 | 38266 | 197.23 | 814 | 823 | 189.8 |
| D | 8 | 195 | 1474578 | 7552.91 | 806 | 785 | 195.1 |
| D | 1 | 52 | 425012 | 2174.08 | 806 | 785 | 195.1 |
| D | 7 | 38 | 66916 | 338.91 | 806 | 785 | 195.1 |
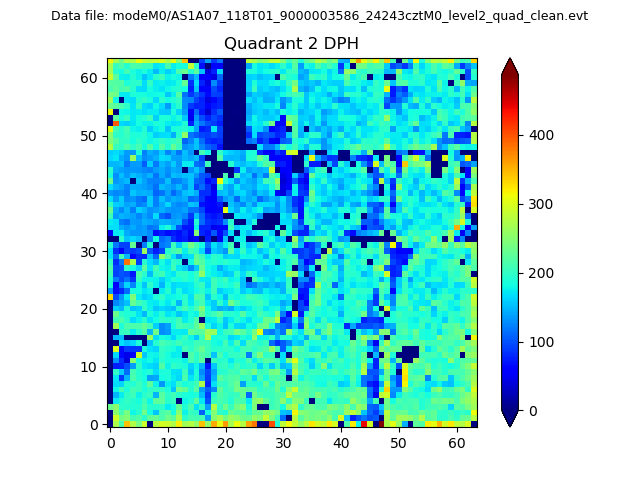
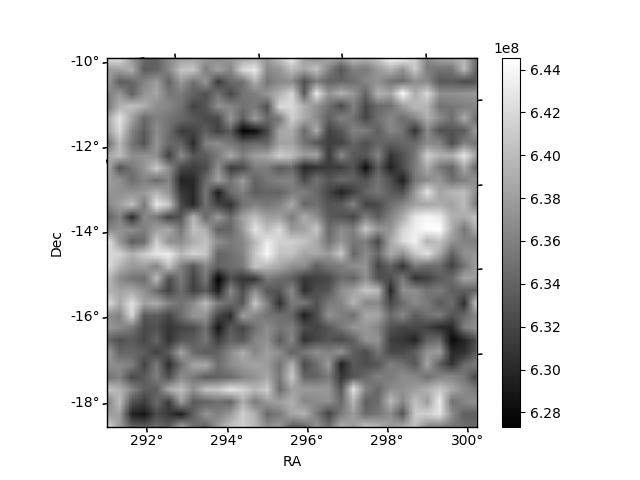
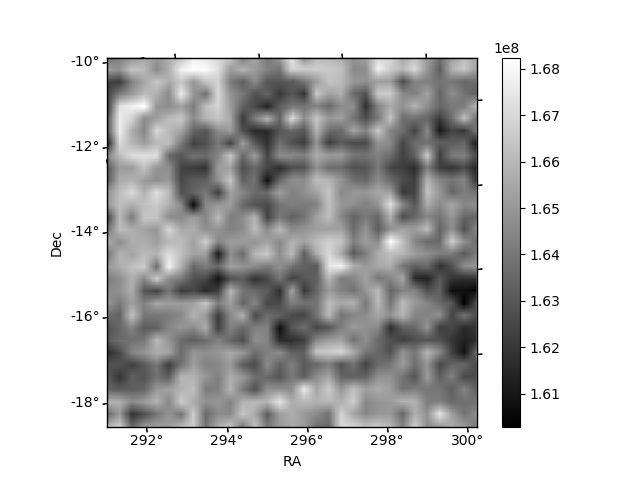
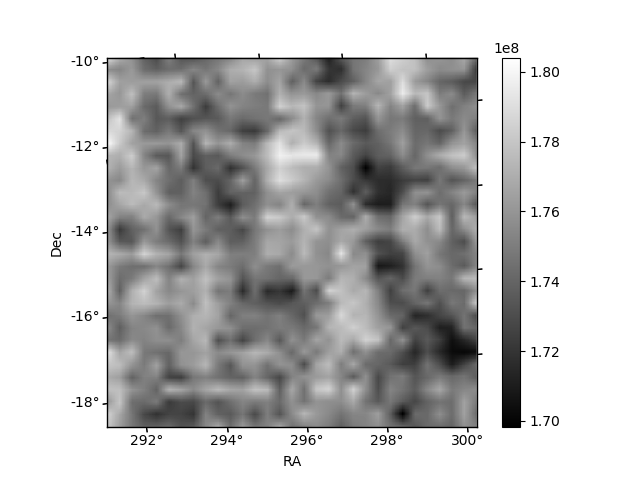
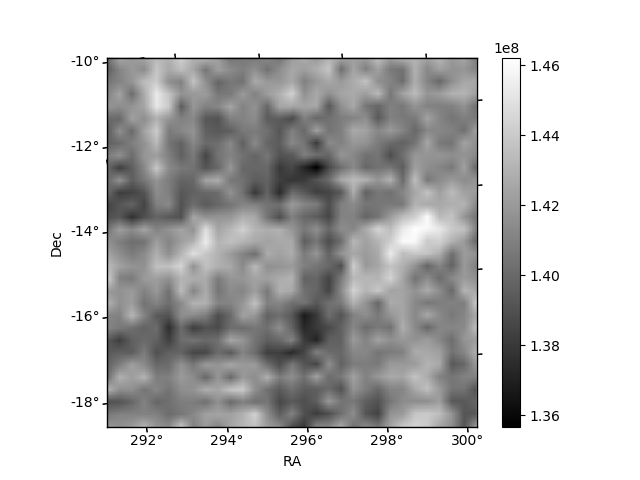
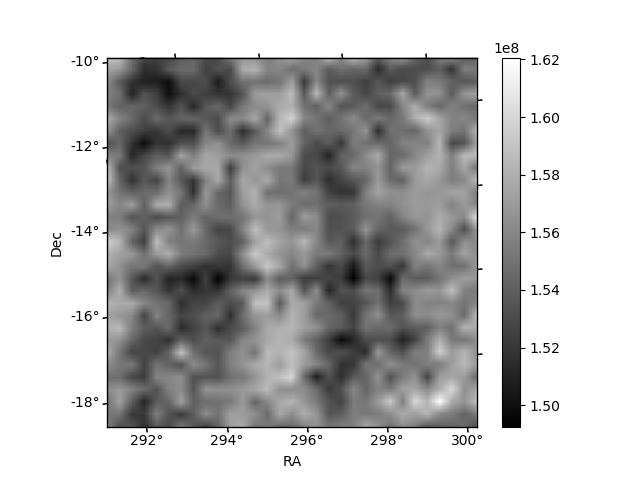
Histogram calculated using DETX and DETY for each event in the final _common_clean file
| Quadrant A | 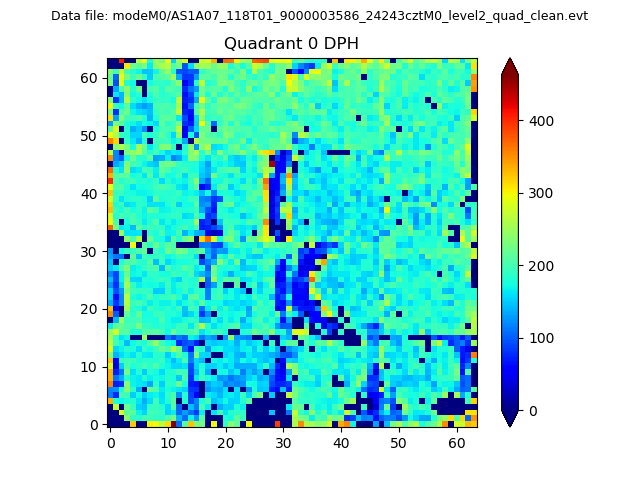 |
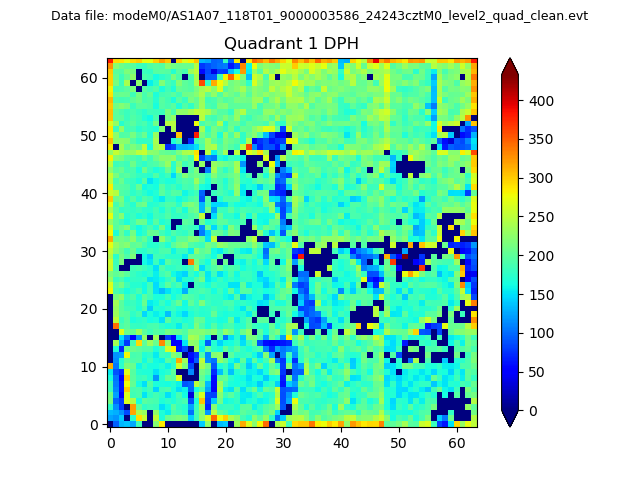 |
Quadrant B |
|---|---|---|---|
| Quadrant D | 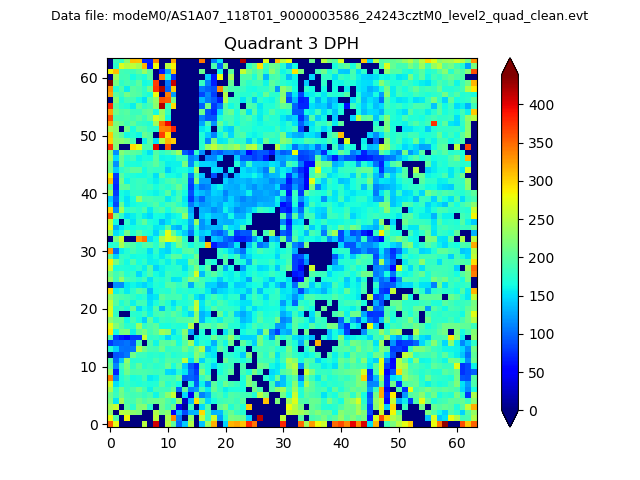 |
 |
Quadrant C |
| Plot type | Count rate plots | Images |
|---|---|---|
| Comparison with Poisson distribution Blue bars denote a histogram of data divided into 1 sec bins. Red curve is a Poisson curve with rate = median count rate of data. |
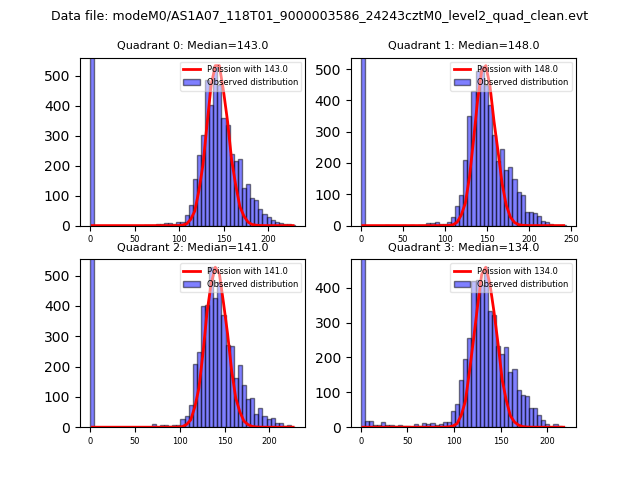 |
 |
| Quadrant-wise count rates Data is divided into 100 sec bins |
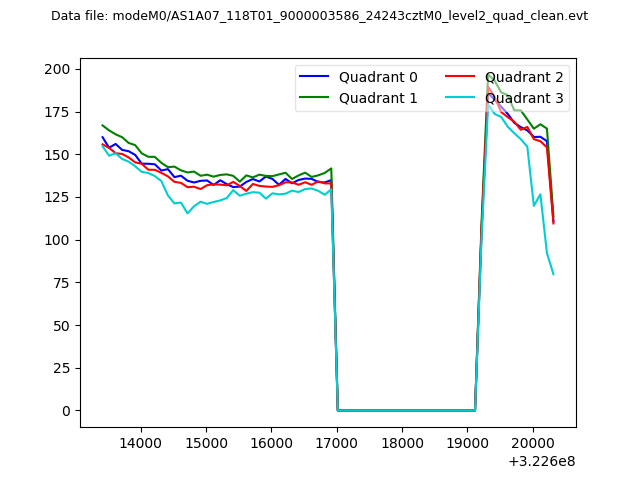 |
|
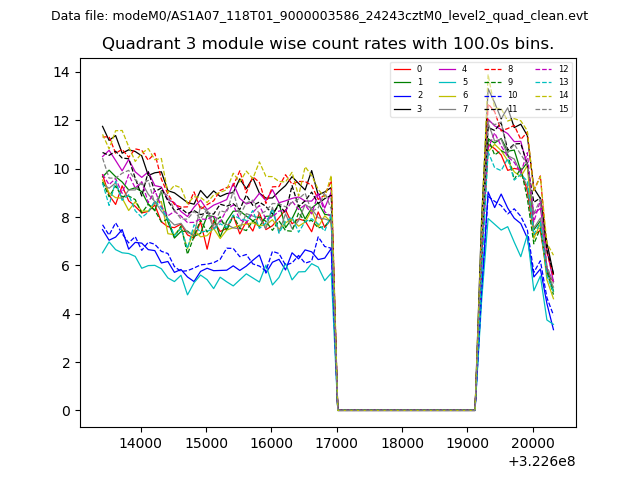
| Module-wise count rates for Quadrant A Data is divided into 100 sec bins |
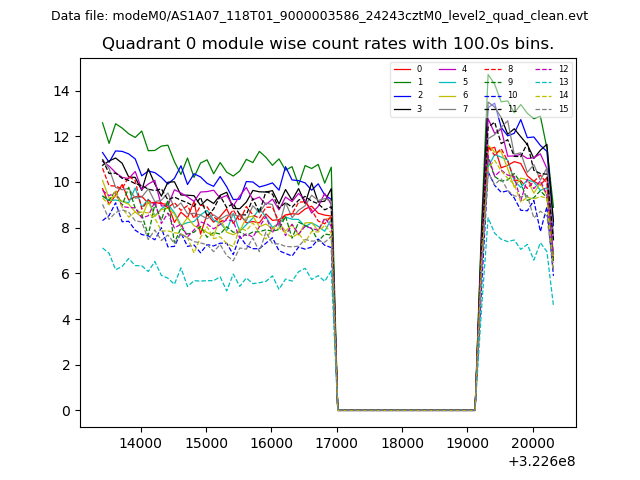 |
 |
| Module-wise count rates for Quadrant B Data is divided into 100 sec bins |
 |
 |
| Module-wise count rates for Quadrant C Data is divided into 100 sec bins |
 |
 |
| Module-wise count rates for Quadrant D Data is divided into 100 sec bins |
 |
 |
| Parameter | Plot |
|---|---|
| CZT HV Monitor |  |
| D_VDD | 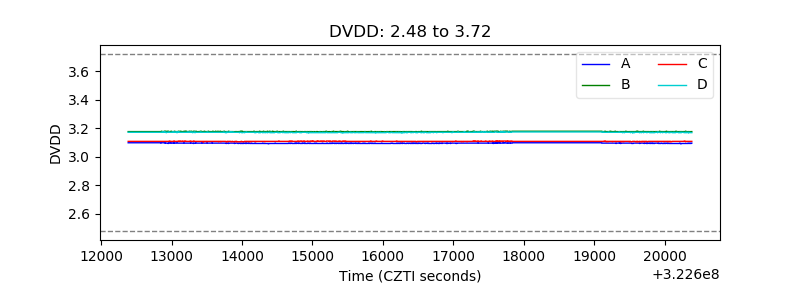 |
| Temperature 1 | 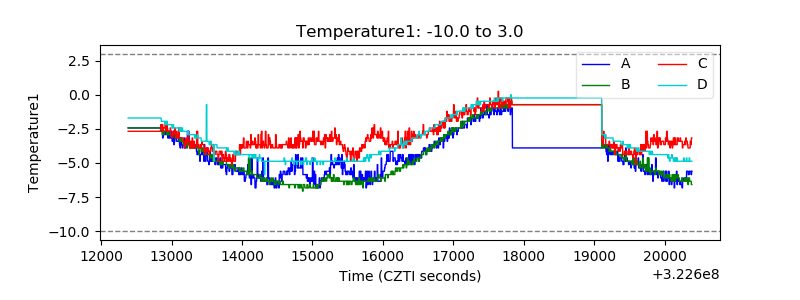 |
| Veto HV Monitor |  |
| Veto LLD | 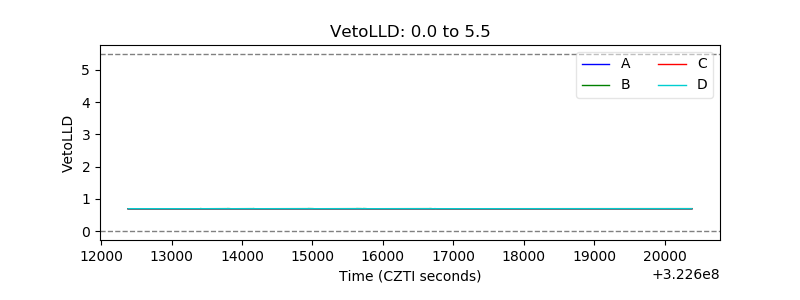 |
| Alpha Counter | 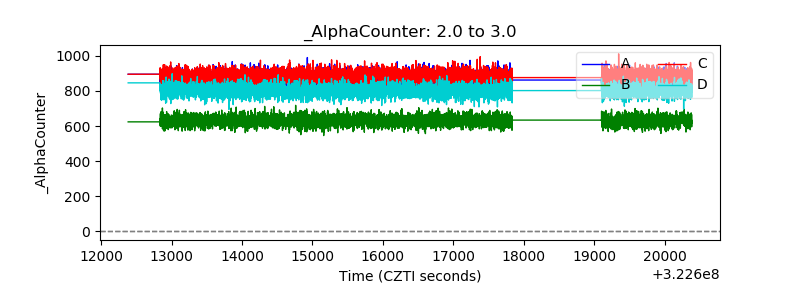 |
| _CPM_Rate | 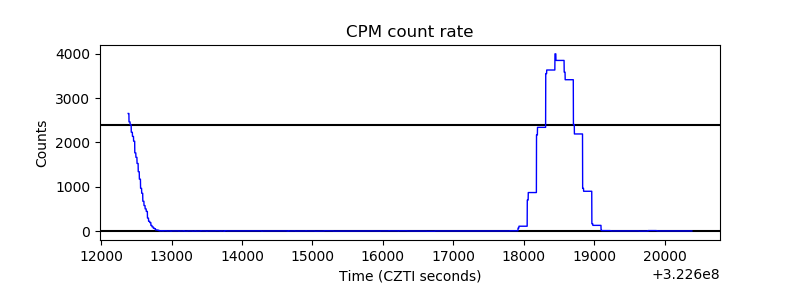 |
| CZT Counter | 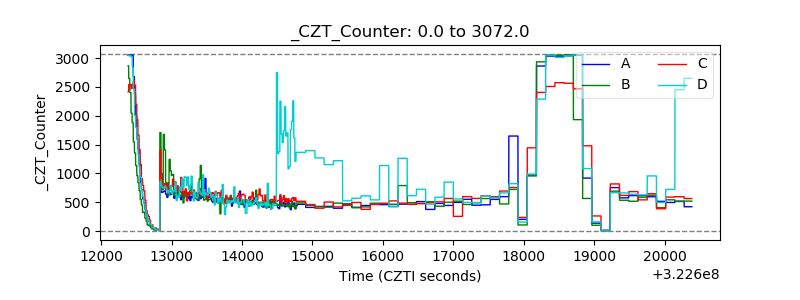 |
| +2.5 Volts monitor | 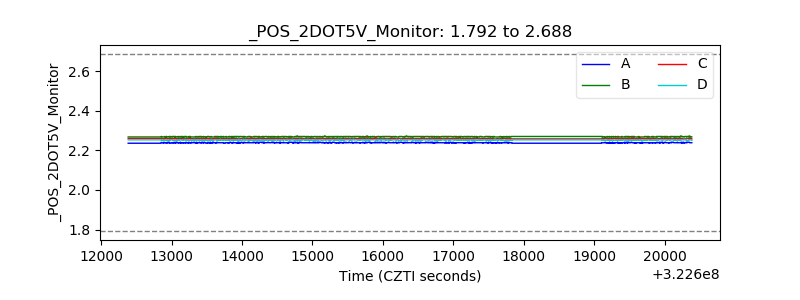 |
| +5 Volts monitor |  |
| _ROLL_ROT |  |
| _Roll_DEC | 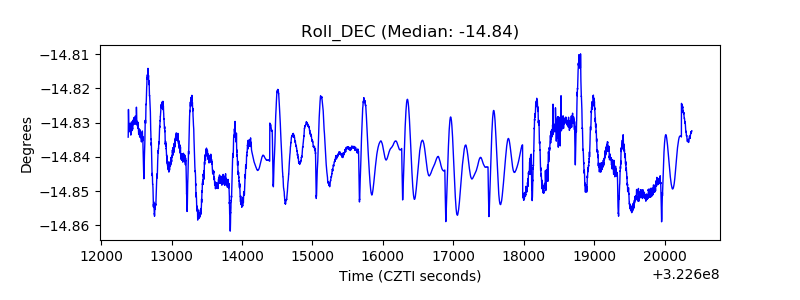 |
| _Roll_RA | 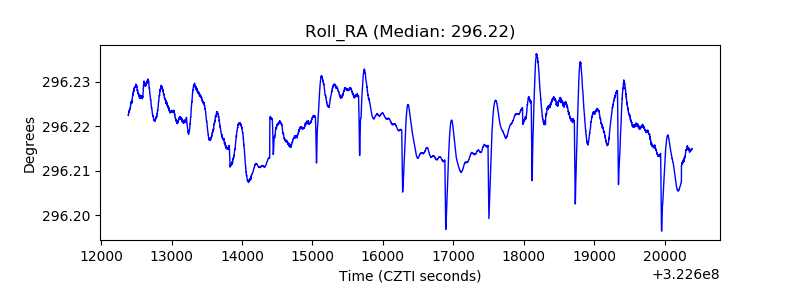 |
| Veto Counter |  |