| Param | Original file | Final file |
|---|---|---|
| Filename | modeM0/AS1A07_118T01_9000003586_24244cztM0_level2.evt | modeM0/AS1A07_118T01_9000003586_24244cztM0_level2_quad_clean.evt |
| Size (bytes) | 497,603,520 | 114,802,560 |
| Size | 474.6 MB | 109.5 MB |
| Events in quadrant A | 3,374,856 | 766,435 |
| Events in quadrant B | 3,345,939 | 799,361 |
| Events in quadrant C | 3,447,701 | 761,882 |
| Events in quadrant D | 4,481,485 | 716,994 |
| Mode M0 | |||
|---|---|---|---|
| Quadrant | BADHDUFLAG | Total packets | Discarded packets |
| A | 0 | 13904 | 2 |
| B | 0 | 13805 | 2 |
| C | 0 | 14108 | 2 |
| D | 0 | 17484 | 2 |
| Mode SS | |||
|---|---|---|---|
| Quadrant | BADHDUFLAG | Total packets | Discarded packets |
| A | 0 | 126 | 0 |
| B | 0 | 126 | 0 |
| C | 0 | 126 | 0 |
| D | 0 | 126 | 0 |
| Mode M9 | |||
|---|---|---|---|
| Quadrant | BADHDUFLAG | Total packets | Discarded packets |
| A | 0 | 20 | 0 |
| B | 0 | 21 | 0 |
| C | 0 | 21 | 0 |
| D | 0 | 21 | 0 |
| Quadrant | Total seconds | Saturated seconds | Saturation percentage |
|---|---|---|---|
| A | 6194 | 56 | 0.904101% |
| B | 6194 | 45 | 0.726510% |
| C | 6194 | 92 | 1.485308% |
| D | 6194 | 207 | 3.341944% |
Noise dominated data is calculated using 1-second bins in cleaned event files. If a bin has >2000 counts, and if more than 50% of those come from <1% of pixels, then it is considered to be noise-dominated and hence unusable.
| Quadrant | # 1 sec bins | Bins with >0 counts | Bins with >2000 counts | High rate bins dominated by noise | Noise dominated (total time) | Noise dominated (detector-on time) | Marked lightcurve |
|---|---|---|---|---|---|---|---|
| A | 7544 | 6195 | 19 | 19 | 0.25% | 0.31% | 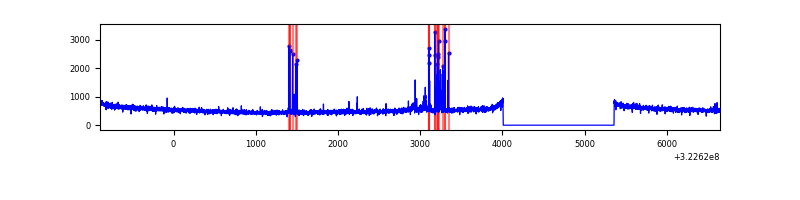 |
| B | 7544 | 6194 | 2 | 2 | 0.03% | 0.03% | 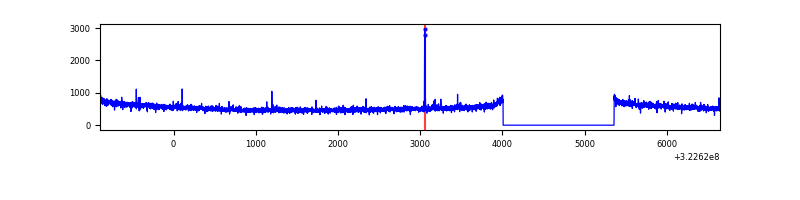 |
| C | 7544 | 6194 | 12 | 12 | 0.16% | 0.19% | 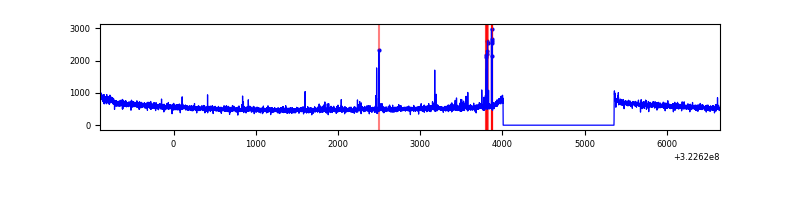 |
| D | 7544 | 6195 | 185 | 185 | 2.45% | 2.99% | 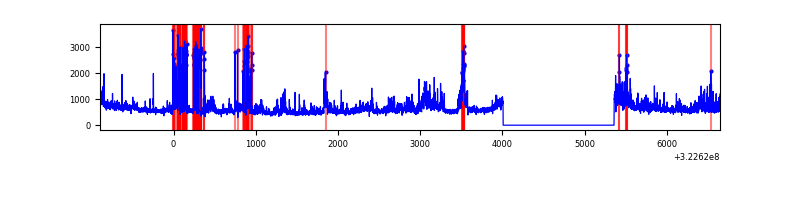 |
Top three noisy pixels from each quadrant. If the there are fewer than three noisy pixels in the level2.evt file, extra rows are filled as -1
| Pixel properties | Quadrant properties | ||||||
|---|---|---|---|---|---|---|---|
| Quadrant | DetID | PixID | Counts | Sigma | Mean | Median | Sigma |
| A | 6 | 16 | 135176 | 800.79 | 840 | 824 | 167.8 |
| A | 13 | 254 | 11002 | 60.66 | 840 | 824 | 167.8 |
| A | 0 | 226 | 7124 | 37.55 | 840 | 824 | 167.8 |
| B | 12 | 111 | 18445 | 111.87 | 850 | 832 | 157.4 |
| B | 11 | 111 | 15938 | 95.94 | 850 | 832 | 157.4 |
| B | 14 | 111 | 14129 | 84.45 | 850 | 832 | 157.4 |
| C | 14 | 238 | 131064 | 683.37 | 824 | 833 | 190.6 |
| C | 2 | 16 | 62362 | 322.87 | 824 | 833 | 190.6 |
| C | 7 | 247 | 28897 | 147.26 | 824 | 833 | 190.6 |
| D | 8 | 195 | 835087 | 4224.16 | 813 | 791 | 197.5 |
| D | 1 | 52 | 529442 | 2676.64 | 813 | 791 | 197.5 |
| D | 1 | 239 | 30383 | 149.83 | 813 | 791 | 197.5 |
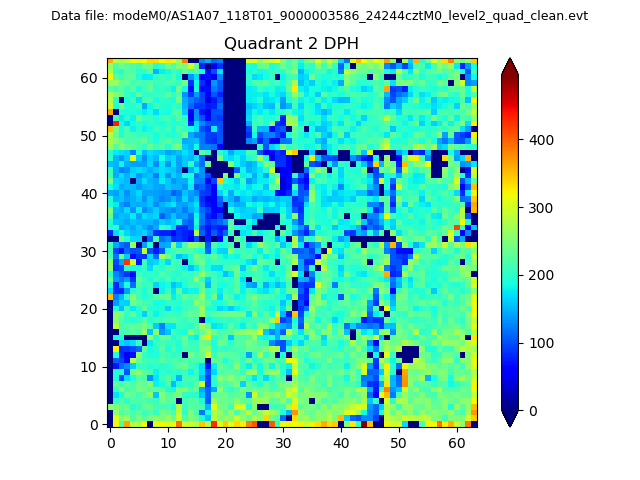
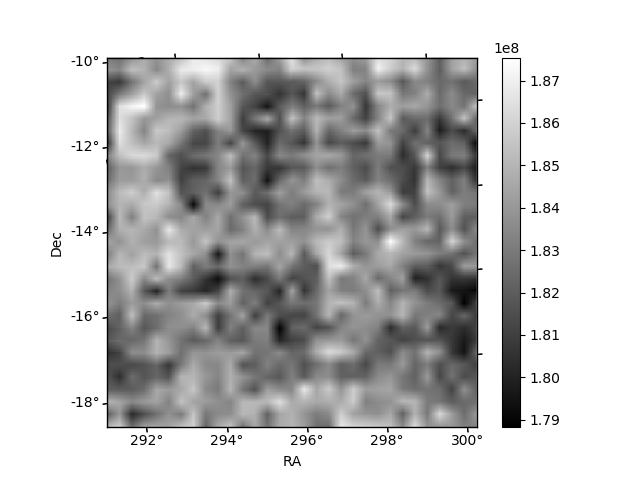
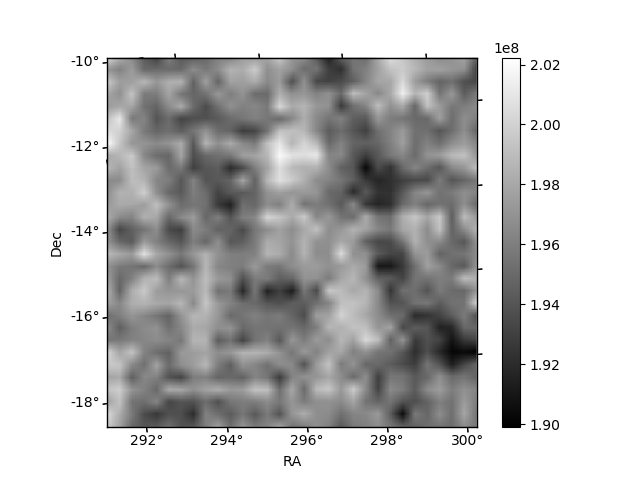
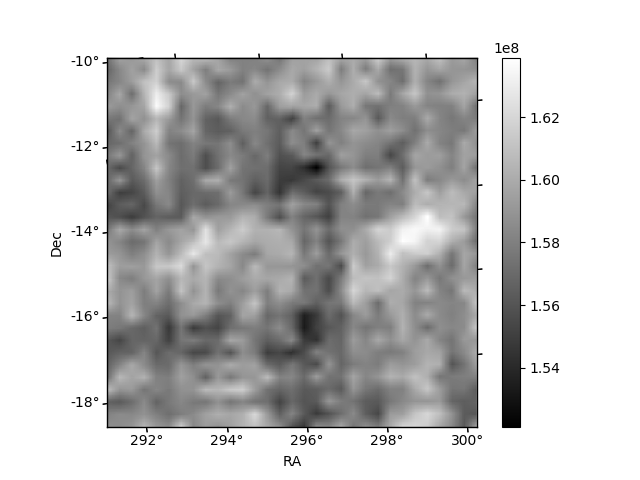
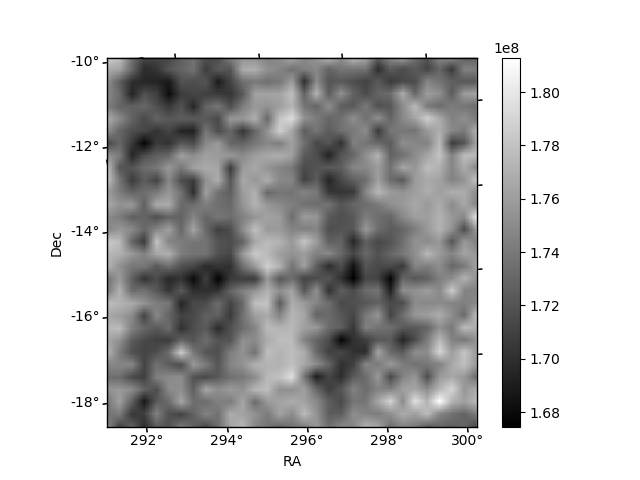
Histogram calculated using DETX and DETY for each event in the final _common_clean file
| Quadrant A | 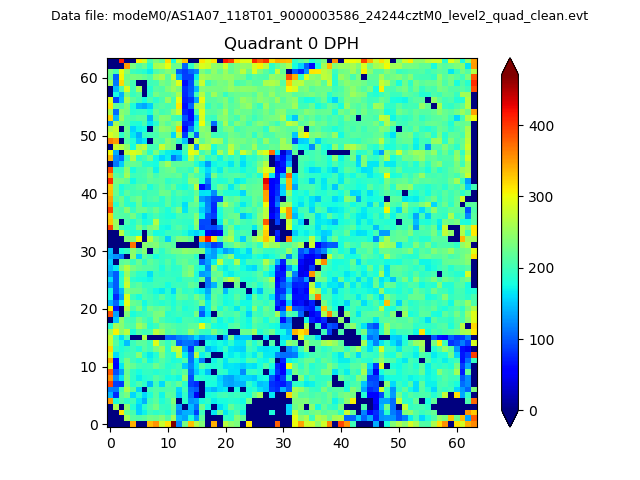 |
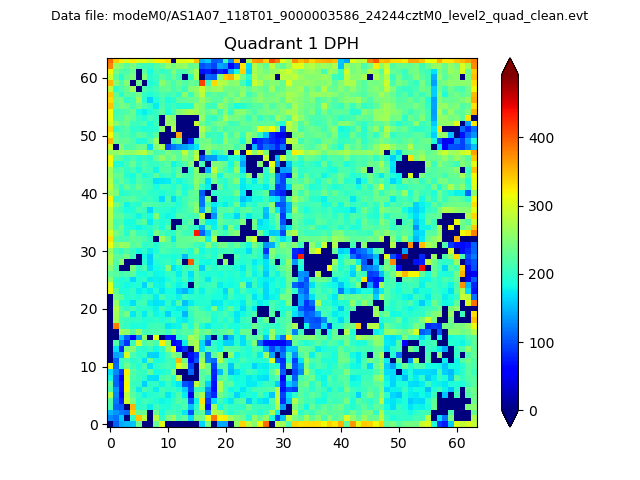 |
Quadrant B |
|---|---|---|---|
| Quadrant D | 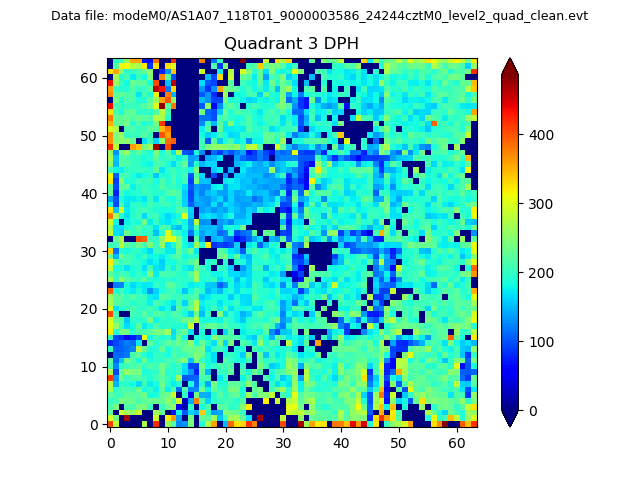 |
 |
Quadrant C |
| Plot type | Count rate plots | Images |
|---|---|---|
| Comparison with Poisson distribution Blue bars denote a histogram of data divided into 1 sec bins. Red curve is a Poisson curve with rate = median count rate of data. |
 |
 |
| Quadrant-wise count rates Data is divided into 100 sec bins |
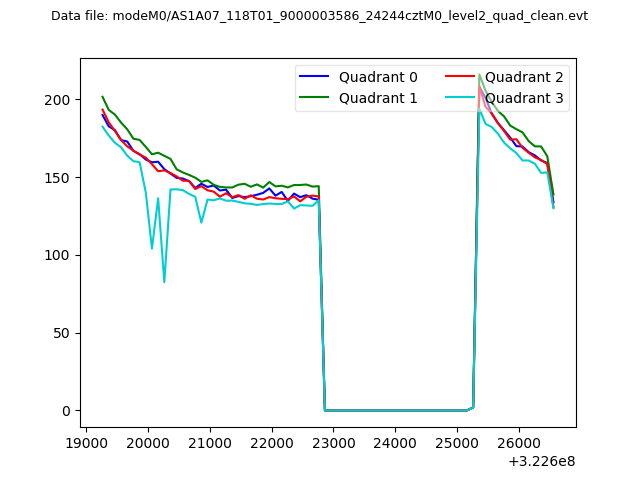 |
|
| Module-wise count rates for Quadrant A Data is divided into 100 sec bins |
 |
 |
| Module-wise count rates for Quadrant B Data is divided into 100 sec bins |
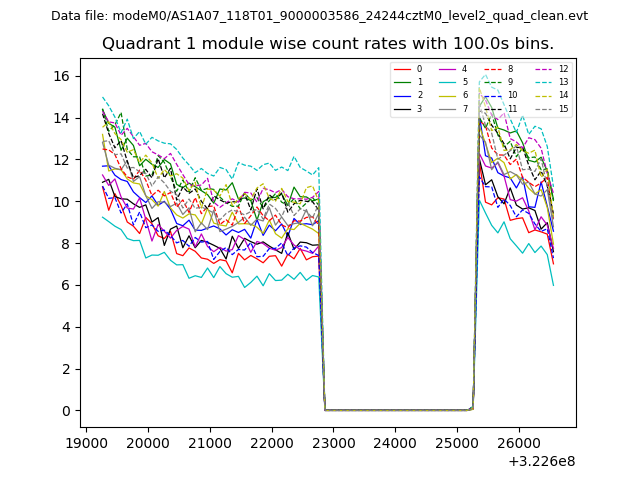 |
 |
| Module-wise count rates for Quadrant C Data is divided into 100 sec bins |
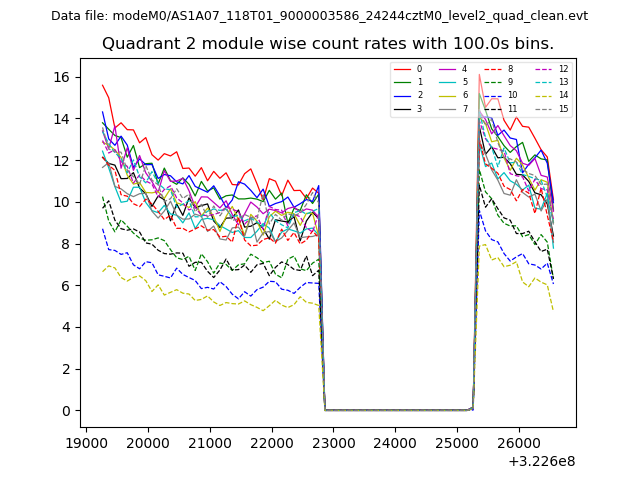 |
 |
| Module-wise count rates for Quadrant D Data is divided into 100 sec bins |
 |
 |
| Parameter | Plot |
|---|---|
| CZT HV Monitor | 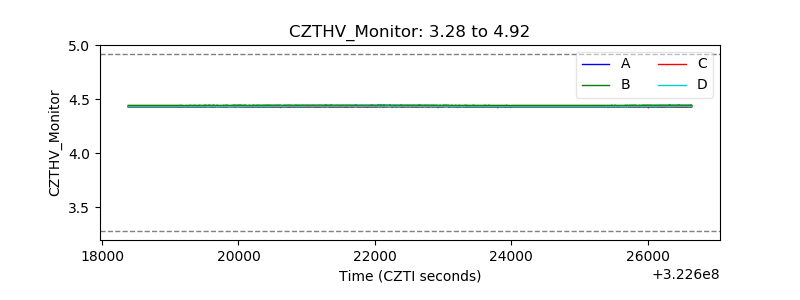 |
| D_VDD | 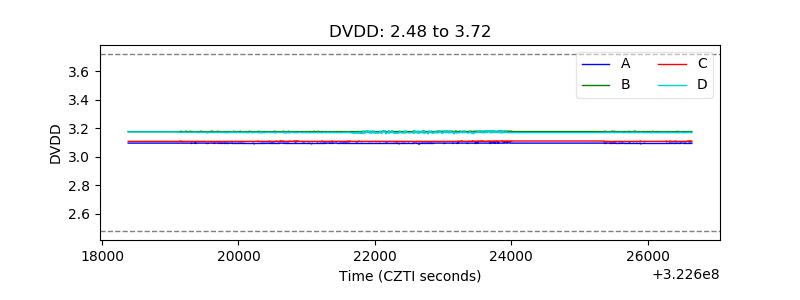 |
| Temperature 1 | 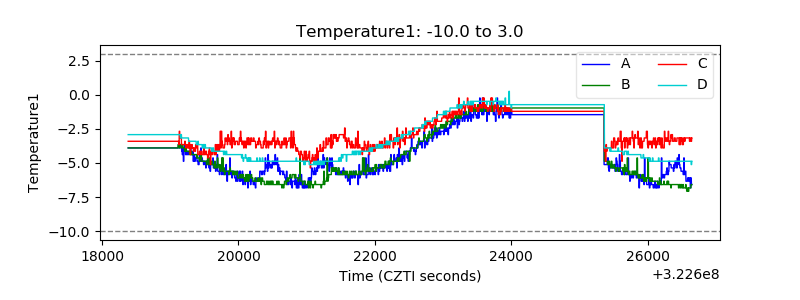 |
| Veto HV Monitor | 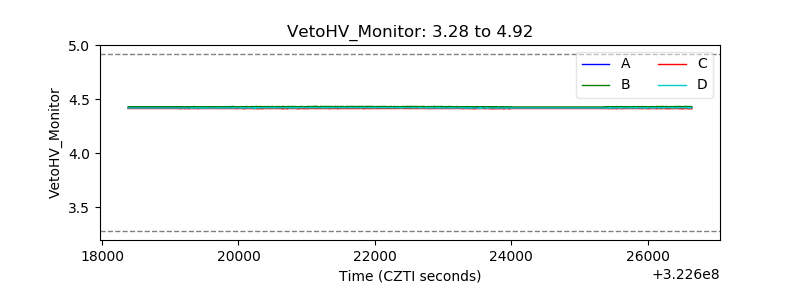 |
| Veto LLD | 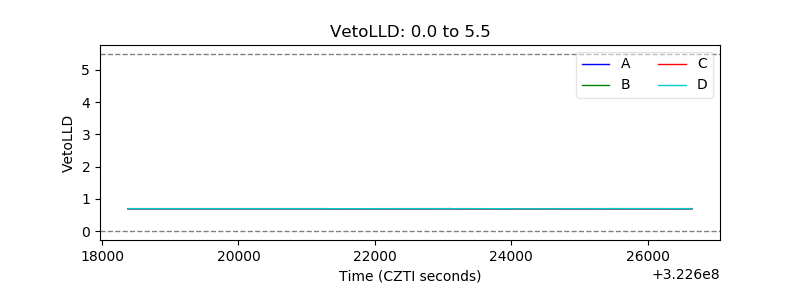 |
| Alpha Counter | 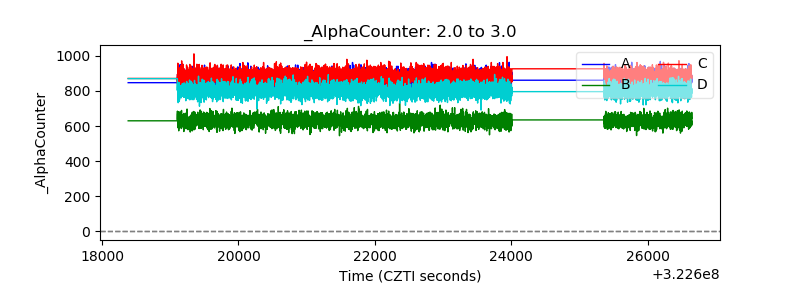 |
| _CPM_Rate | 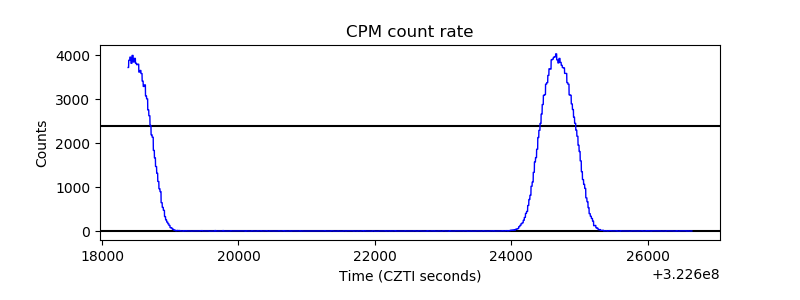 |
| CZT Counter |  |
| +2.5 Volts monitor |  |
| +5 Volts monitor | 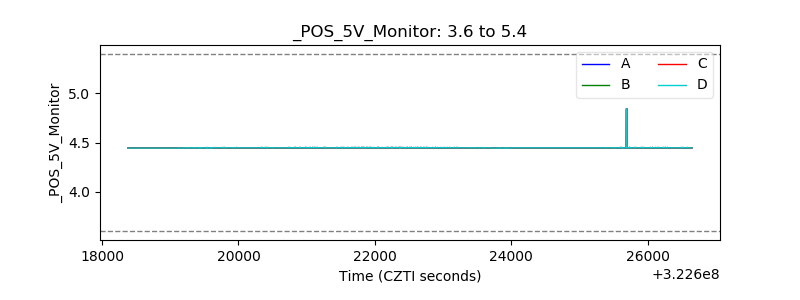 |
| _ROLL_ROT |  |
| _Roll_DEC |  |
| _Roll_RA |  |
| Veto Counter |  |