| Param | Original file | Final file |
|---|---|---|
| Filename | modeM0/AS1A07_118T01_9000003586_24246cztM0_level2.evt | modeM0/AS1A07_118T01_9000003586_24246cztM0_level2_quad_clean.evt |
| Size (bytes) | 481,728,960 | 101,603,520 |
| Size | 459.4 MB | 96.9 MB |
| Events in quadrant A | 3,372,101 | 660,243 |
| Events in quadrant B | 3,542,662 | 687,784 |
| Events in quadrant C | 3,656,746 | 655,961 |
| Events in quadrant D | 3,595,584 | 638,954 |
| Mode M0 | |||
|---|---|---|---|
| Quadrant | BADHDUFLAG | Total packets | Discarded packets |
| A | 0 | 13752 | 2 |
| B | 0 | 14403 | 2 |
| C | 0 | 14598 | 2 |
| D | 0 | 14711 | 2 |
| Mode SS | |||
|---|---|---|---|
| Quadrant | BADHDUFLAG | Total packets | Discarded packets |
| A | 0 | 126 | 0 |
| B | 0 | 126 | 0 |
| C | 0 | 126 | 0 |
| D | 0 | 126 | 0 |
| Mode M9 | |||
|---|---|---|---|
| Quadrant | BADHDUFLAG | Total packets | Discarded packets |
| A | 0 | 17 | 0 |
| B | 0 | 18 | 0 |
| C | 0 | 18 | 0 |
| D | 0 | 18 | 0 |
| Quadrant | Total seconds | Saturated seconds | Saturation percentage |
|---|---|---|---|
| A | 6222 | 74 | 1.189328% |
| B | 6222 | 114 | 1.832208% |
| C | 6222 | 146 | 2.346512% |
| D | 6222 | 13 | 0.208936% |
Noise dominated data is calculated using 1-second bins in cleaned event files. If a bin has >2000 counts, and if more than 50% of those come from <1% of pixels, then it is considered to be noise-dominated and hence unusable.
| Quadrant | # 1 sec bins | Bins with >0 counts | Bins with >2000 counts | High rate bins dominated by noise | Noise dominated (total time) | Noise dominated (detector-on time) | Marked lightcurve |
|---|---|---|---|---|---|---|---|
| A | 7572 | 6223 | 44 | 44 | 0.58% | 0.71% | 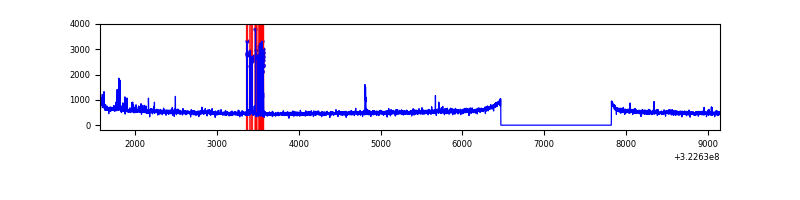 |
| B | 7572 | 6223 | 20 | 20 | 0.26% | 0.32% | 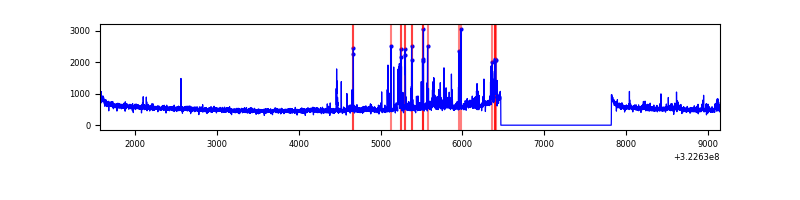 |
| C | 7572 | 6223 | 11 | 11 | 0.15% | 0.18% | 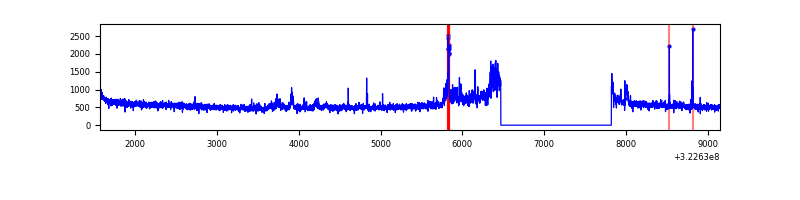 |
| D | 7572 | 6223 | 2 | 2 | 0.03% | 0.03% | 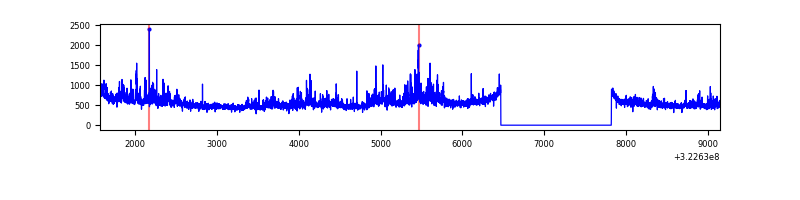 |
Top three noisy pixels from each quadrant. If the there are fewer than three noisy pixels in the level2.evt file, extra rows are filled as -1
| Pixel properties | Quadrant properties | ||||||
|---|---|---|---|---|---|---|---|
| Quadrant | DetID | PixID | Counts | Sigma | Mean | Median | Sigma |
| A | 6 | 16 | 182194 | 1100.91 | 827 | 813 | 164.8 |
| A | 13 | 254 | 8800 | 48.48 | 827 | 813 | 164.8 |
| A | 0 | 226 | 7135 | 38.37 | 827 | 813 | 164.8 |
| B | 12 | 17 | 103502 | 663.59 | 832 | 813 | 154.7 |
| B | 15 | 33 | 89755 | 574.76 | 832 | 813 | 154.7 |
| B | 0 | 245 | 56867 | 362.23 | 832 | 813 | 154.7 |
| C | 7 | 247 | 355053 | 1896.3 | 805 | 814 | 186.8 |
| C | 14 | 238 | 128871 | 685.51 | 805 | 814 | 186.8 |
| C | 2 | 16 | 27612 | 143.45 | 805 | 814 | 186.8 |
| D | 8 | 195 | 486987 | 2438.36 | 818 | 795 | 199.4 |
| D | 2 | 234 | 24151 | 117.13 | 818 | 795 | 199.4 |
| D | 12 | 233 | 12273 | 57.56 | 818 | 795 | 199.4 |
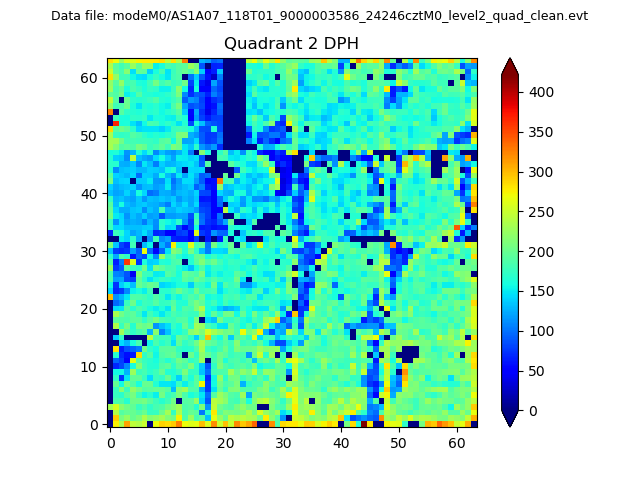
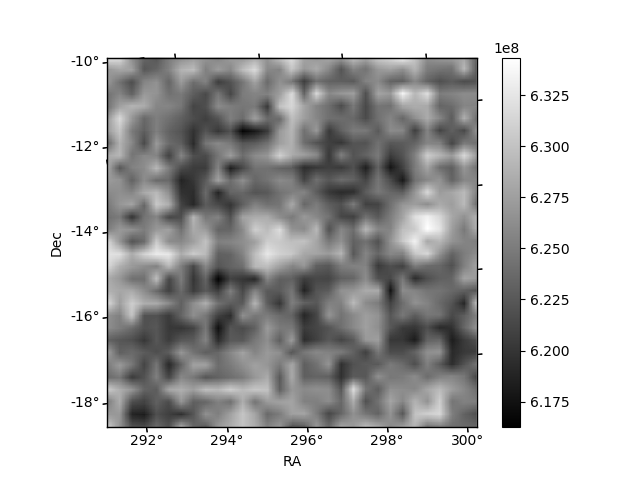
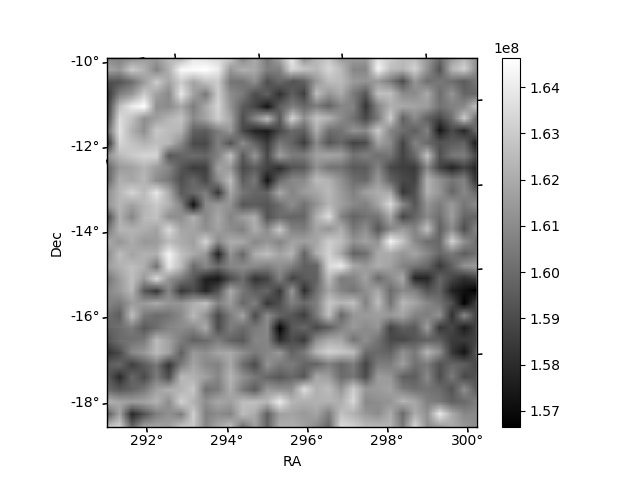
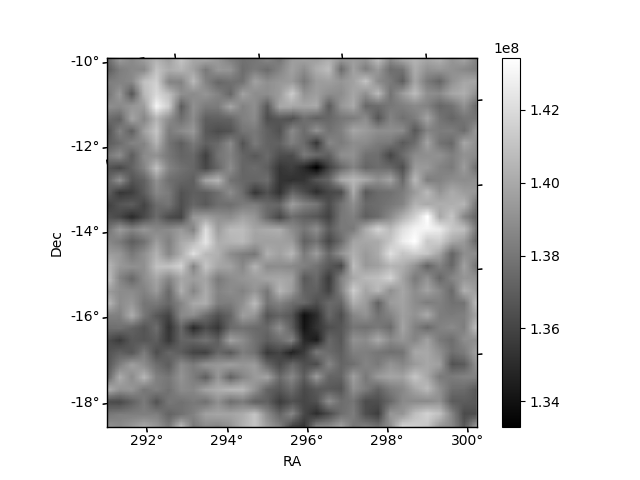
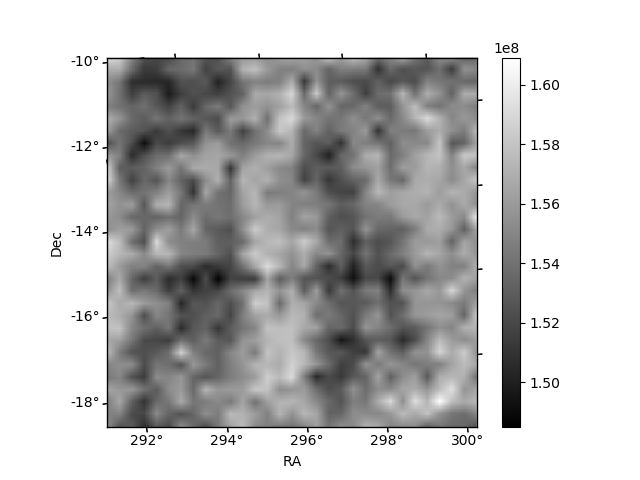
Histogram calculated using DETX and DETY for each event in the final _common_clean file
| Quadrant A | 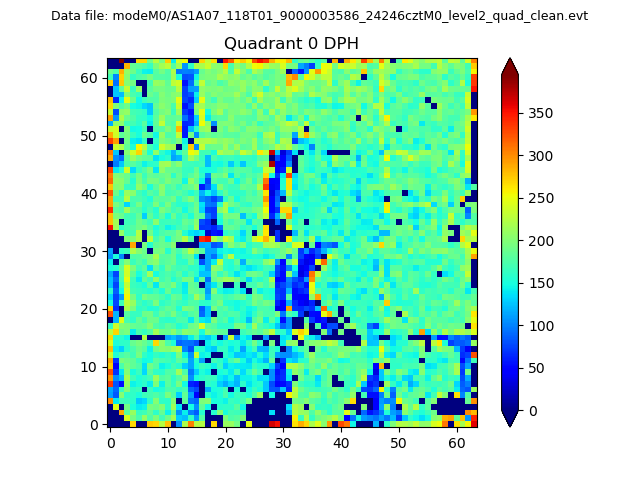 |
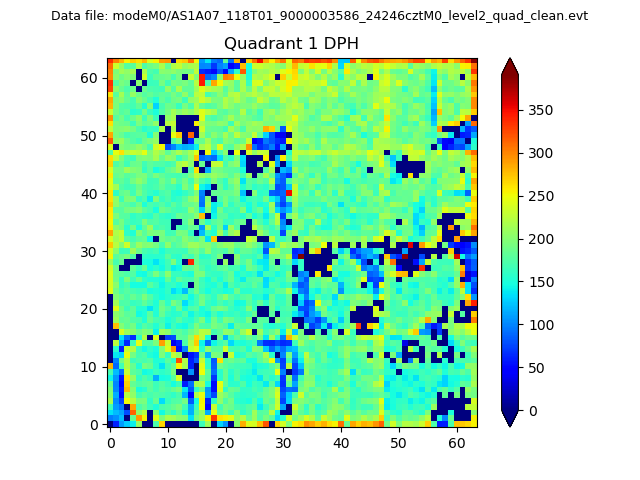 |
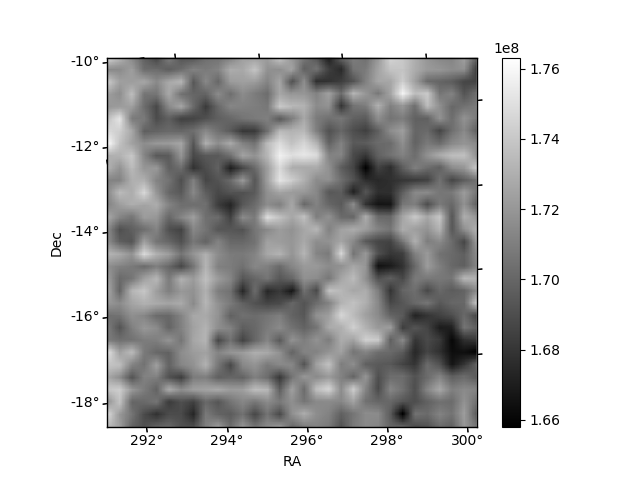
Quadrant B |
|---|---|---|---|
| Quadrant D | 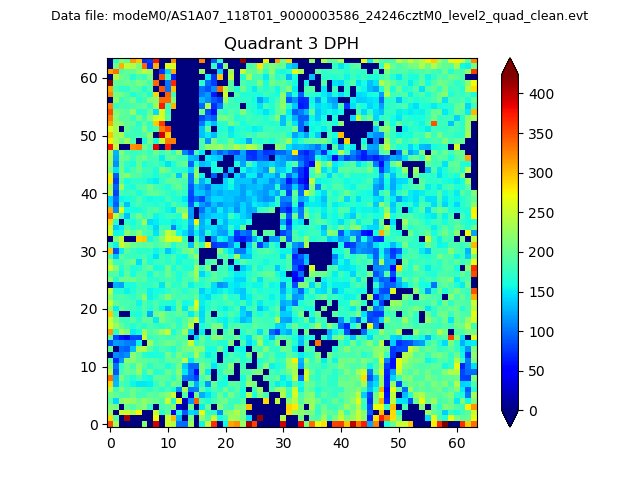 |
 |
Quadrant C |
| Plot type | Count rate plots | Images |
|---|---|---|
| Comparison with Poisson distribution Blue bars denote a histogram of data divided into 1 sec bins. Red curve is a Poisson curve with rate = median count rate of data. |
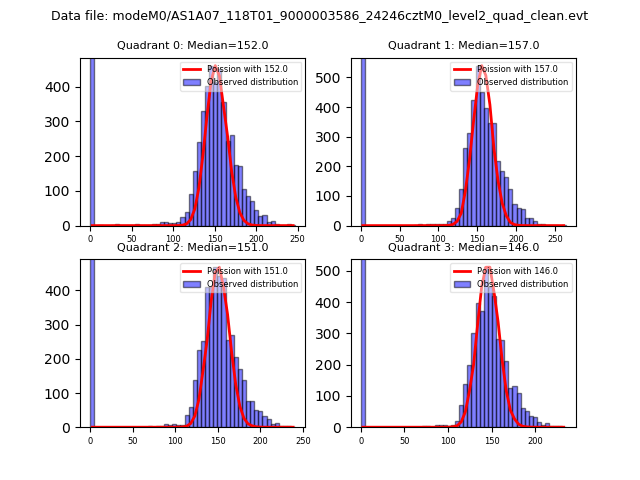 |
 |
| Quadrant-wise count rates Data is divided into 100 sec bins |
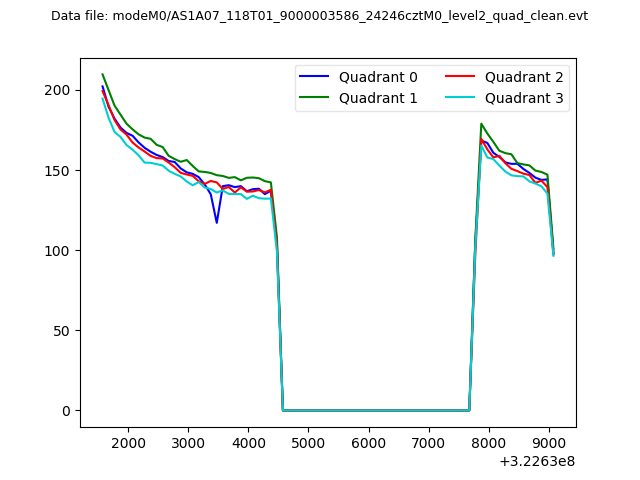 |
|
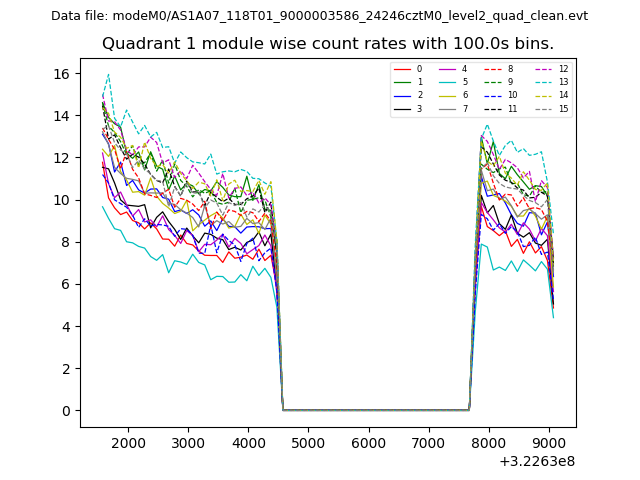
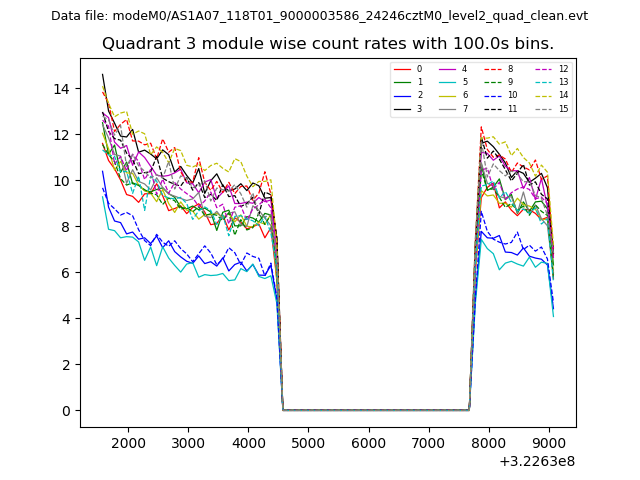
| Module-wise count rates for Quadrant A Data is divided into 100 sec bins |
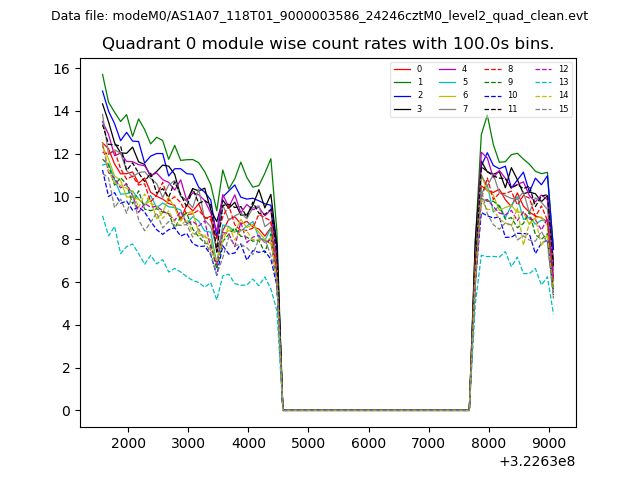 |
 |
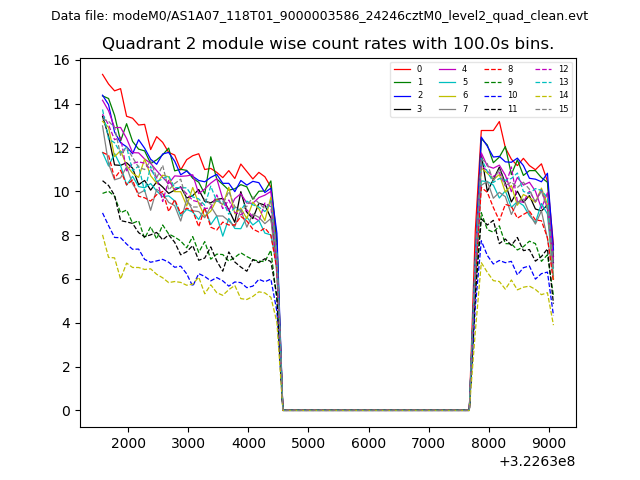
| Module-wise count rates for Quadrant B Data is divided into 100 sec bins |
 |
 |
| Module-wise count rates for Quadrant C Data is divided into 100 sec bins |
 |
 |
| Module-wise count rates for Quadrant D Data is divided into 100 sec bins |
 |
 |
| Parameter | Plot |
|---|---|
| CZT HV Monitor | 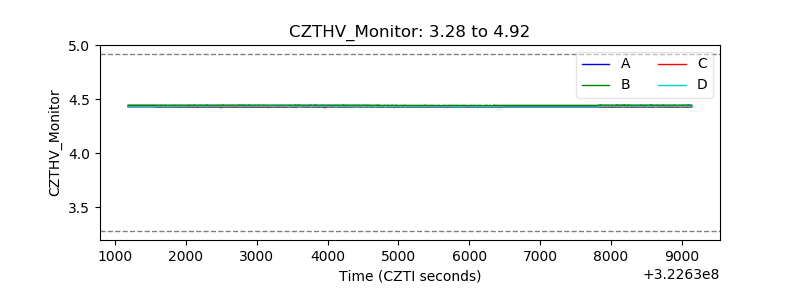 |
| D_VDD | 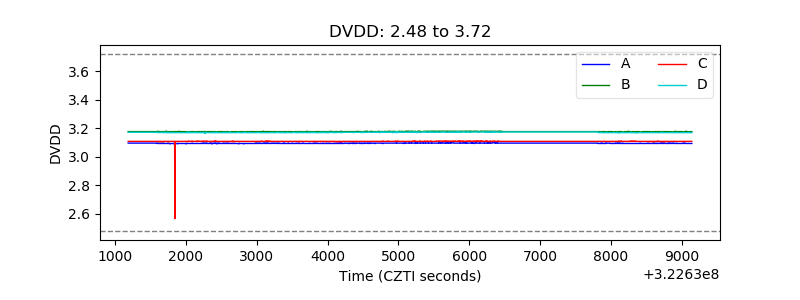 |
| Temperature 1 | 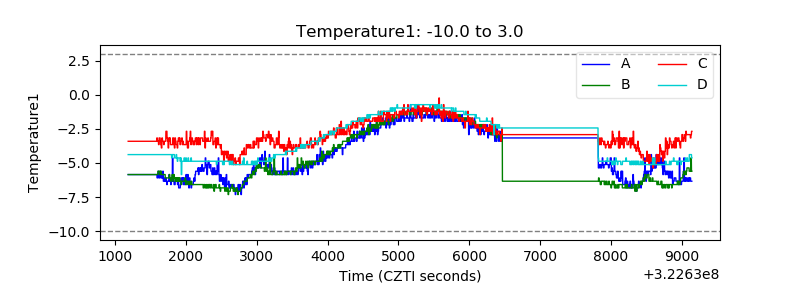 |
| Veto HV Monitor | 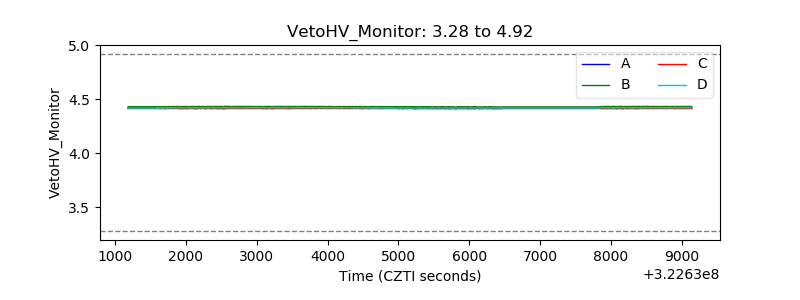 |
| Veto LLD | 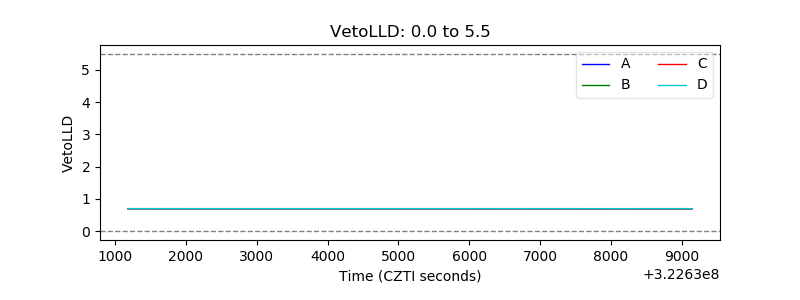 |
| Alpha Counter | 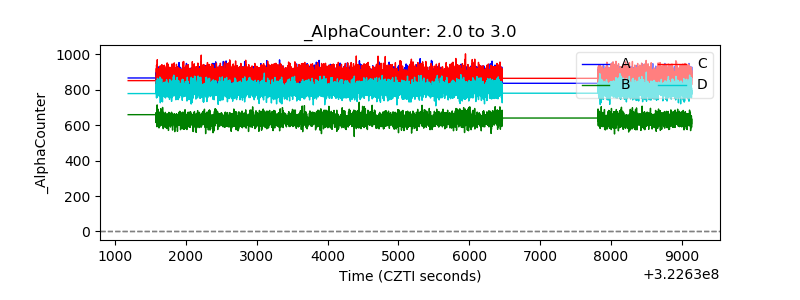 |
| _CPM_Rate | 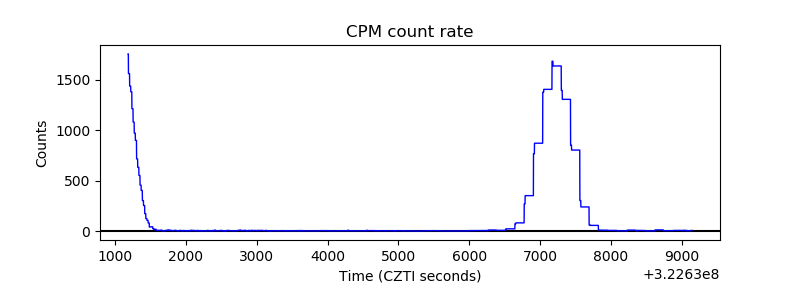 |
| CZT Counter | 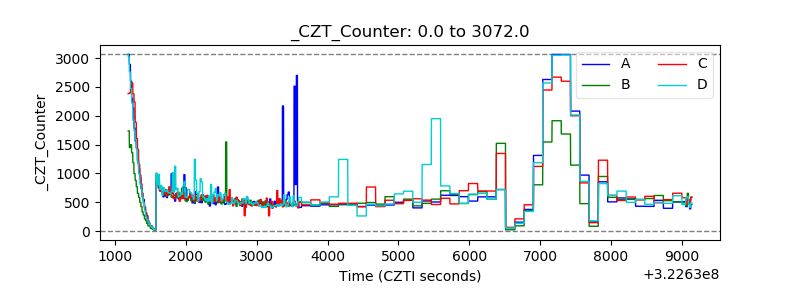 |
| +2.5 Volts monitor |  |
| +5 Volts monitor |  |
| _ROLL_ROT | 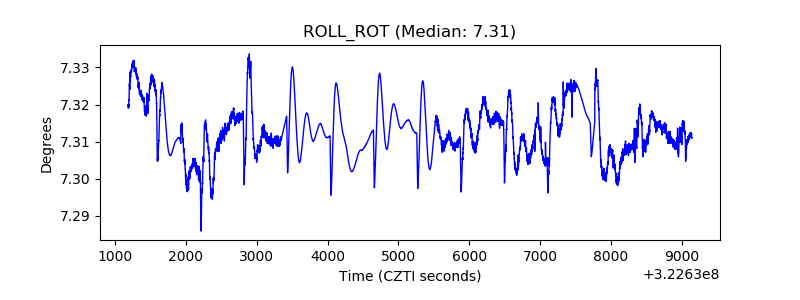 |
| _Roll_DEC | 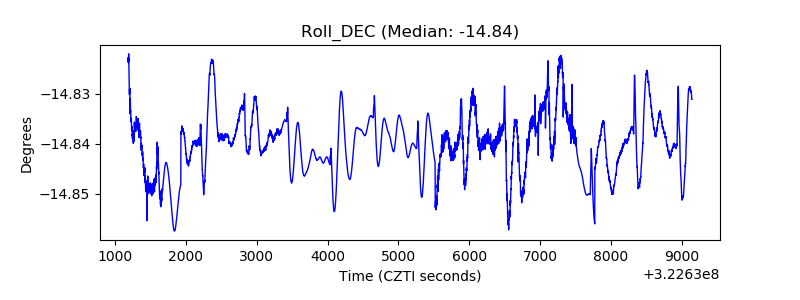 |
| _Roll_RA | 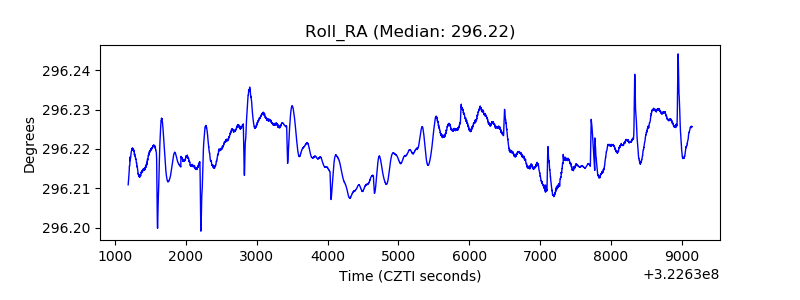 |
| Veto Counter | 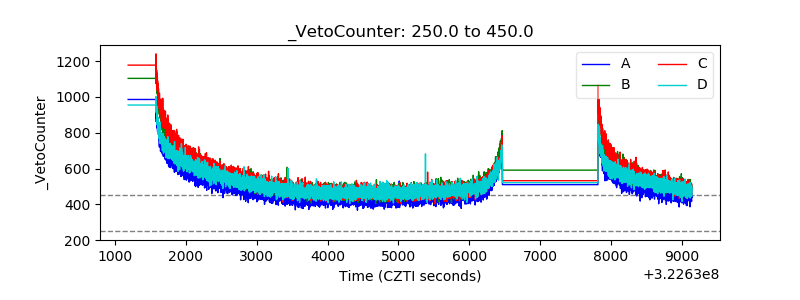 |