| Param | Original file | Final file |
|---|---|---|
| Filename | modeM0/AS1A07_118T01_9000003586_24247cztM0_level2.evt | modeM0/AS1A07_118T01_9000003586_24247cztM0_level2_quad_clean.evt |
| Size (bytes) | 524,721,600 | 93,833,280 |
| Size | 500.4 MB | 89.5 MB |
| Events in quadrant A | 3,297,892 | 606,351 |
| Events in quadrant B | 3,566,032 | 623,174 |
| Events in quadrant C | 4,045,245 | 592,211 |
| Events in quadrant D | 4,537,539 | 562,909 |
| Mode M0 | |||
|---|---|---|---|
| Quadrant | BADHDUFLAG | Total packets | Discarded packets |
| A | 0 | 13876 | 1 |
| B | 0 | 14651 | 1 |
| C | 0 | 16072 | 1 |
| D | 0 | 17611 | 1 |
| Mode SS | |||
|---|---|---|---|
| Quadrant | BADHDUFLAG | Total packets | Discarded packets |
| A | 0 | 132 | 0 |
| B | 0 | 132 | 0 |
| C | 0 | 132 | 0 |
| D | 0 | 132 | 0 |
| Mode M9 | |||
|---|---|---|---|
| Quadrant | BADHDUFLAG | Total packets | Discarded packets |
| A | 0 | 11 | 0 |
| B | 0 | 11 | 0 |
| C | 0 | 11 | 0 |
| D | 0 | 11 | 0 |
| Quadrant | Total seconds | Saturated seconds | Saturation percentage |
|---|---|---|---|
| A | 6556 | 77 | 1.174497% |
| B | 6556 | 142 | 2.165955% |
| C | 6556 | 183 | 2.791336% |
| D | 6556 | 473 | 7.214765% |
Noise dominated data is calculated using 1-second bins in cleaned event files. If a bin has >2000 counts, and if more than 50% of those come from <1% of pixels, then it is considered to be noise-dominated and hence unusable.
| Quadrant | # 1 sec bins | Bins with >0 counts | Bins with >2000 counts | High rate bins dominated by noise | Noise dominated (total time) | Noise dominated (detector-on time) | Marked lightcurve |
|---|---|---|---|---|---|---|---|
| A | 7641 | 6556 | 11 | 11 | 0.14% | 0.17% | 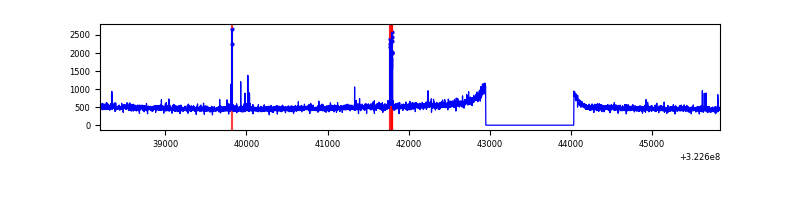 |
| B | 7641 | 6556 | 48 | 48 | 0.63% | 0.73% | 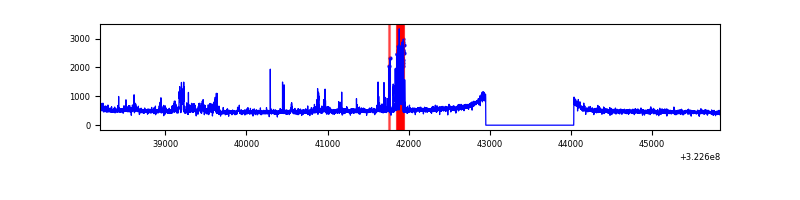 |
| C | 7641 | 6556 | 57 | 57 | 0.75% | 0.87% | 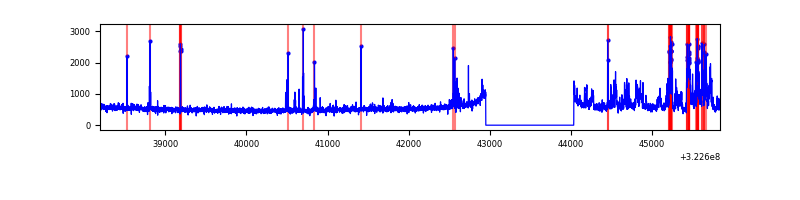 |
| D | 7641 | 6556 | 367 | 367 | 4.80% | 5.60% | 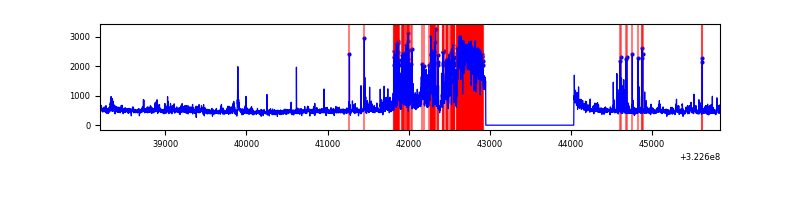 |
Top three noisy pixels from each quadrant. If the there are fewer than three noisy pixels in the level2.evt file, extra rows are filled as -1
| Pixel properties | Quadrant properties | ||||||
|---|---|---|---|---|---|---|---|
| Quadrant | DetID | PixID | Counts | Sigma | Mean | Median | Sigma |
| A | 6 | 16 | 37446 | 216.37 | 839 | 822 | 169.3 |
| A | 12 | 96 | 22022 | 125.25 | 839 | 822 | 169.3 |
| A | 13 | 254 | 10027 | 54.38 | 839 | 822 | 169.3 |
| B | 0 | 245 | 162622 | 1022.84 | 833 | 815 | 158.2 |
| B | 0 | 230 | 85635 | 536.18 | 833 | 815 | 158.2 |
| B | 4 | 171 | 24071 | 147.01 | 833 | 815 | 158.2 |
| C | 7 | 247 | 573476 | 3019.6 | 809 | 817 | 189.6 |
| C | 2 | 16 | 190180 | 998.5 | 809 | 817 | 189.6 |
| C | 14 | 238 | 126798 | 664.29 | 809 | 817 | 189.6 |
| D | 12 | 233 | 924765 | 4766.95 | 795 | 773 | 193.8 |
| D | 8 | 195 | 396040 | 2039.22 | 795 | 773 | 193.8 |
| D | 1 | 52 | 173288 | 890.02 | 795 | 773 | 193.8 |
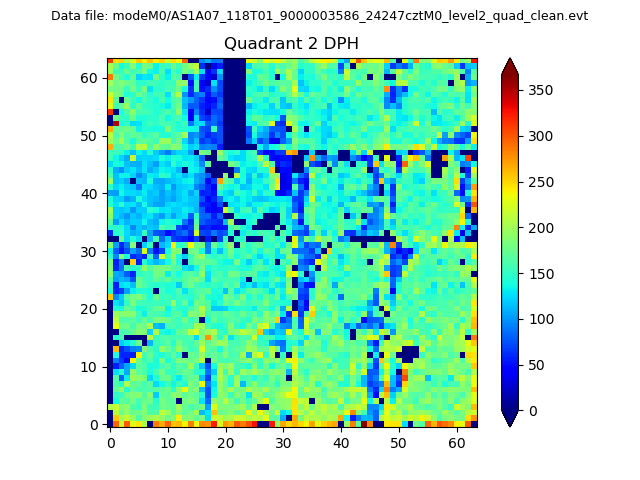
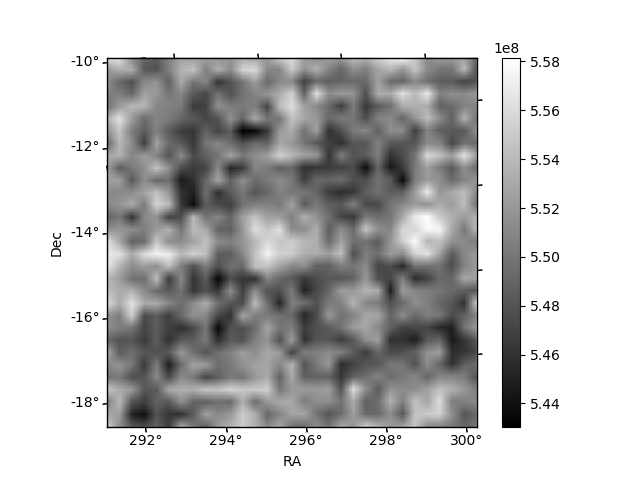
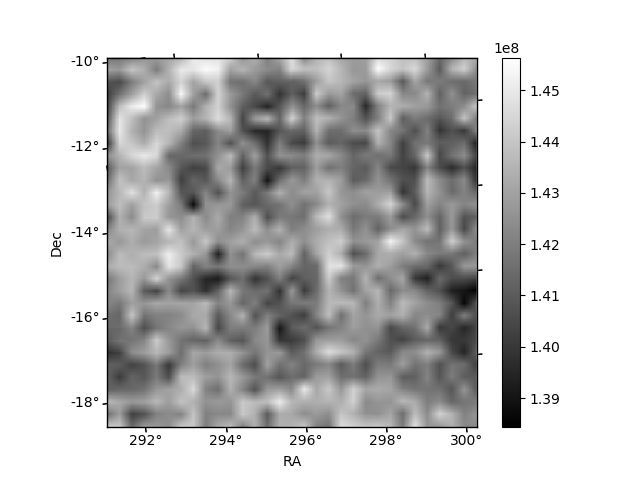
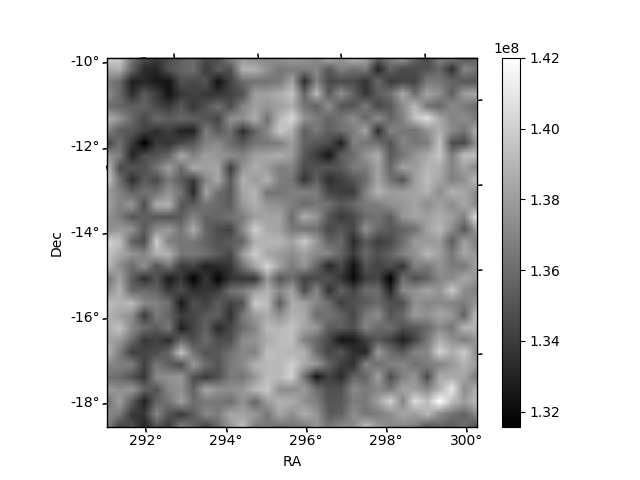
Histogram calculated using DETX and DETY for each event in the final _common_clean file
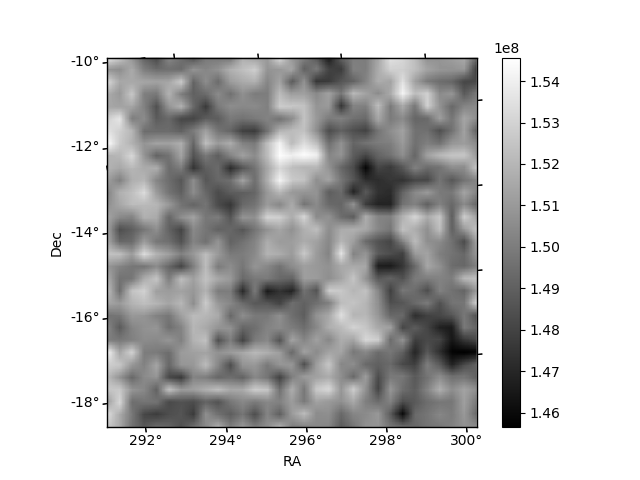
| Quadrant A | 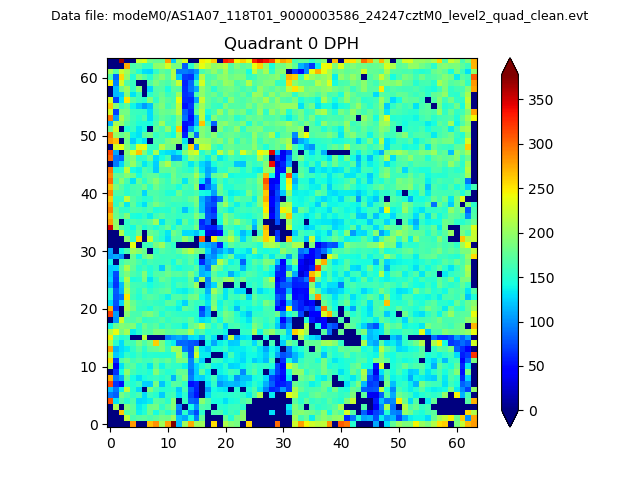 |
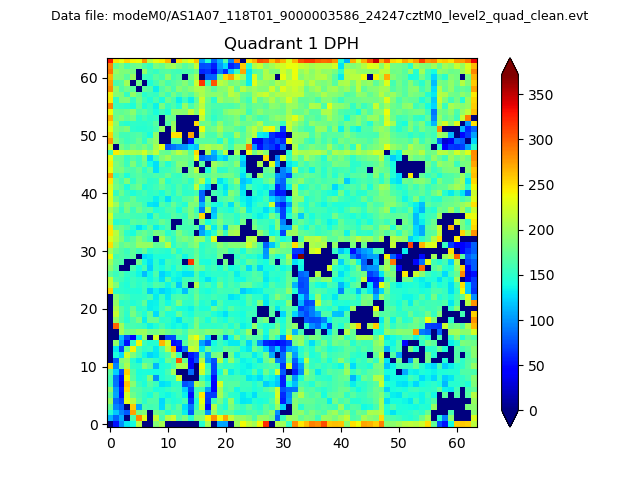 |
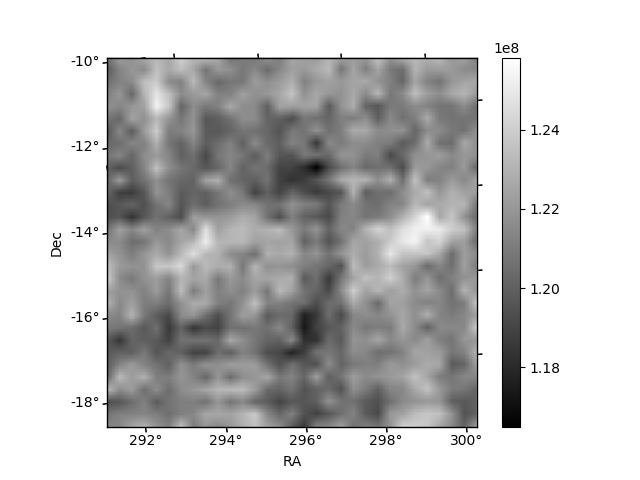
Quadrant B |
|---|---|---|---|
| Quadrant D | 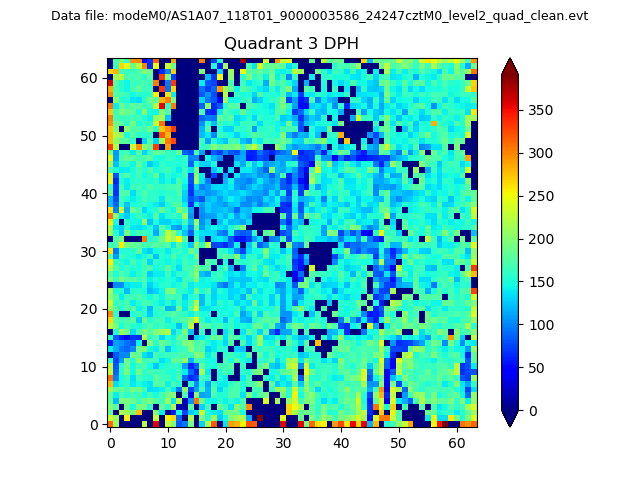 |
 |
Quadrant C |
| Plot type | Count rate plots | Images |
|---|---|---|
| Comparison with Poisson distribution Blue bars denote a histogram of data divided into 1 sec bins. Red curve is a Poisson curve with rate = median count rate of data. |
 |
 |
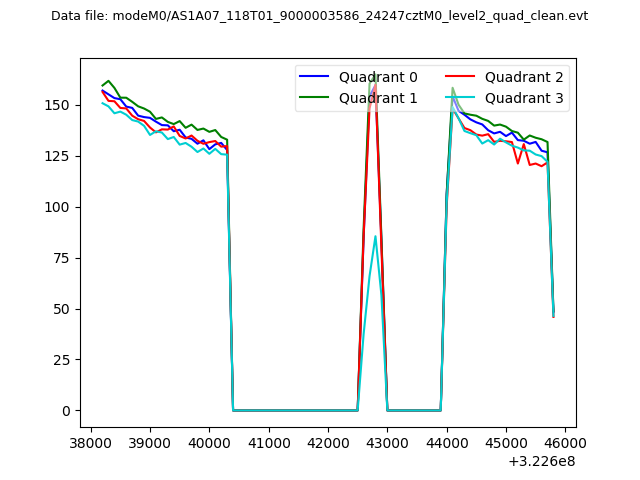
| Quadrant-wise count rates Data is divided into 100 sec bins |
 |
|
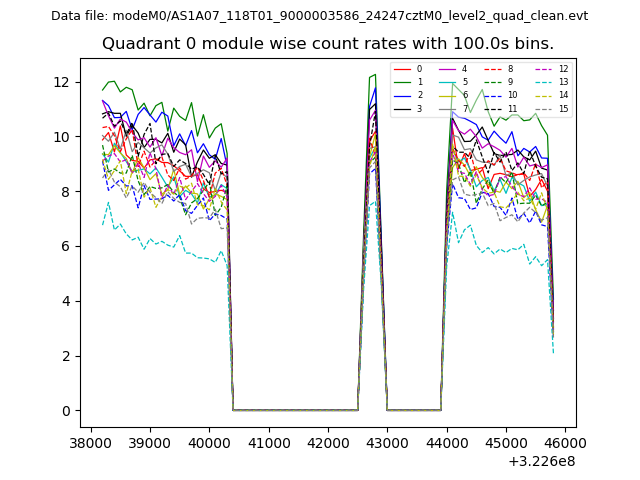
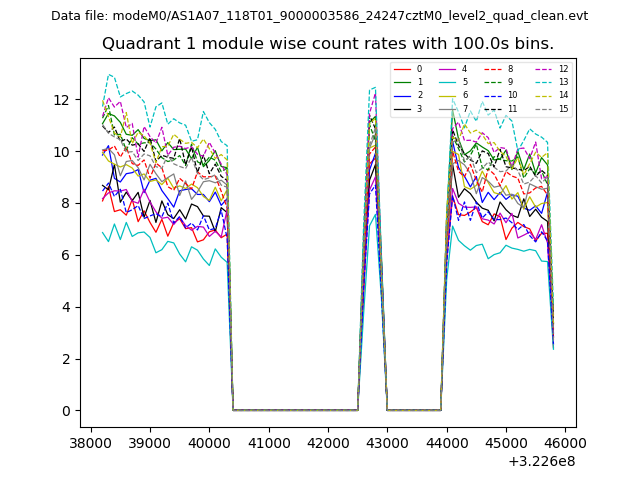
| Module-wise count rates for Quadrant A Data is divided into 100 sec bins |
 |
 |
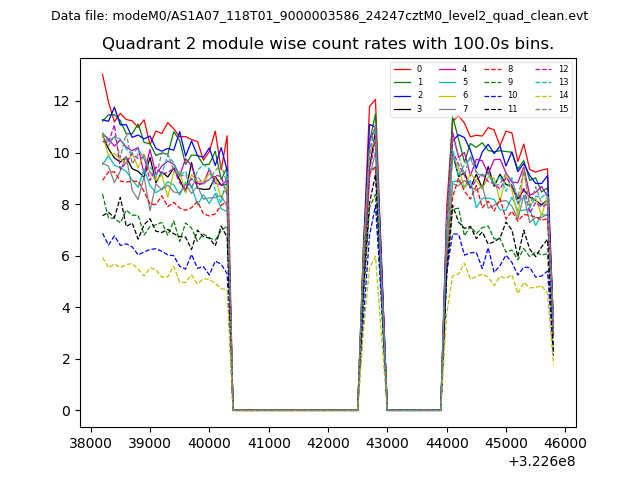
| Module-wise count rates for Quadrant B Data is divided into 100 sec bins |
 |
 |
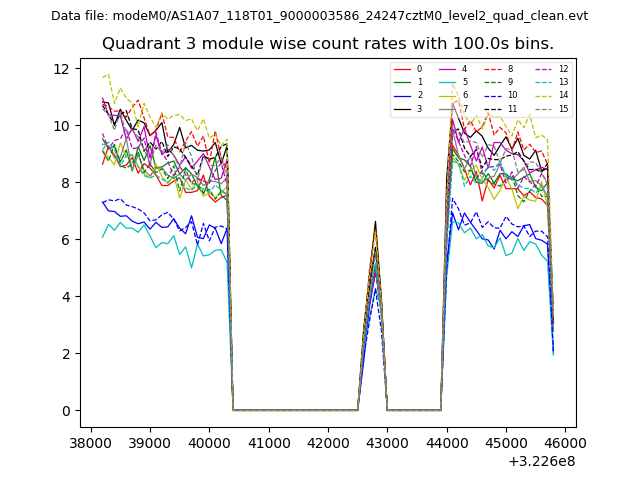
| Module-wise count rates for Quadrant C Data is divided into 100 sec bins |
 |
 |
| Module-wise count rates for Quadrant D Data is divided into 100 sec bins |
 |
 |
| Parameter | Plot |
|---|---|
| CZT HV Monitor | 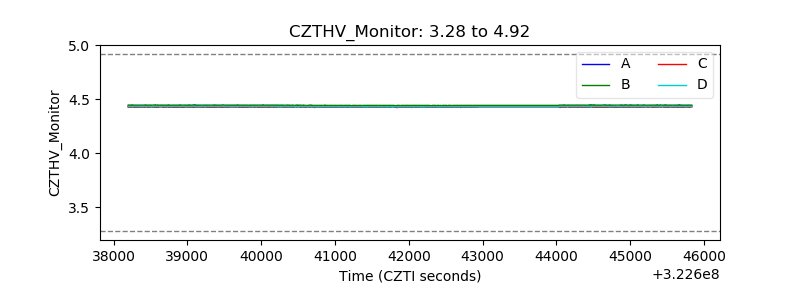 |
| D_VDD | 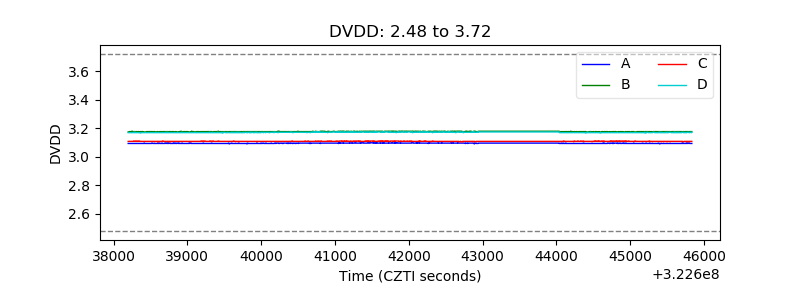 |
| Temperature 1 | 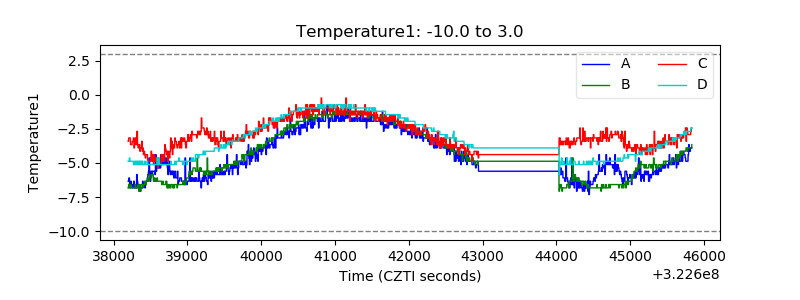 |
| Veto HV Monitor | 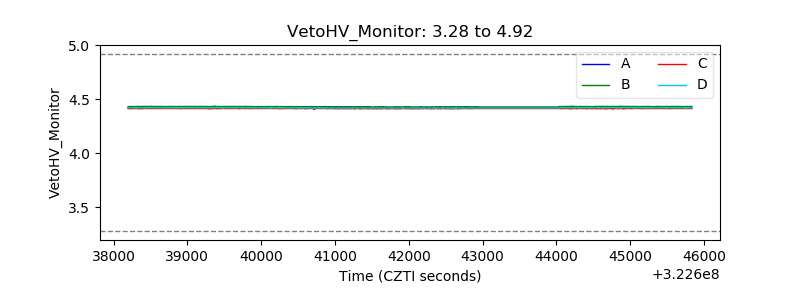 |
| Veto LLD | 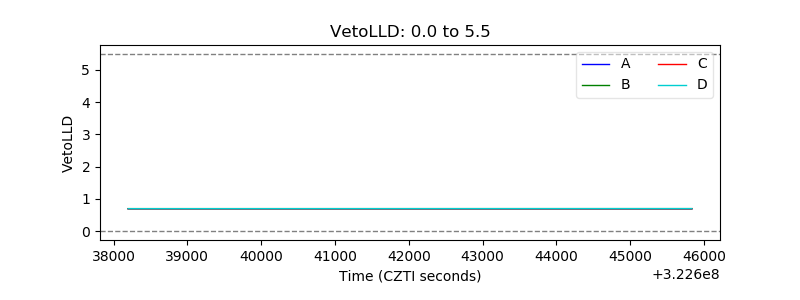 |
| Alpha Counter | 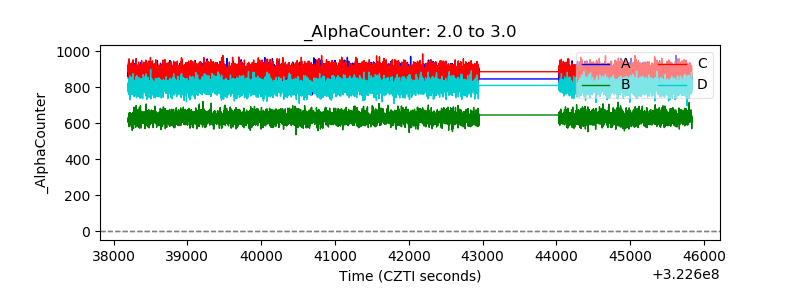 |
| _CPM_Rate | 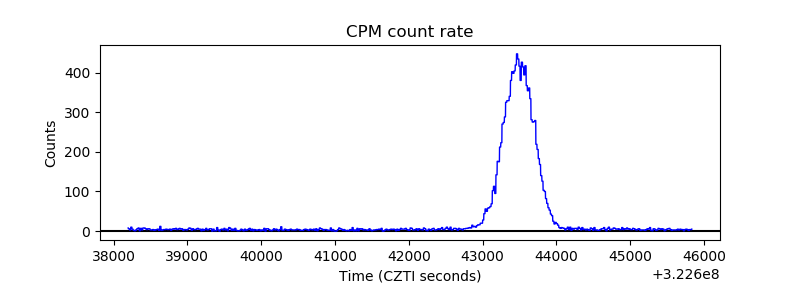 |
| CZT Counter | 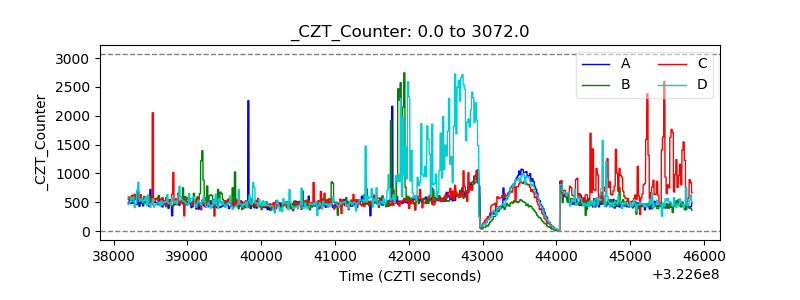 |
| +2.5 Volts monitor |  |
| +5 Volts monitor | 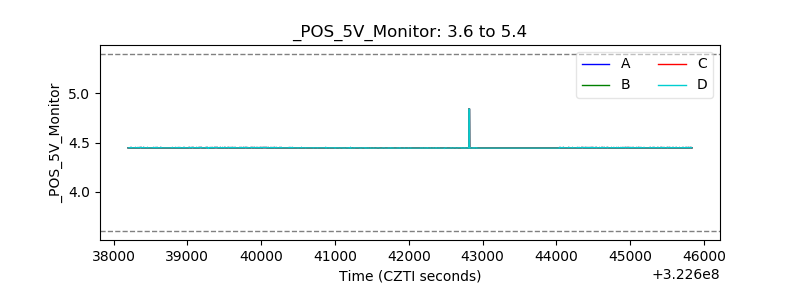 |
| _ROLL_ROT |  |
| _Roll_DEC | 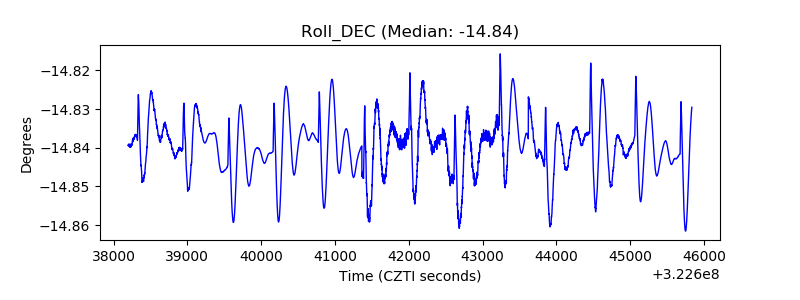 |
| _Roll_RA | 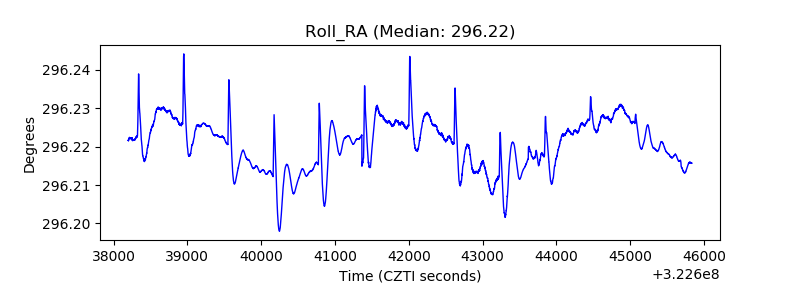 |
| Veto Counter | 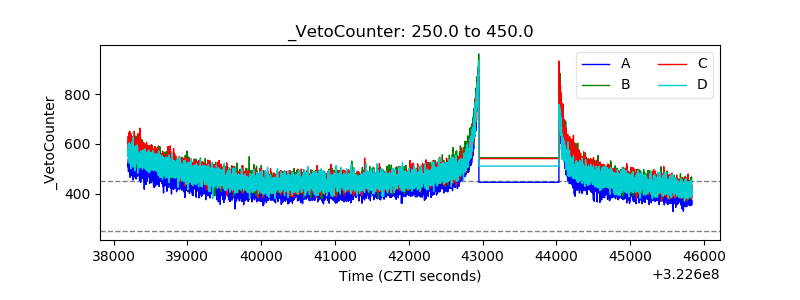 |