| Param | Original file | Final file |
|---|---|---|
| Filename | modeM0/AS1A07_118T01_9000003586_24250cztM0_level2.evt | modeM0/AS1A07_118T01_9000003586_24250cztM0_level2_quad_clean.evt |
| Size (bytes) | 722,191,680 | 93,767,040 |
| Size | 688.7 MB | 89.4 MB |
| Events in quadrant A | 3,965,987 | 588,766 |
| Events in quadrant B | 3,767,269 | 606,161 |
| Events in quadrant C | 6,057,912 | 573,032 |
| Events in quadrant D | 7,568,517 | 544,512 |
| Mode M0 | |||
|---|---|---|---|
| Quadrant | BADHDUFLAG | Total packets | Discarded packets |
| A | 0 | 16561 | 1 |
| B | 0 | 15898 | 1 |
| C | 0 | 22965 | 1 |
| D | 0 | 27665 | 1 |
| Mode SS | |||
|---|---|---|---|
| Quadrant | BADHDUFLAG | Total packets | Discarded packets |
| A | 0 | 152 | 0 |
| B | 0 | 152 | 0 |
| C | 0 | 152 | 0 |
| D | 0 | 152 | 0 |
| Quadrant | Total seconds | Saturated seconds | Saturation percentage |
|---|---|---|---|
| A | 7565 | 338 | 4.467944% |
| B | 7566 | 279 | 3.687550% |
| C | 7566 | 675 | 8.921491% |
| D | 7566 | 1276 | 16.864922% |
Noise dominated data is calculated using 1-second bins in cleaned event files. If a bin has >2000 counts, and if more than 50% of those come from <1% of pixels, then it is considered to be noise-dominated and hence unusable.
| Quadrant | # 1 sec bins | Bins with >0 counts | Bins with >2000 counts | High rate bins dominated by noise | Noise dominated (total time) | Noise dominated (detector-on time) | Marked lightcurve |
|---|---|---|---|---|---|---|---|
| A | 7580 | 7566 | 42 | 42 | 0.55% | 0.56% | 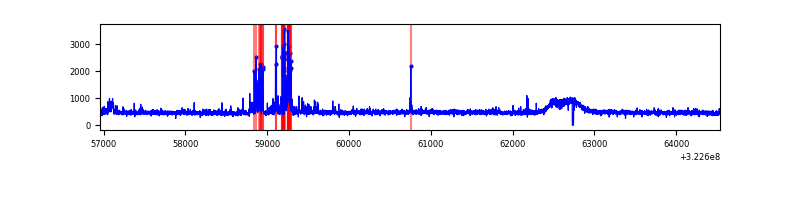 |
| B | 7581 | 7567 | 2 | 2 | 0.03% | 0.03% | 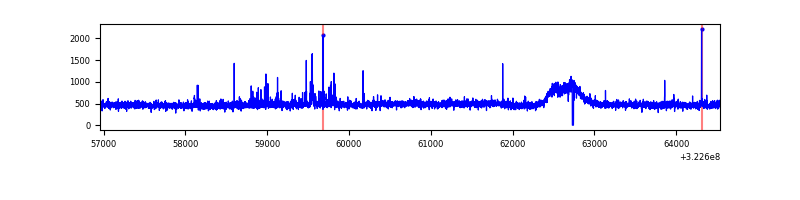 |
| C | 7581 | 7566 | 244 | 244 | 3.22% | 3.22% | 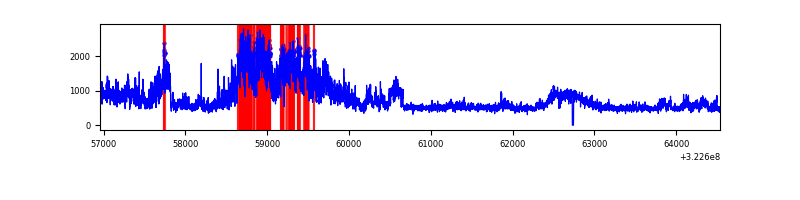 |
| D | 7580 | 7565 | 985 | 985 | 12.99% | 13.02% | 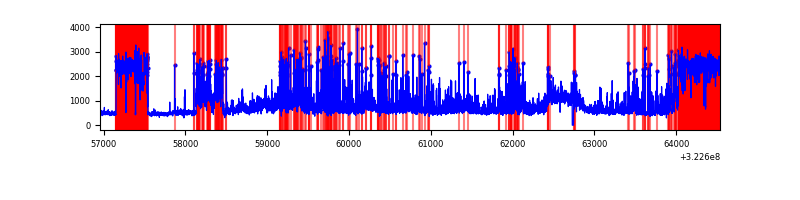 |
Top three noisy pixels from each quadrant. If the there are fewer than three noisy pixels in the level2.evt file, extra rows are filled as -1
| Pixel properties | Quadrant properties | ||||||
|---|---|---|---|---|---|---|---|
| Quadrant | DetID | PixID | Counts | Sigma | Mean | Median | Sigma |
| A | 6 | 16 | 238958 | 1238.09 | 943 | 922 | 192.3 |
| A | 3 | 1 | 94277 | 485.56 | 943 | 922 | 192.3 |
| A | 13 | 254 | 11754 | 56.34 | 943 | 922 | 192.3 |
| B | 4 | 171 | 58569 | 316.06 | 940 | 916 | 182.4 |
| B | 12 | 111 | 22214 | 116.76 | 940 | 916 | 182.4 |
| B | 11 | 111 | 19897 | 104.06 | 940 | 916 | 182.4 |
| C | 7 | 247 | 2382440 | 11217.52 | 899 | 905 | 212.3 |
| C | 14 | 238 | 138742 | 649.24 | 899 | 905 | 212.3 |
| C | 2 | 16 | 11617 | 50.46 | 899 | 905 | 212.3 |
| D | 7 | 238 | 1666407 | 7649.56 | 884 | 857 | 217.7 |
| D | 8 | 195 | 1400249 | 6427.15 | 884 | 857 | 217.7 |
| D | 1 | 52 | 834580 | 3829.13 | 884 | 857 | 217.7 |
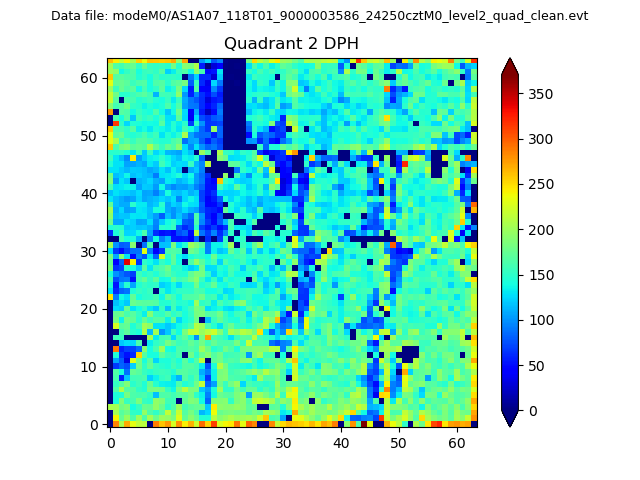
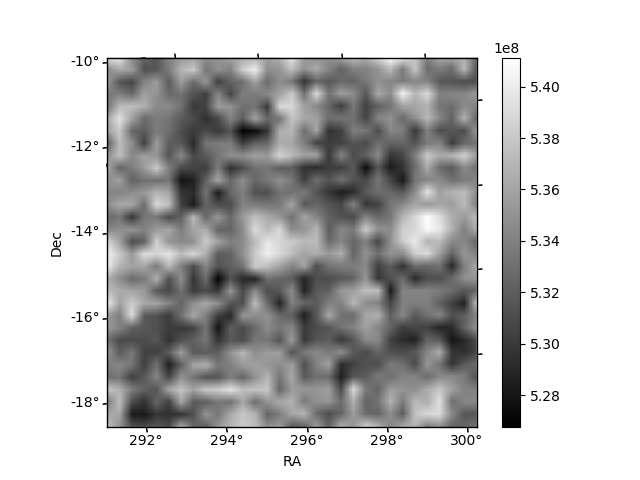
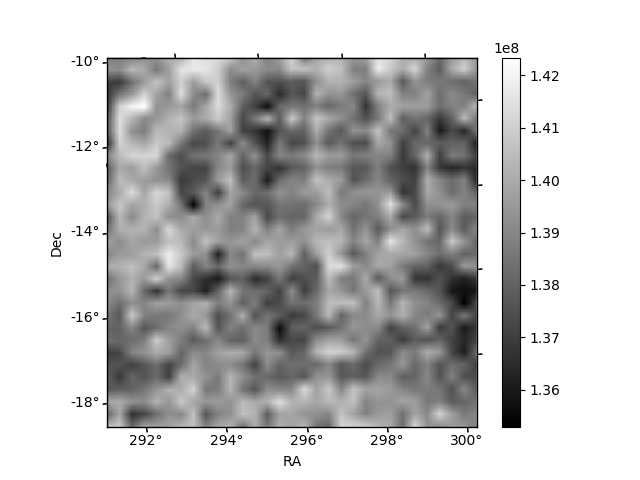
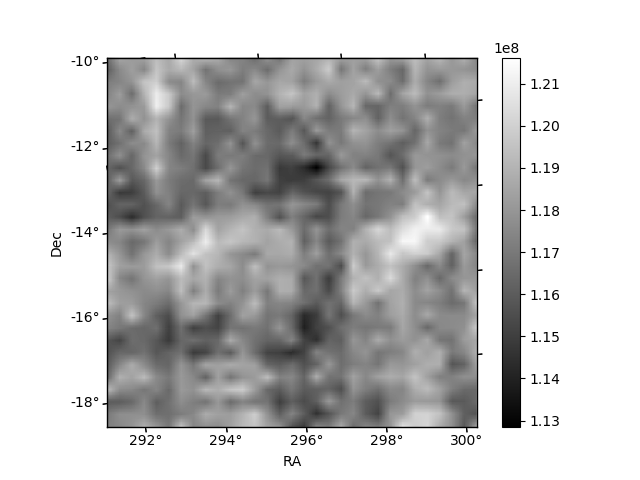
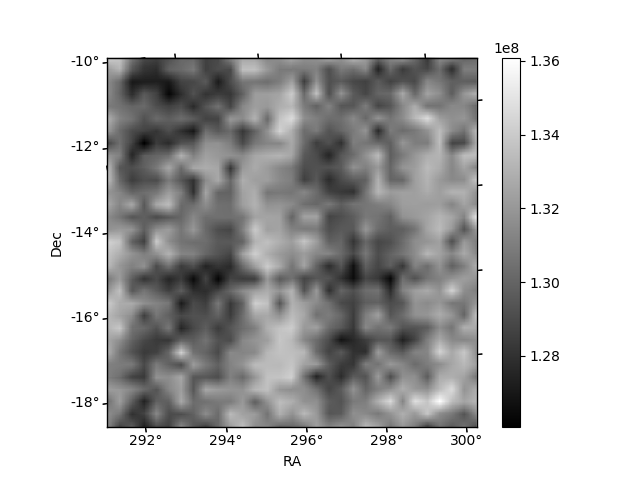
Histogram calculated using DETX and DETY for each event in the final _common_clean file
| Quadrant A | 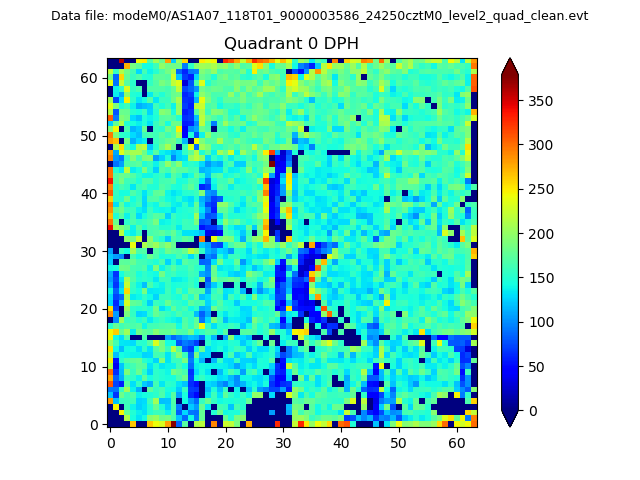 |
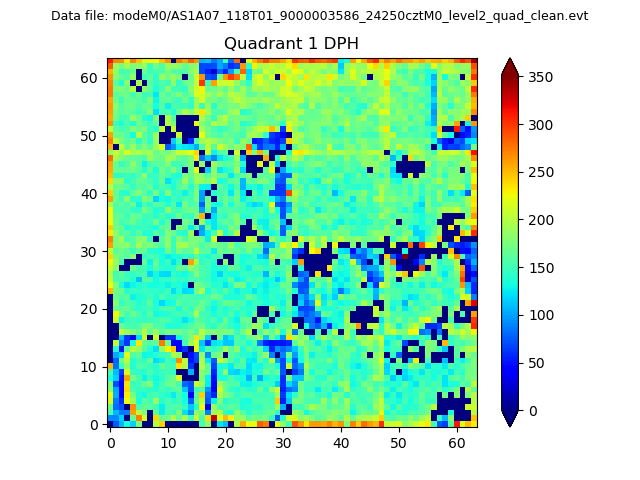 |
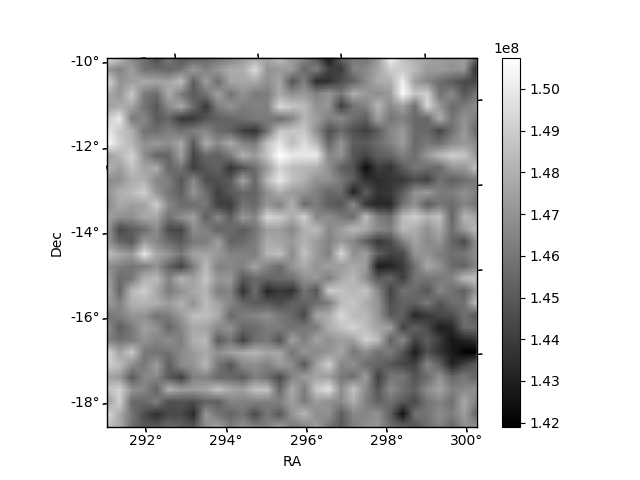
Quadrant B |
|---|---|---|---|
| Quadrant D | 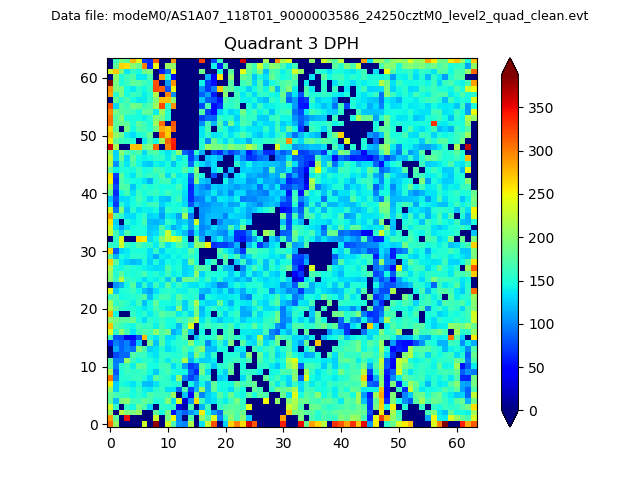 |
 |
Quadrant C |
| Plot type | Count rate plots | Images |
|---|---|---|
| Comparison with Poisson distribution Blue bars denote a histogram of data divided into 1 sec bins. Red curve is a Poisson curve with rate = median count rate of data. |
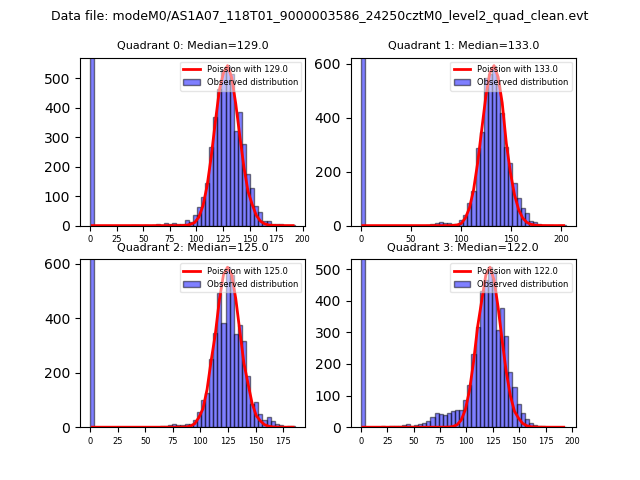 |
 |
| Quadrant-wise count rates Data is divided into 100 sec bins |
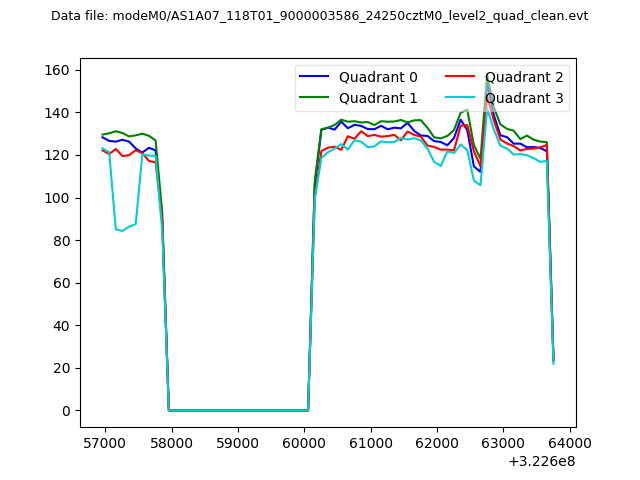 |
|
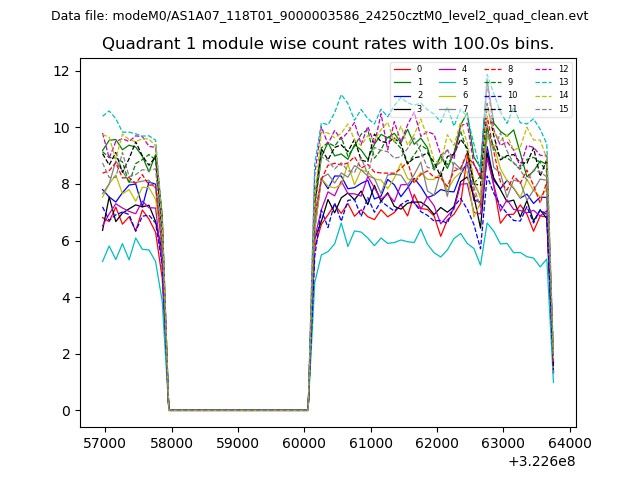
| Module-wise count rates for Quadrant A Data is divided into 100 sec bins |
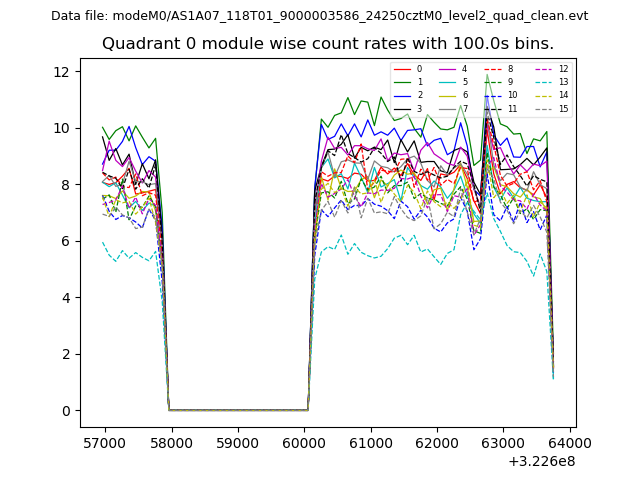 |
 |
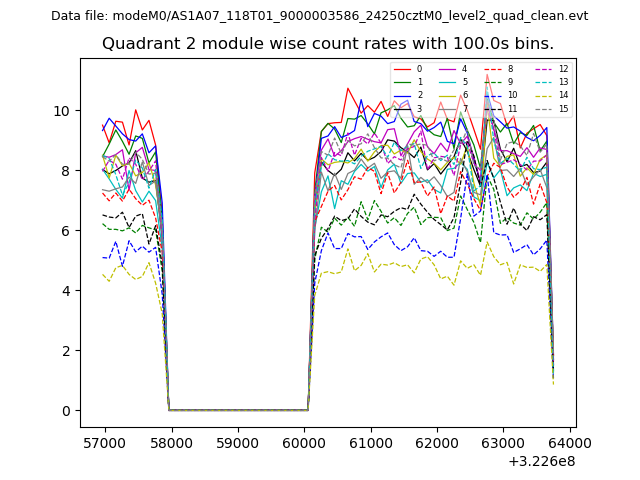
| Module-wise count rates for Quadrant B Data is divided into 100 sec bins |
 |
 |
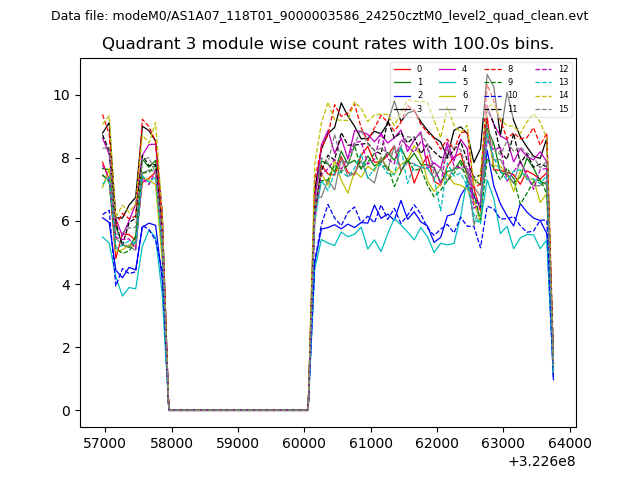
| Module-wise count rates for Quadrant C Data is divided into 100 sec bins |
 |
 |
| Module-wise count rates for Quadrant D Data is divided into 100 sec bins |
 |
 |
| Parameter | Plot |
|---|---|
| CZT HV Monitor | 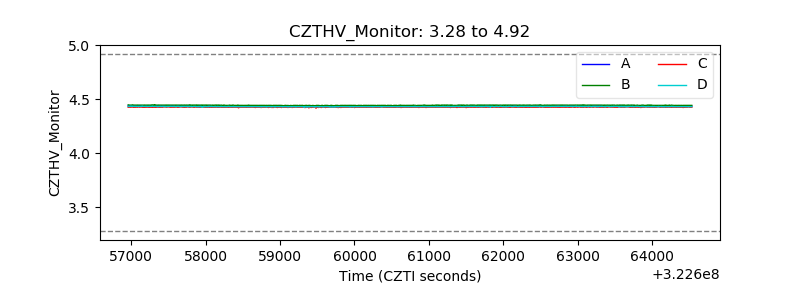 |
| D_VDD | 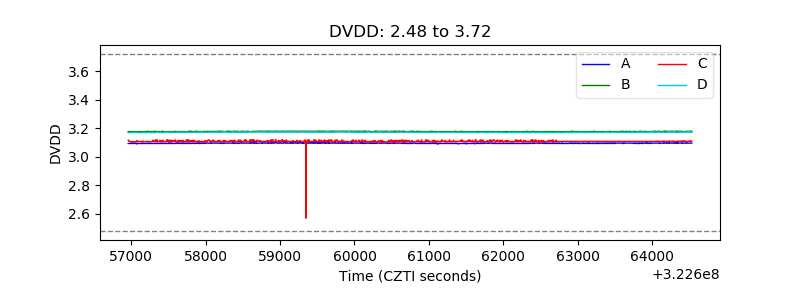 |
| Temperature 1 | 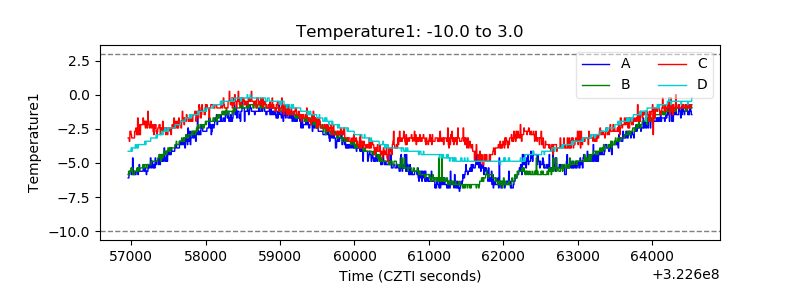 |
| Veto HV Monitor | 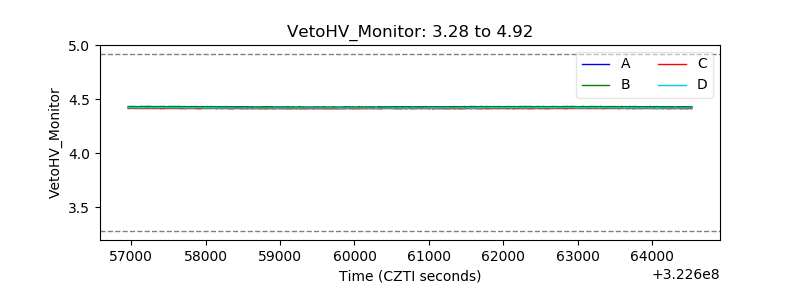 |
| Veto LLD | 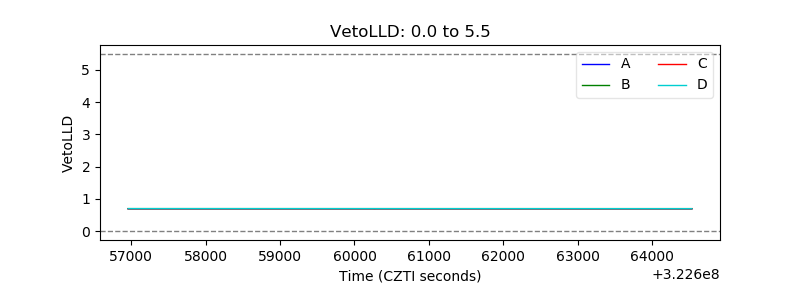 |
| Alpha Counter | 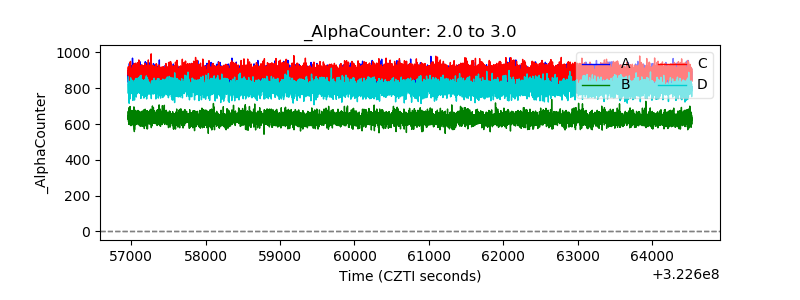 |
| _CPM_Rate | 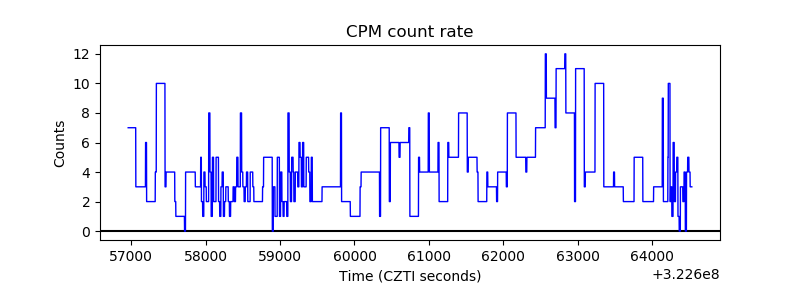 |
| CZT Counter | 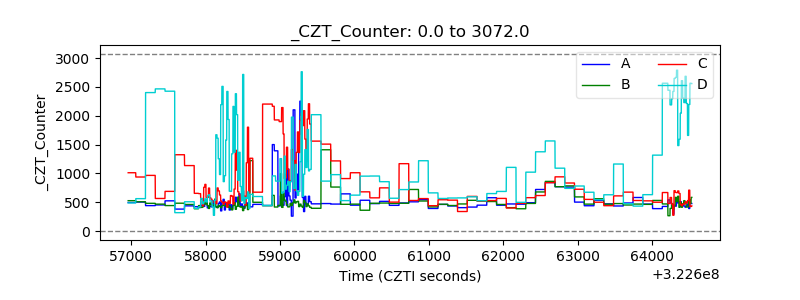 |
| +2.5 Volts monitor |  |
| +5 Volts monitor |  |
| _ROLL_ROT | 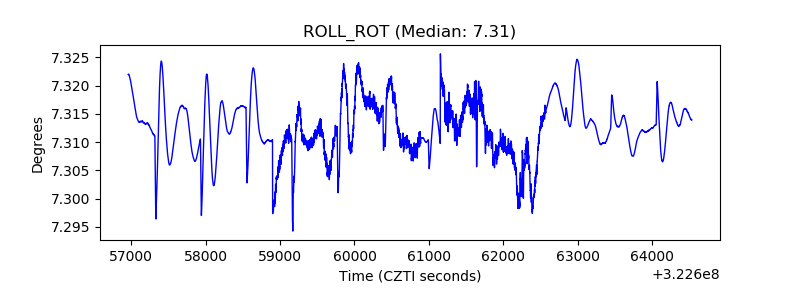 |
| _Roll_DEC | 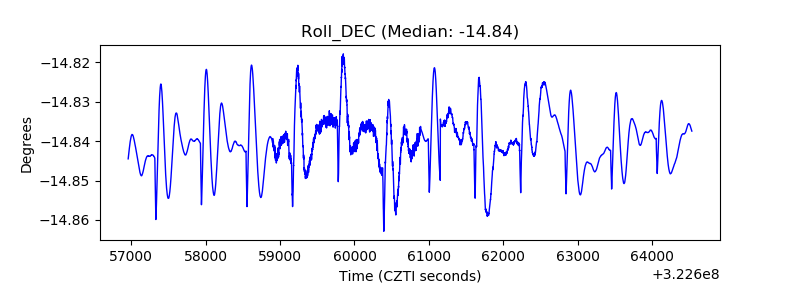 |
| _Roll_RA | 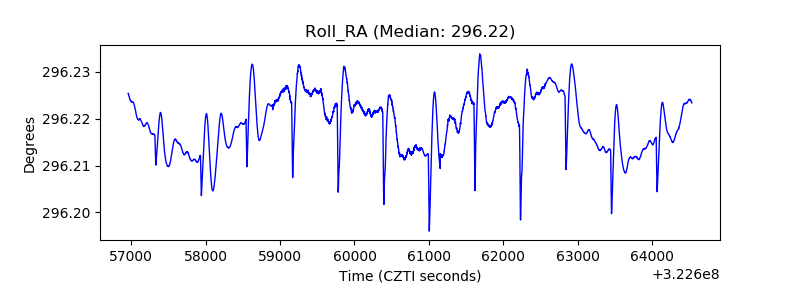 |
| Veto Counter | 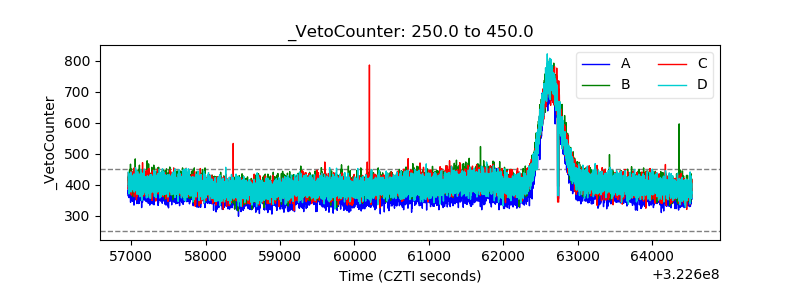 |