| Param | Original file | Final file |
|---|---|---|
| Filename | modeM0/AS1A07_118T01_9000003586_24254cztM0_level2.evt | modeM0/AS1A07_118T01_9000003586_24254cztM0_level2_quad_clean.evt |
| Size (bytes) | 503,369,280 | 76,204,800 |
| Size | 480.1 MB | 72.7 MB |
| Events in quadrant A | 3,338,183 | 466,785 |
| Events in quadrant B | 3,623,703 | 470,208 |
| Events in quadrant C | 3,428,760 | 450,858 |
| Events in quadrant D | 4,388,160 | 441,416 |
| Mode M0 | |||
|---|---|---|---|
| Quadrant | BADHDUFLAG | Total packets | Discarded packets |
| A | 0 | 14239 | 2 |
| B | 0 | 15142 | 2 |
| C | 0 | 14433 | 2 |
| D | 0 | 17581 | 2 |
| Mode SS | |||
|---|---|---|---|
| Quadrant | BADHDUFLAG | Total packets | Discarded packets |
| A | 0 | 140 | 0 |
| B | 0 | 140 | 0 |
| C | 0 | 140 | 0 |
| D | 0 | 140 | 0 |
| Mode M9 | |||
|---|---|---|---|
| Quadrant | BADHDUFLAG | Total packets | Discarded packets |
| A | 0 | 14 | 0 |
| B | 0 | 15 | 0 |
| C | 0 | 15 | 0 |
| D | 0 | 15 | 0 |
| Quadrant | Total seconds | Saturated seconds | Saturation percentage |
|---|---|---|---|
| A | 6860 | 55 | 0.801749% |
| B | 6860 | 90 | 1.311953% |
| C | 6860 | 101 | 1.472303% |
| D | 6860 | 178 | 2.594752% |
Noise dominated data is calculated using 1-second bins in cleaned event files. If a bin has >2000 counts, and if more than 50% of those come from <1% of pixels, then it is considered to be noise-dominated and hence unusable.
| Quadrant | # 1 sec bins | Bins with >0 counts | Bins with >2000 counts | High rate bins dominated by noise | Noise dominated (total time) | Noise dominated (detector-on time) | Marked lightcurve |
|---|---|---|---|---|---|---|---|
| A | 7765 | 6860 | 0 | 0 | 0.00% | 0.00% | 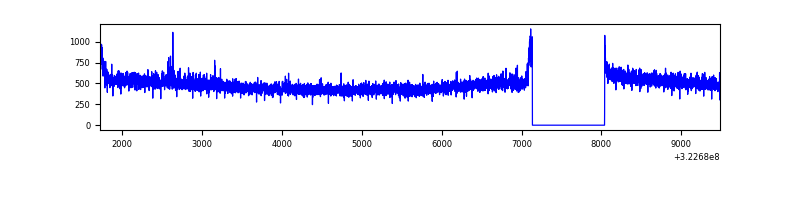 |
| B | 7765 | 6860 | 9 | 9 | 0.12% | 0.13% | 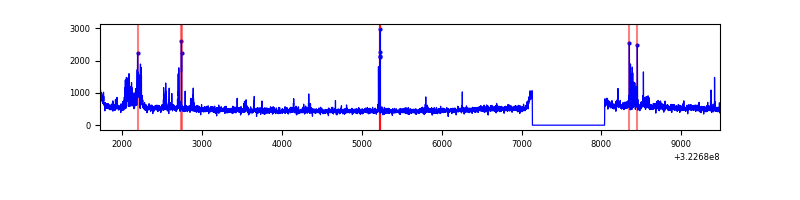 |
| C | 7765 | 6860 | 4 | 4 | 0.05% | 0.06% | 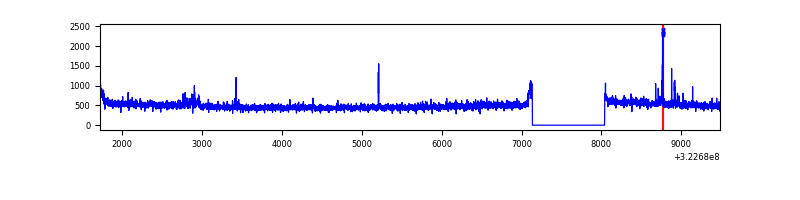 |
| D | 7765 | 6860 | 82 | 82 | 1.06% | 1.20% | 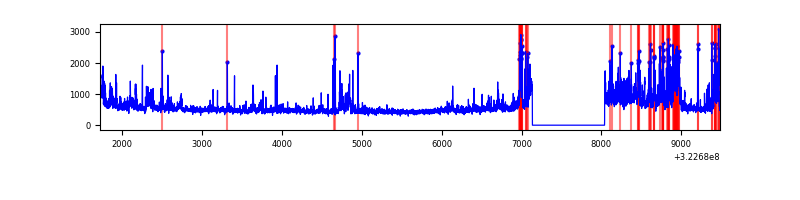 |
Top three noisy pixels from each quadrant. If the there are fewer than three noisy pixels in the level2.evt file, extra rows are filled as -1
| Pixel properties | Quadrant properties | ||||||
|---|---|---|---|---|---|---|---|
| Quadrant | DetID | PixID | Counts | Sigma | Mean | Median | Sigma |
| A | 3 | 1 | 16865 | 92.15 | 861 | 840 | 173.9 |
| A | 13 | 254 | 10799 | 57.27 | 861 | 840 | 173.9 |
| A | 3 | 137 | 7643 | 39.12 | 861 | 840 | 173.9 |
| B | 15 | 33 | 114287 | 690.15 | 856 | 835 | 164.4 |
| B | 0 | 229 | 54907 | 328.93 | 856 | 835 | 164.4 |
| B | 0 | 190 | 45903 | 274.16 | 856 | 835 | 164.4 |
| C | 14 | 238 | 131397 | 673.27 | 824 | 830 | 193.9 |
| C | 2 | 16 | 62422 | 317.6 | 824 | 830 | 193.9 |
| C | 7 | 247 | 15796 | 77.17 | 824 | 830 | 193.9 |
| D | 8 | 195 | 506314 | 2474.43 | 835 | 809 | 204.3 |
| D | 1 | 52 | 411481 | 2010.22 | 835 | 809 | 204.3 |
| D | 7 | 238 | 178884 | 871.67 | 835 | 809 | 204.3 |
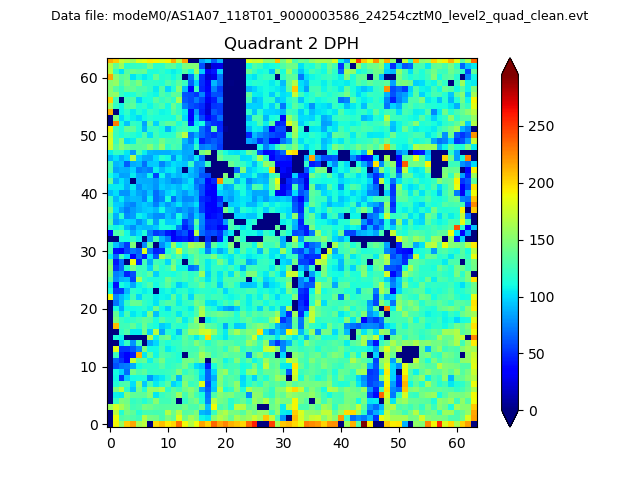
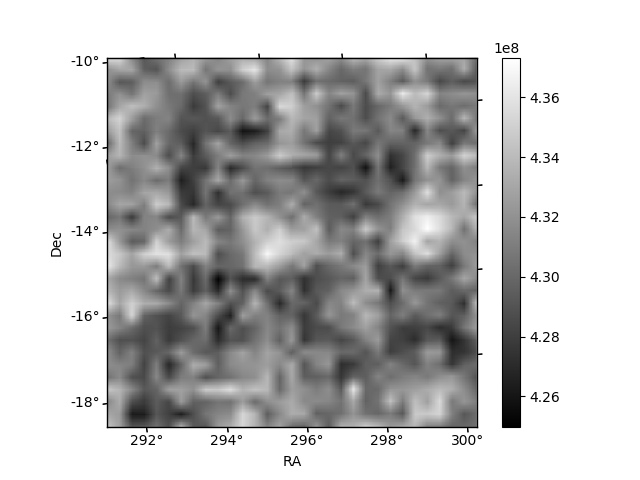
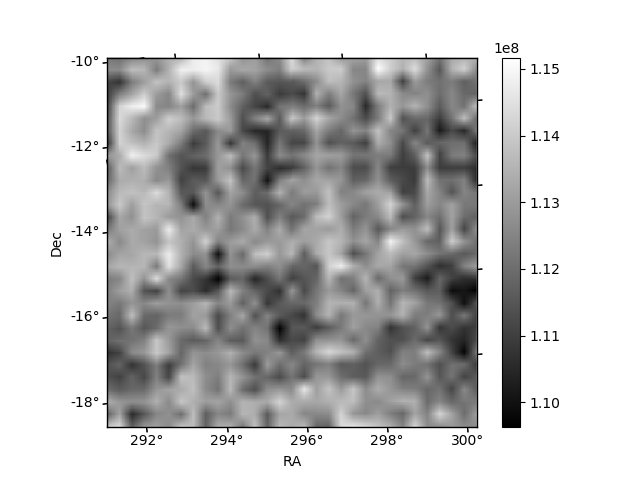
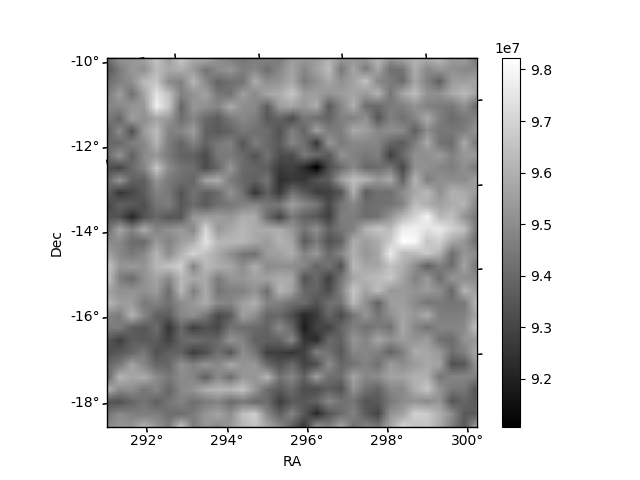
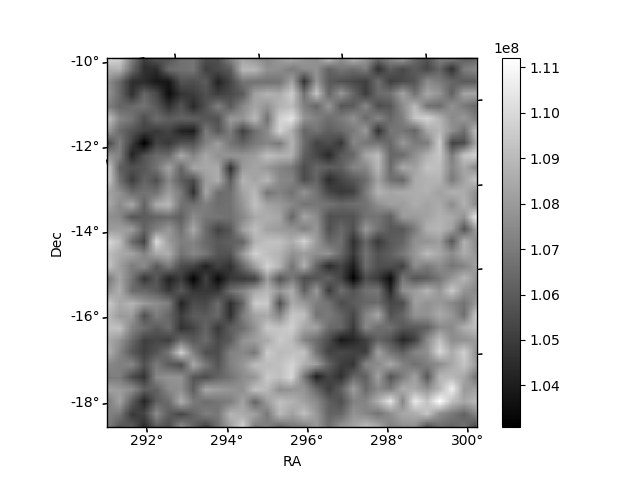
Histogram calculated using DETX and DETY for each event in the final _common_clean file
| Quadrant A | 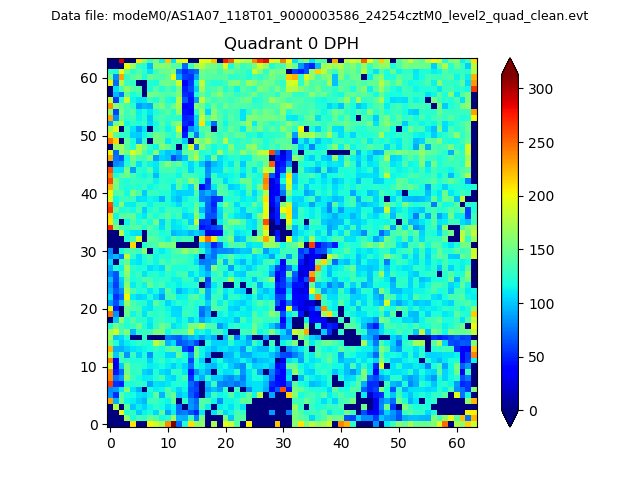 |
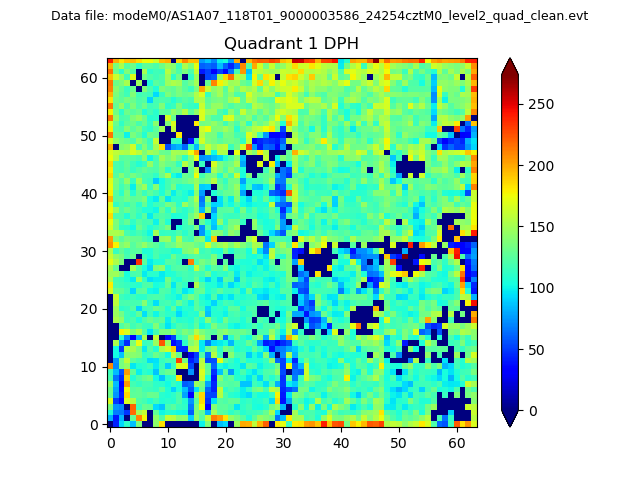 |
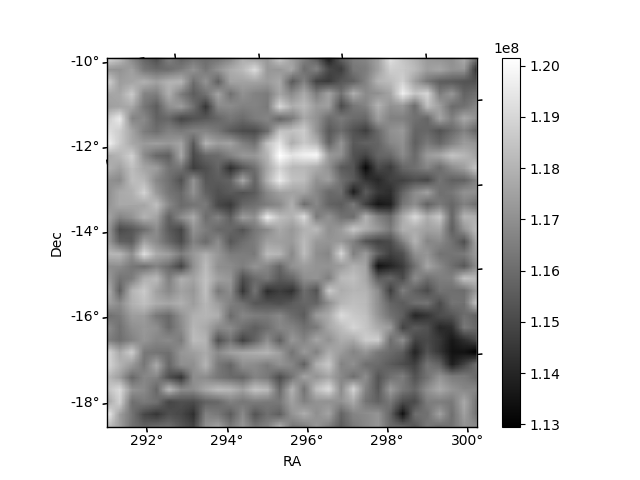
Quadrant B |
|---|---|---|---|
| Quadrant D | 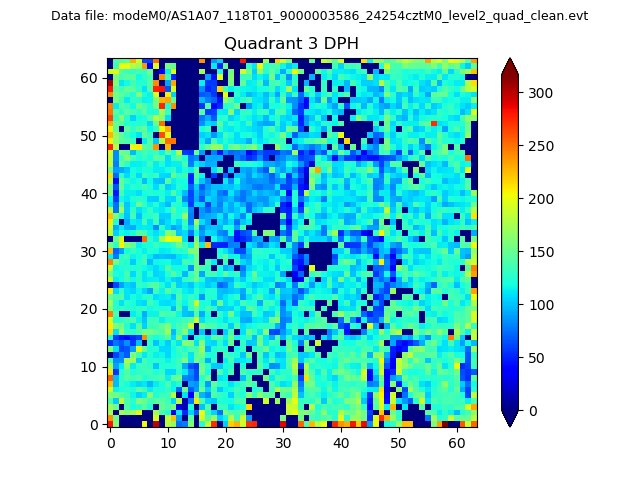 |
 |
Quadrant C |
| Plot type | Count rate plots | Images |
|---|---|---|
| Comparison with Poisson distribution Blue bars denote a histogram of data divided into 1 sec bins. Red curve is a Poisson curve with rate = median count rate of data. |
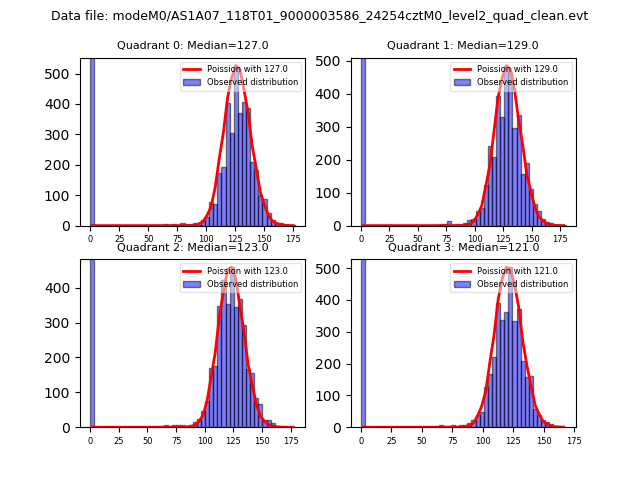 |
 |
| Quadrant-wise count rates Data is divided into 100 sec bins |
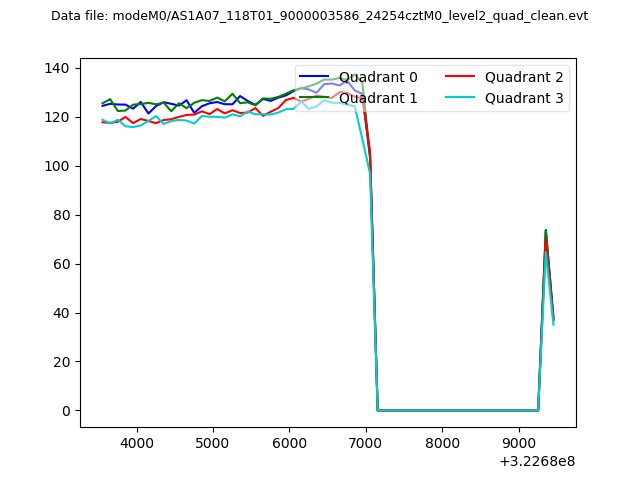 |
|
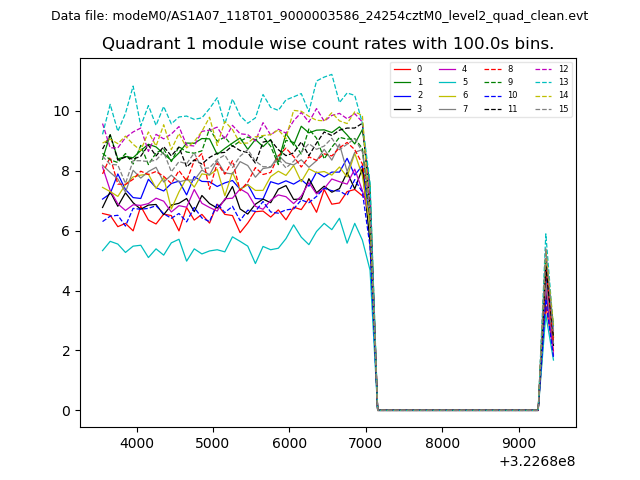
| Module-wise count rates for Quadrant A Data is divided into 100 sec bins |
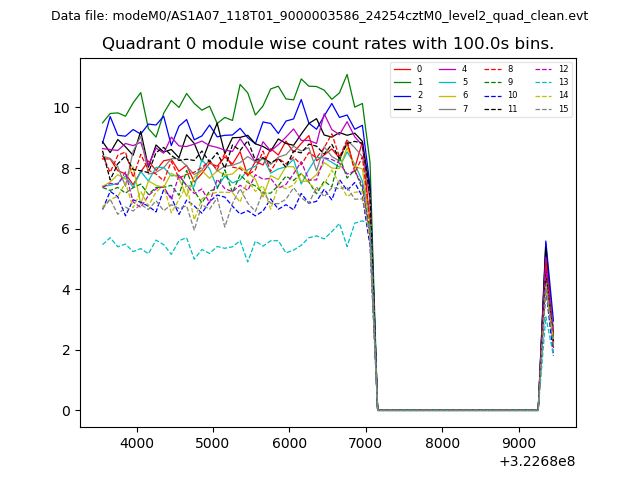 |
 |
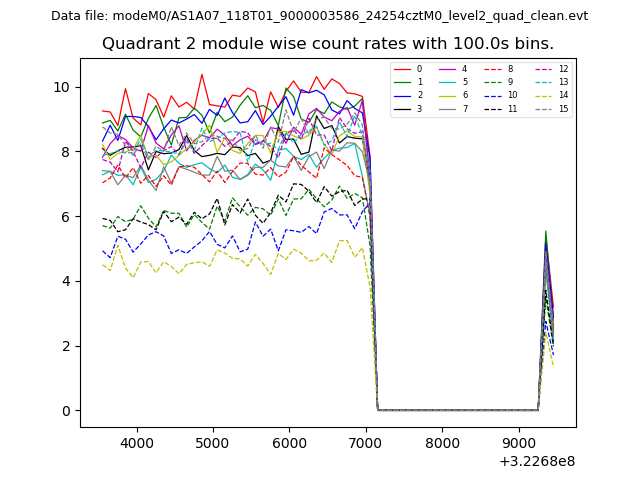
| Module-wise count rates for Quadrant B Data is divided into 100 sec bins |
 |
 |
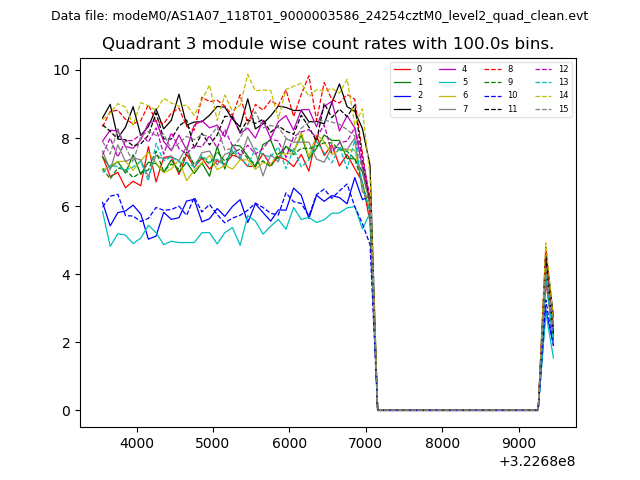
| Module-wise count rates for Quadrant C Data is divided into 100 sec bins |
 |
 |
| Module-wise count rates for Quadrant D Data is divided into 100 sec bins |
 |
 |
| Parameter | Plot |
|---|---|
| CZT HV Monitor | 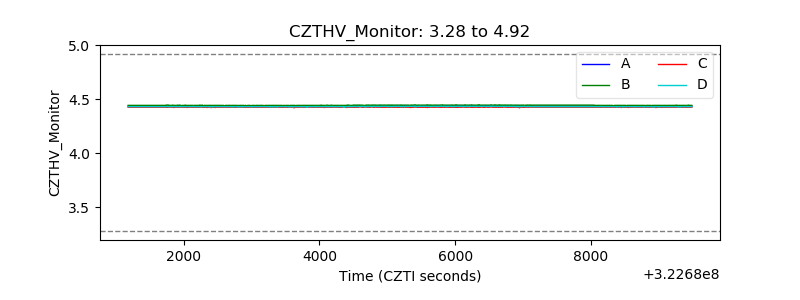 |
| D_VDD | 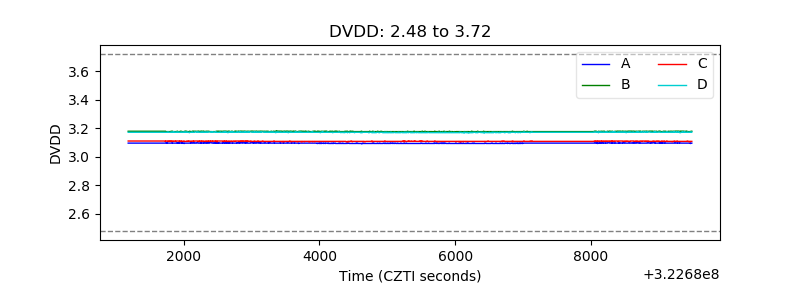 |
| Temperature 1 | 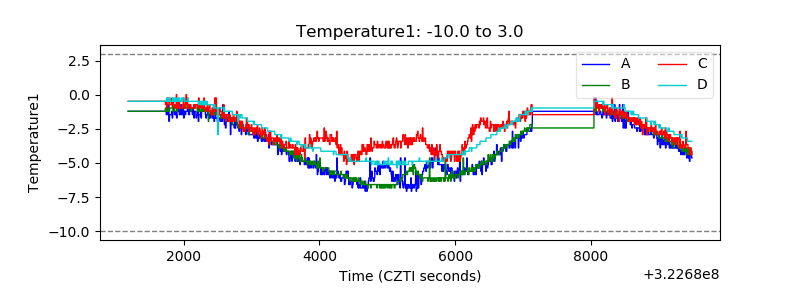 |
| Veto HV Monitor | 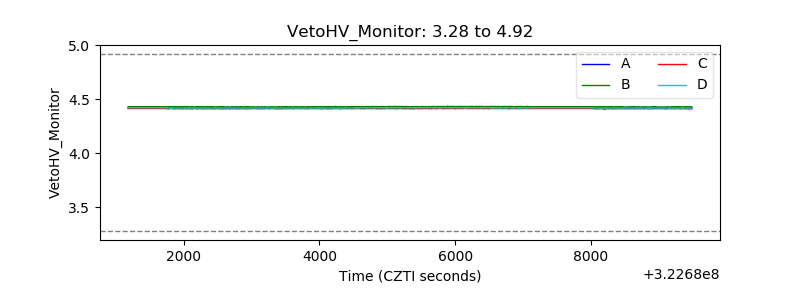 |
| Veto LLD | 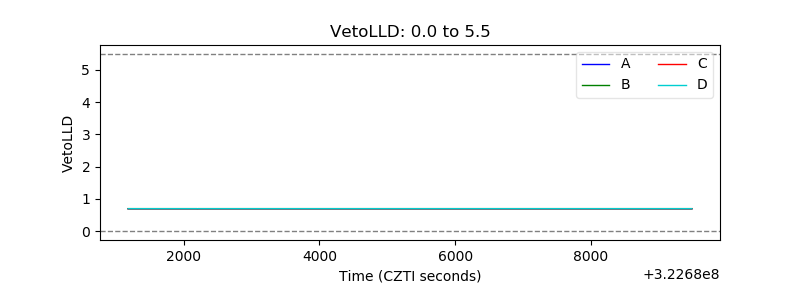 |
| Alpha Counter | 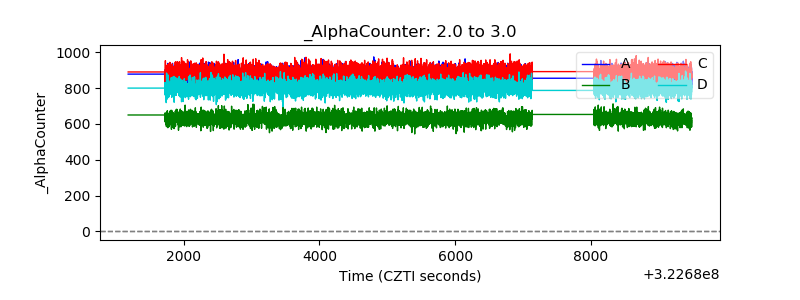 |
| _CPM_Rate | 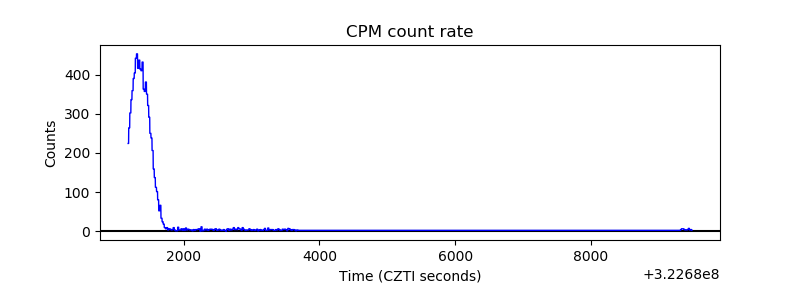 |
| CZT Counter | 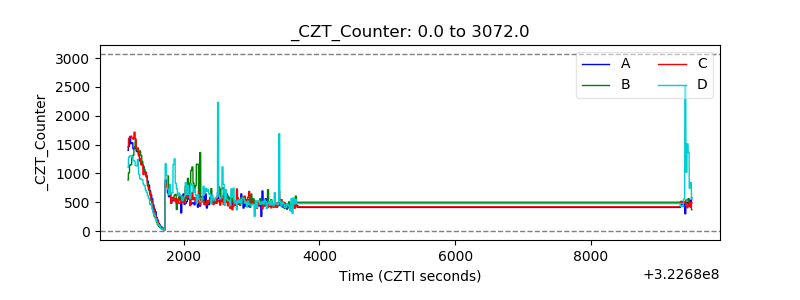 |
| +2.5 Volts monitor |  |
| +5 Volts monitor | 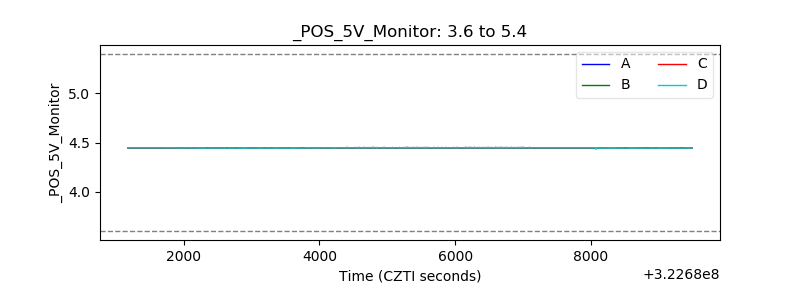 |
| _ROLL_ROT | 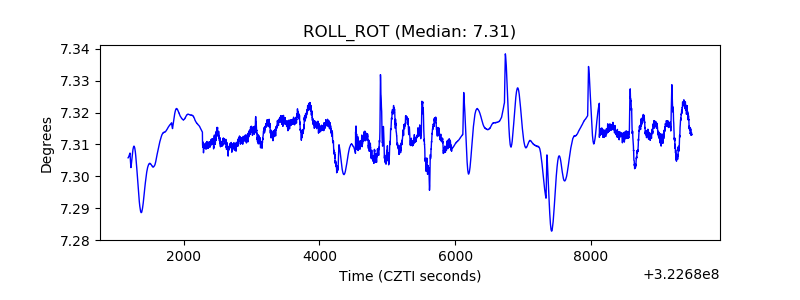 |
| _Roll_DEC | 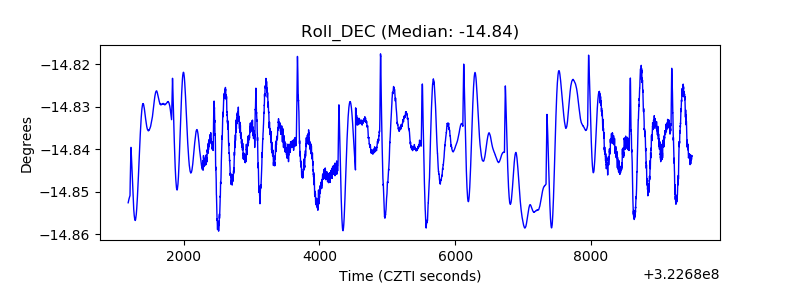 |
| _Roll_RA | 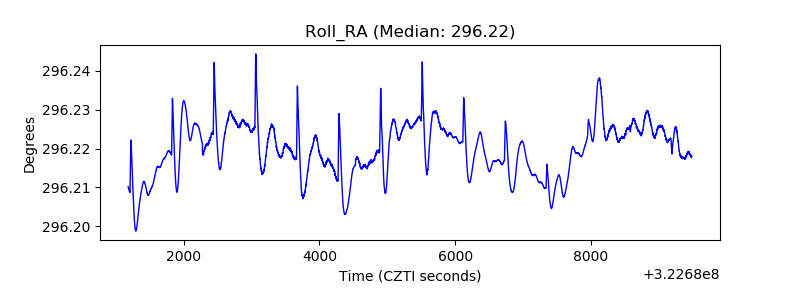 |
| Veto Counter | 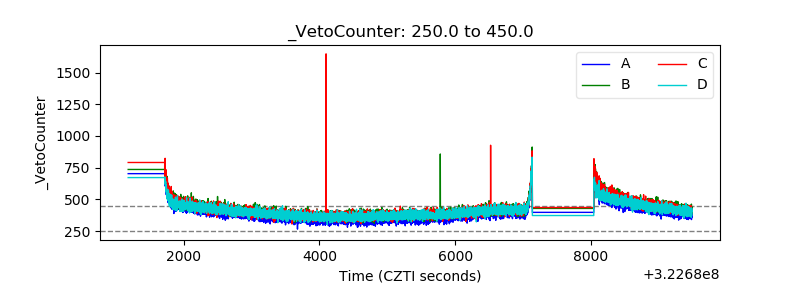 |