| Param | Original file | Final file |
|---|---|---|
| Filename | modeM0/AS1A07_118T01_9000003586_24255cztM0_level2.evt | modeM0/AS1A07_118T01_9000003586_24255cztM0_level2_quad_clean.evt |
| Size (bytes) | 539,832,960 | 83,710,080 |
| Size | 514.8 MB | 79.8 MB |
| Events in quadrant A | 3,262,718 | 531,160 |
| Events in quadrant B | 3,433,539 | 540,483 |
| Events in quadrant C | 3,363,965 | 516,742 |
| Events in quadrant D | 5,840,392 | 485,528 |
| Mode M0 | |||
|---|---|---|---|
| Quadrant | BADHDUFLAG | Total packets | Discarded packets |
| A | 0 | 13906 | 2 |
| B | 0 | 14505 | 2 |
| C | 0 | 14115 | 2 |
| D | 0 | 21825 | 2 |
| Mode SS | |||
|---|---|---|---|
| Quadrant | BADHDUFLAG | Total packets | Discarded packets |
| A | 0 | 134 | 0 |
| B | 0 | 134 | 0 |
| C | 0 | 134 | 0 |
| D | 0 | 134 | 0 |
| Mode M9 | |||
|---|---|---|---|
| Quadrant | BADHDUFLAG | Total packets | Discarded packets |
| A | 0 | 11 | 0 |
| B | 0 | 12 | 0 |
| C | 0 | 12 | 0 |
| D | 0 | 12 | 0 |
| Quadrant | Total seconds | Saturated seconds | Saturation percentage |
|---|---|---|---|
| A | 6609 | 26 | 0.393403% |
| B | 6609 | 52 | 0.786806% |
| C | 6609 | 81 | 1.225601% |
| D | 6609 | 768 | 11.620517% |
Noise dominated data is calculated using 1-second bins in cleaned event files. If a bin has >2000 counts, and if more than 50% of those come from <1% of pixels, then it is considered to be noise-dominated and hence unusable.
| Quadrant | # 1 sec bins | Bins with >0 counts | Bins with >2000 counts | High rate bins dominated by noise | Noise dominated (total time) | Noise dominated (detector-on time) | Marked lightcurve |
|---|---|---|---|---|---|---|---|
| A | 7684 | 6609 | 0 | 0 | 0.00% | 0.00% | 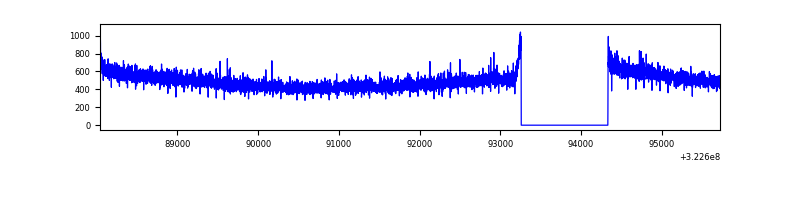 |
| B | 7684 | 6609 | 5 | 5 | 0.07% | 0.08% | 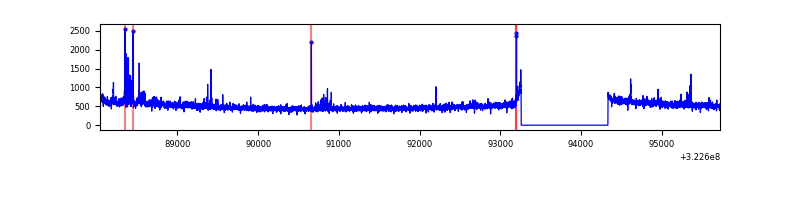 |
| C | 7684 | 6609 | 5 | 5 | 0.07% | 0.08% | 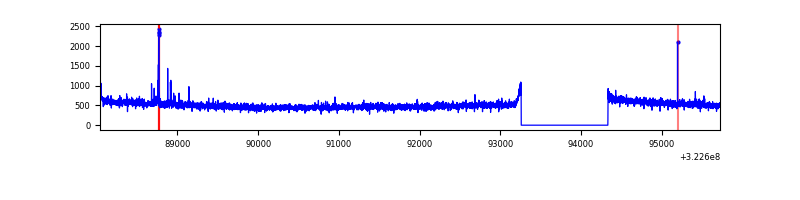 |
| D | 7684 | 6610 | 433 | 433 | 5.64% | 6.55% | 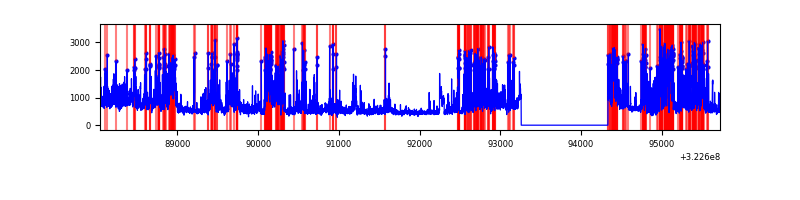 |
Top three noisy pixels from each quadrant. If the there are fewer than three noisy pixels in the level2.evt file, extra rows are filled as -1
| Pixel properties | Quadrant properties | ||||||
|---|---|---|---|---|---|---|---|
| Quadrant | DetID | PixID | Counts | Sigma | Mean | Median | Sigma |
| A | 3 | 1 | 10845 | 58.94 | 844 | 828 | 169.9 |
| A | 13 | 254 | 10286 | 55.65 | 844 | 828 | 169.9 |
| A | 3 | 137 | 7269 | 37.9 | 844 | 828 | 169.9 |
| B | 0 | 190 | 53090 | 326.45 | 843 | 824 | 160.1 |
| B | 0 | 229 | 40675 | 248.91 | 843 | 824 | 160.1 |
| B | 0 | 189 | 18742 | 111.92 | 843 | 824 | 160.1 |
| C | 14 | 238 | 129578 | 679.56 | 812 | 818 | 189.5 |
| C | 2 | 16 | 41502 | 214.72 | 812 | 818 | 189.5 |
| C | 7 | 247 | 18235 | 91.92 | 812 | 818 | 189.5 |
| D | 1 | 52 | 1879124 | 10123.04 | 765 | 742 | 185.6 |
| D | 8 | 195 | 517675 | 2785.87 | 765 | 742 | 185.6 |
| D | 12 | 233 | 383276 | 2061.56 | 765 | 742 | 185.6 |
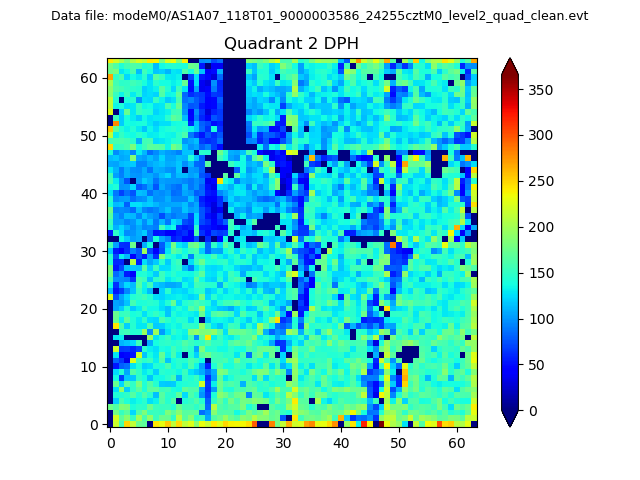
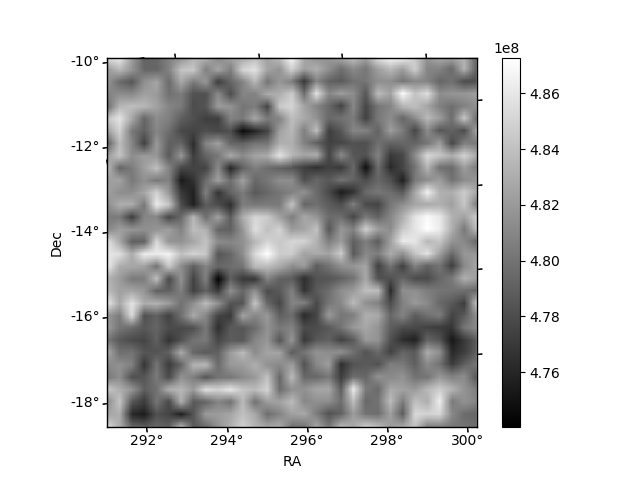
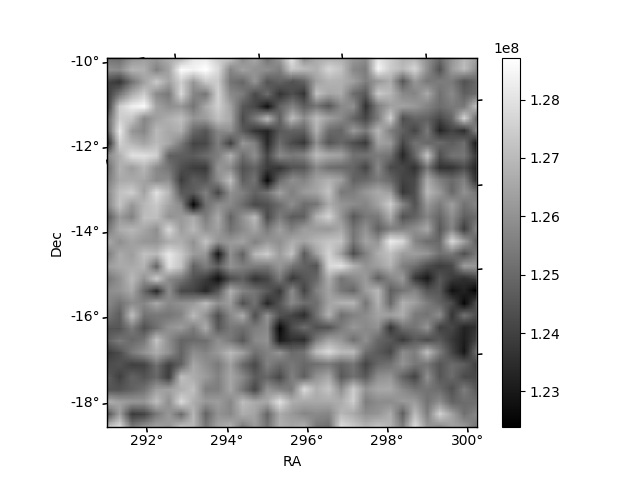
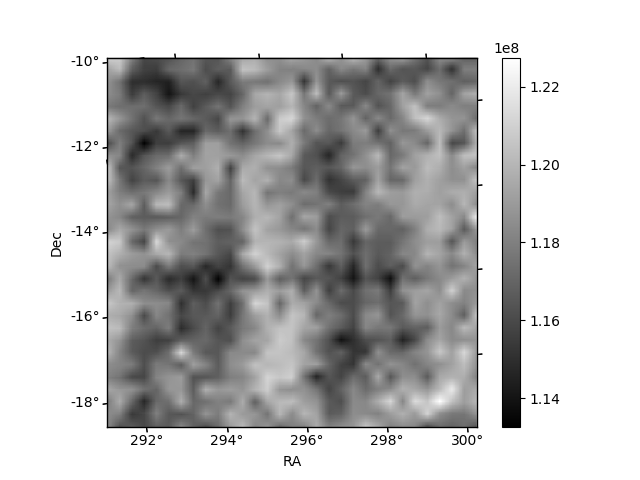
Histogram calculated using DETX and DETY for each event in the final _common_clean file
| Quadrant A | 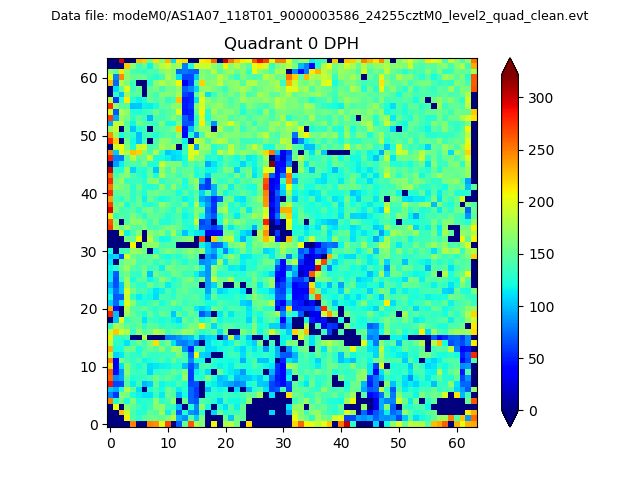 |
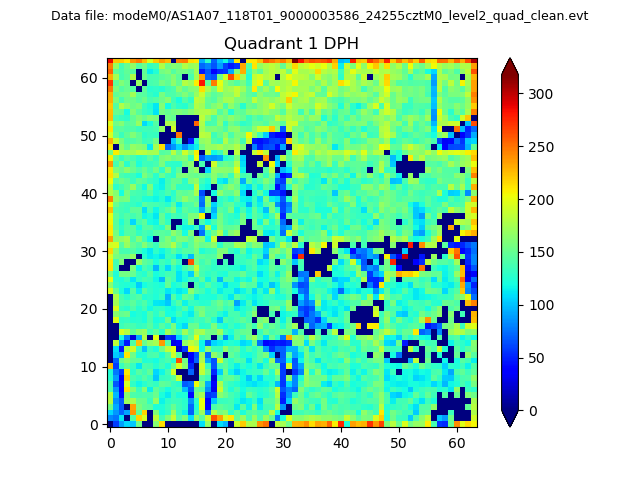 |
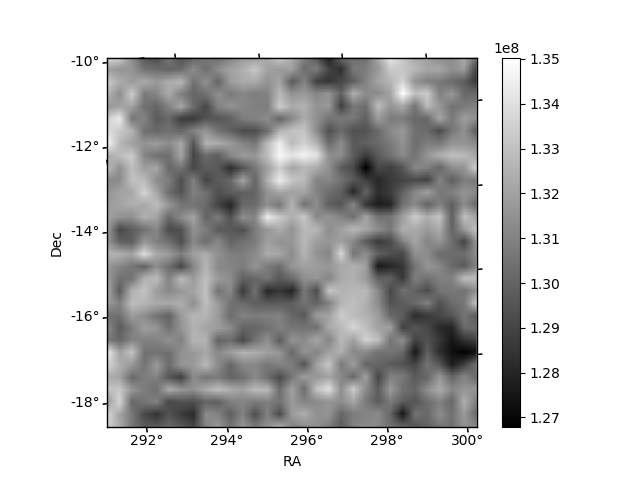
Quadrant B |
|---|---|---|---|
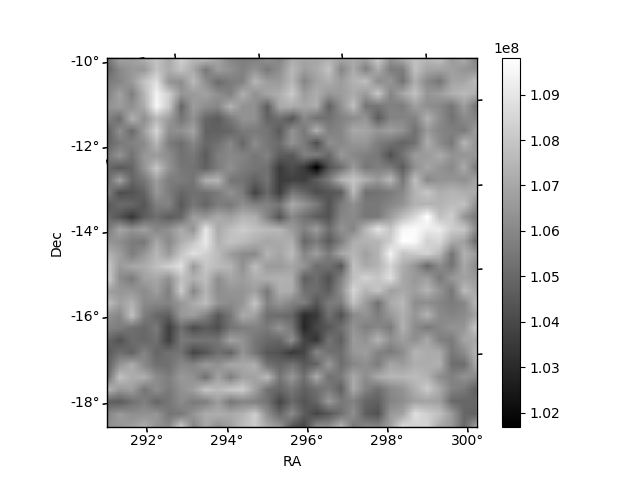
| Quadrant D | 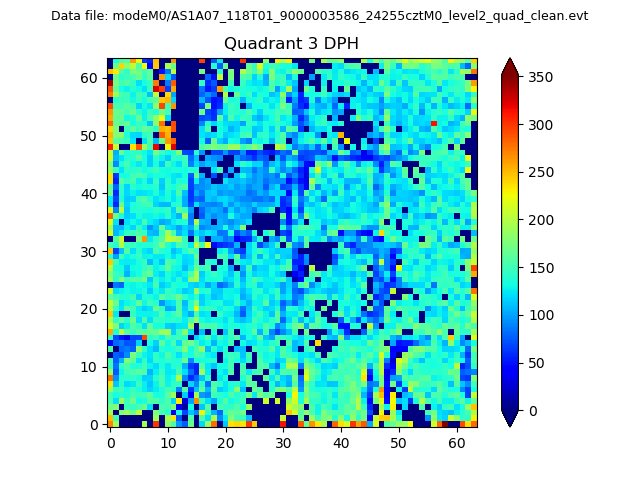 |
 |
Quadrant C |
| Plot type | Count rate plots | Images |
|---|---|---|
| Comparison with Poisson distribution Blue bars denote a histogram of data divided into 1 sec bins. Red curve is a Poisson curve with rate = median count rate of data. |
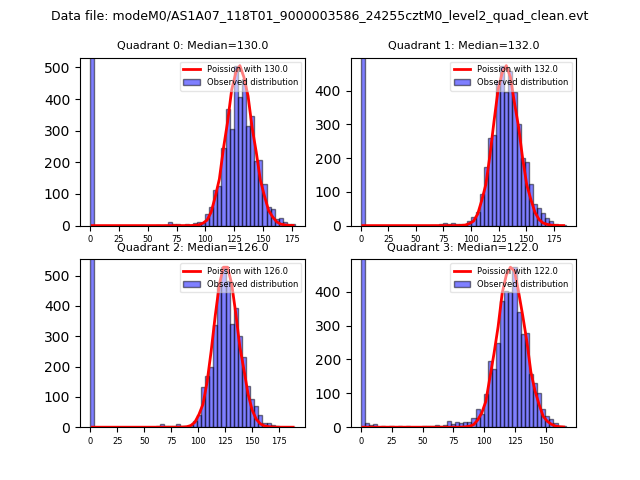 |
 |
| Quadrant-wise count rates Data is divided into 100 sec bins |
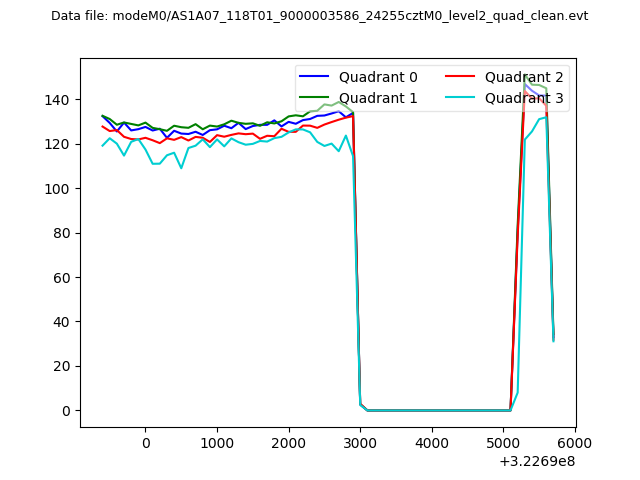 |
|
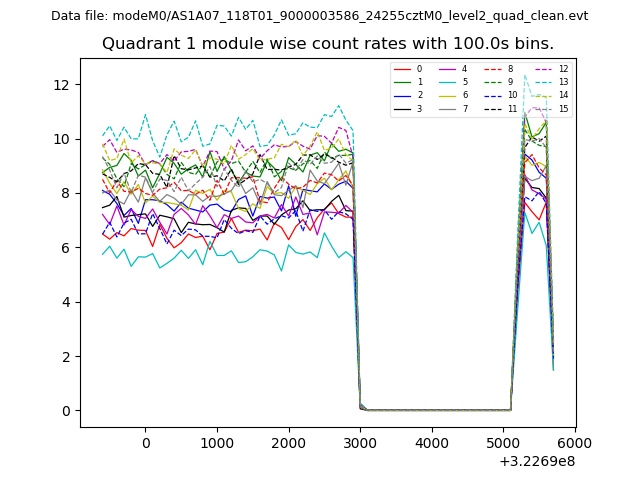
| Module-wise count rates for Quadrant A Data is divided into 100 sec bins |
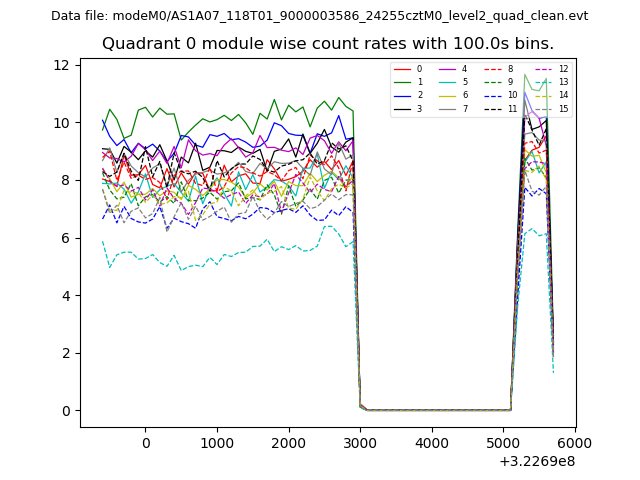 |
 |
| Module-wise count rates for Quadrant B Data is divided into 100 sec bins |
 |
 |
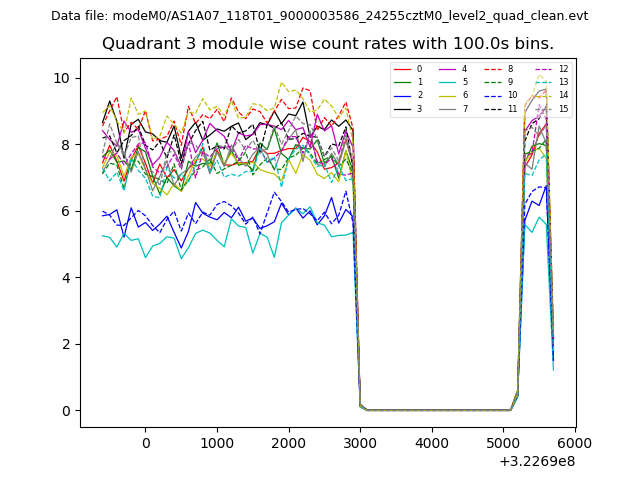
| Module-wise count rates for Quadrant C Data is divided into 100 sec bins |
 |
 |
| Module-wise count rates for Quadrant D Data is divided into 100 sec bins |
 |
 |
| Parameter | Plot |
|---|---|
| CZT HV Monitor |  |
| D_VDD | 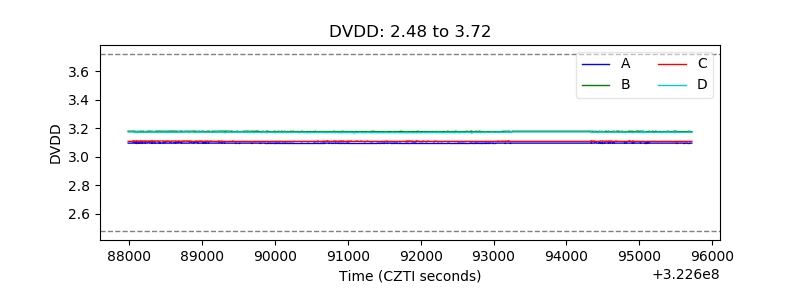 |
| Temperature 1 | 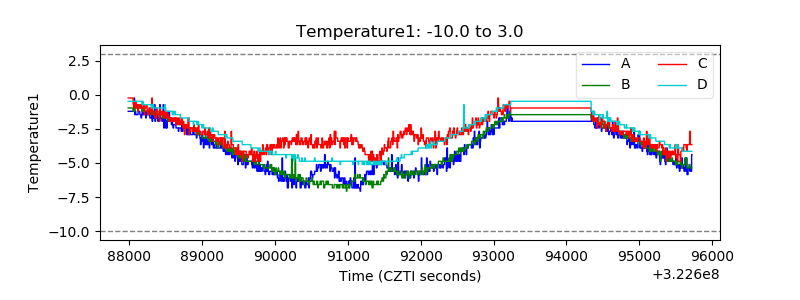 |
| Veto HV Monitor | 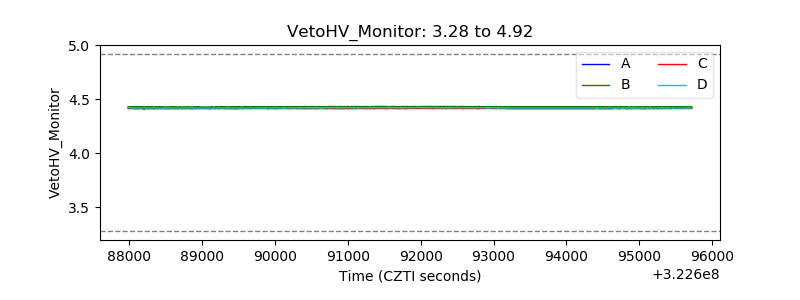 |
| Veto LLD | 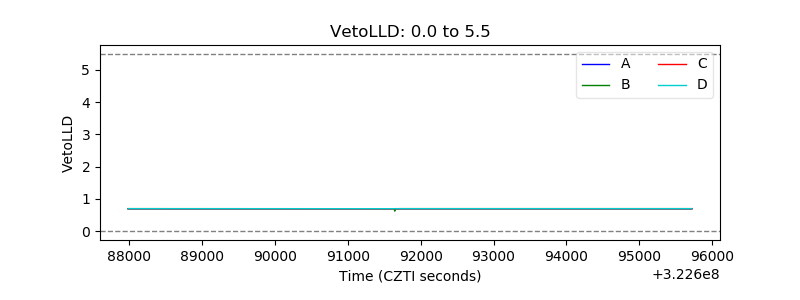 |
| Alpha Counter | 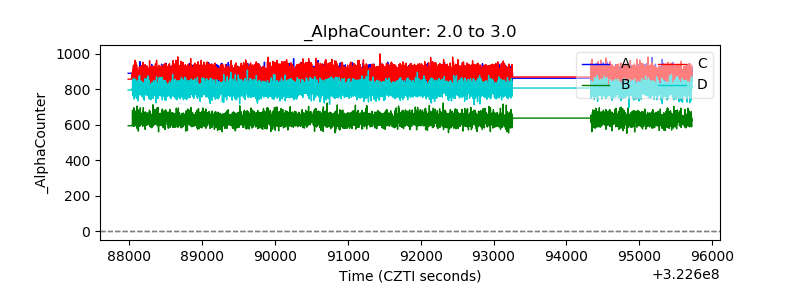 |
| _CPM_Rate | 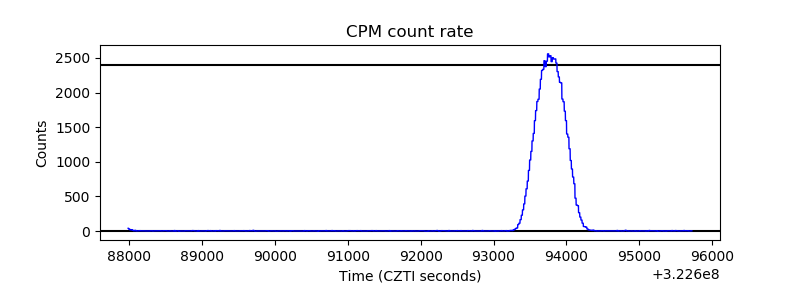 |
| CZT Counter | 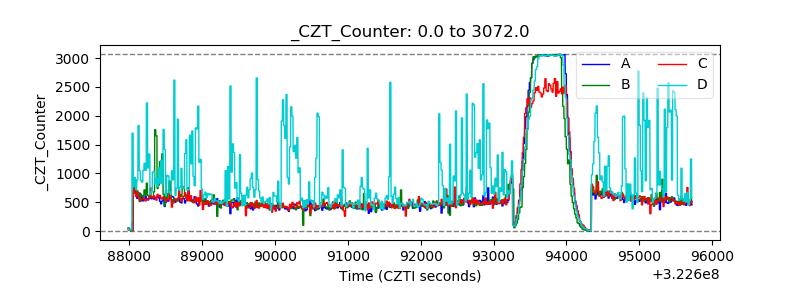 |
| +2.5 Volts monitor |  |
| +5 Volts monitor |  |
| _ROLL_ROT | 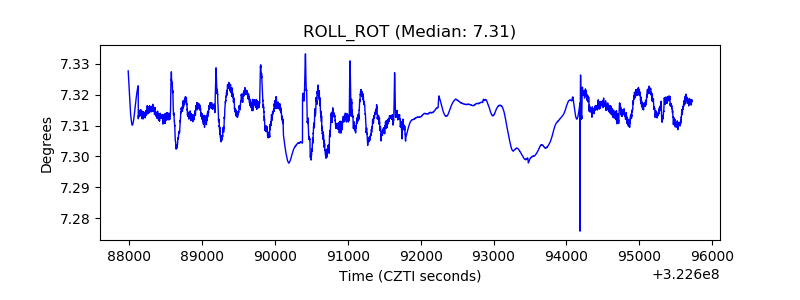 |
| _Roll_DEC | 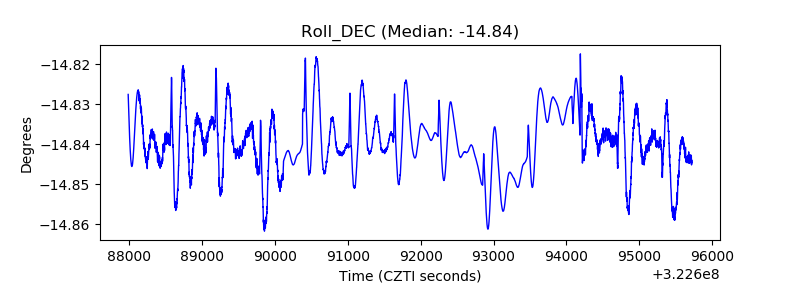 |
| _Roll_RA | 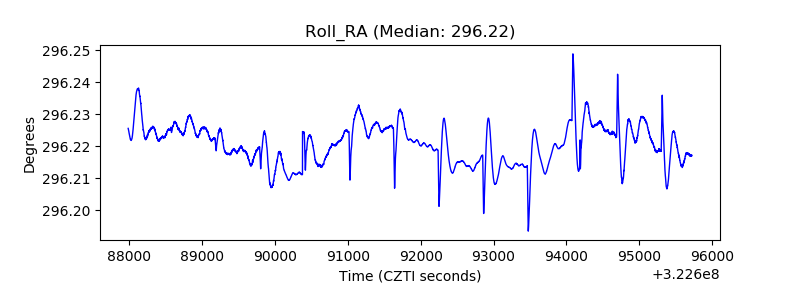 |
| Veto Counter | 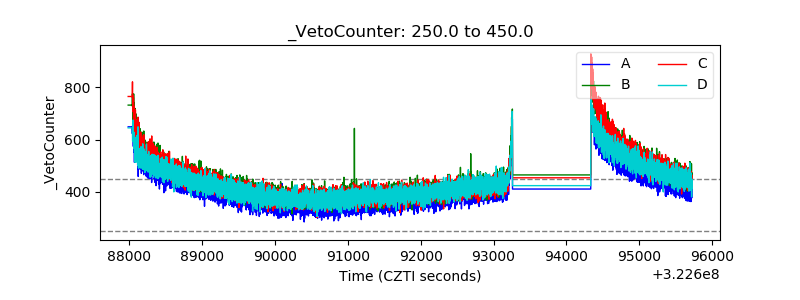 |