| Param | Original file | Final file |
|---|---|---|
| Filename | modeM0/AS1A07_118T01_9000003586_24257cztM0_level2.evt | modeM0/AS1A07_118T01_9000003586_24257cztM0_level2_quad_clean.evt |
| Size (bytes) | 563,120,640 | 92,525,760 |
| Size | 537.0 MB | 88.2 MB |
| Events in quadrant A | 3,309,980 | 602,415 |
| Events in quadrant B | 3,353,277 | 621,319 |
| Events in quadrant C | 3,340,332 | 593,859 |
| Events in quadrant D | 6,621,146 | 542,090 |
| Mode M0 | |||
|---|---|---|---|
| Quadrant | BADHDUFLAG | Total packets | Discarded packets |
| A | 0 | 13958 | 2 |
| B | 0 | 14100 | 2 |
| C | 0 | 13933 | 2 |
| D | 0 | 23994 | 2 |
| Mode SS | |||
|---|---|---|---|
| Quadrant | BADHDUFLAG | Total packets | Discarded packets |
| A | 0 | 128 | 0 |
| B | 0 | 128 | 0 |
| C | 0 | 128 | 0 |
| D | 0 | 128 | 0 |
| Mode M9 | |||
|---|---|---|---|
| Quadrant | BADHDUFLAG | Total packets | Discarded packets |
| A | 0 | 12 | 0 |
| B | 0 | 13 | 0 |
| C | 0 | 13 | 0 |
| D | 0 | 13 | 0 |
| Quadrant | Total seconds | Saturated seconds | Saturation percentage |
|---|---|---|---|
| A | 6340 | 70 | 1.104101% |
| B | 6339 | 54 | 0.851869% |
| C | 6339 | 77 | 1.214703% |
| D | 6339 | 1043 | 16.453699% |
Noise dominated data is calculated using 1-second bins in cleaned event files. If a bin has >2000 counts, and if more than 50% of those come from <1% of pixels, then it is considered to be noise-dominated and hence unusable.
| Quadrant | # 1 sec bins | Bins with >0 counts | Bins with >2000 counts | High rate bins dominated by noise | Noise dominated (total time) | Noise dominated (detector-on time) | Marked lightcurve |
|---|---|---|---|---|---|---|---|
| A | 7525 | 6340 | 32 | 32 | 0.43% | 0.50% | 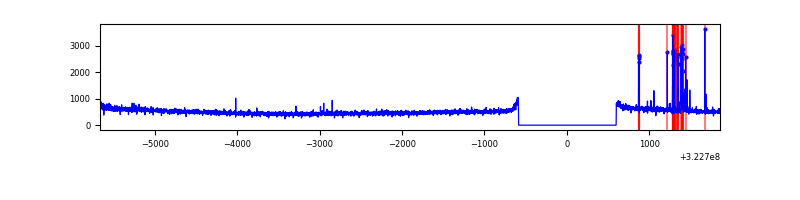 |
| B | 7524 | 6339 | 7 | 7 | 0.09% | 0.11% | 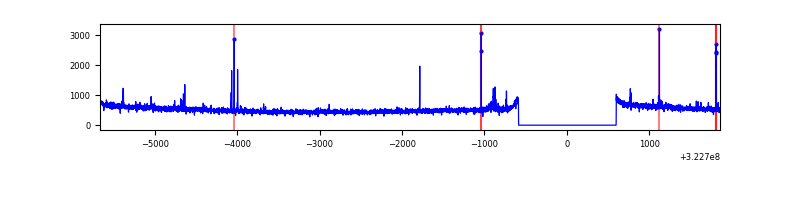 |
| C | 7524 | 6339 | 1 | 1 | 0.01% | 0.02% | 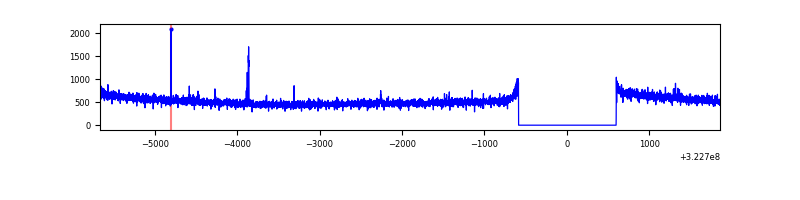 |
| D | 7524 | 6339 | 674 | 674 | 8.96% | 10.63% | 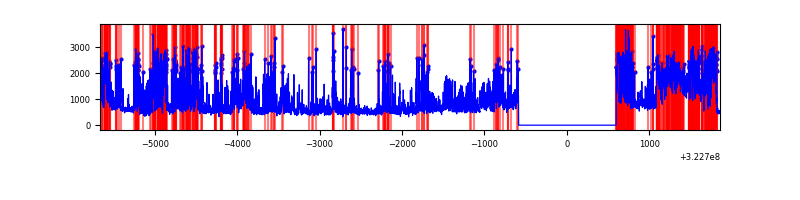 |
Top three noisy pixels from each quadrant. If the there are fewer than three noisy pixels in the level2.evt file, extra rows are filled as -1
| Pixel properties | Quadrant properties | ||||||
|---|---|---|---|---|---|---|---|
| Quadrant | DetID | PixID | Counts | Sigma | Mean | Median | Sigma |
| A | 6 | 16 | 103864 | 619.12 | 831 | 816 | 166.4 |
| A | 13 | 254 | 10179 | 56.25 | 831 | 816 | 166.4 |
| A | 0 | 226 | 7072 | 37.59 | 831 | 816 | 166.4 |
| B | 0 | 229 | 41545 | 258.48 | 837 | 816 | 157.6 |
| B | 12 | 111 | 18374 | 111.43 | 837 | 816 | 157.6 |
| B | 0 | 190 | 16379 | 98.77 | 837 | 816 | 157.6 |
| C | 14 | 238 | 129587 | 681.57 | 810 | 821 | 188.9 |
| C | 7 | 247 | 23243 | 118.68 | 810 | 821 | 188.9 |
| C | 2 | 16 | 20199 | 102.57 | 810 | 821 | 188.9 |
| D | 1 | 52 | 2489655 | 13964.66 | 739 | 719 | 178.2 |
| D | 8 | 195 | 810904 | 4545.7 | 739 | 719 | 178.2 |
| D | 7 | 238 | 412157 | 2308.45 | 739 | 719 | 178.2 |
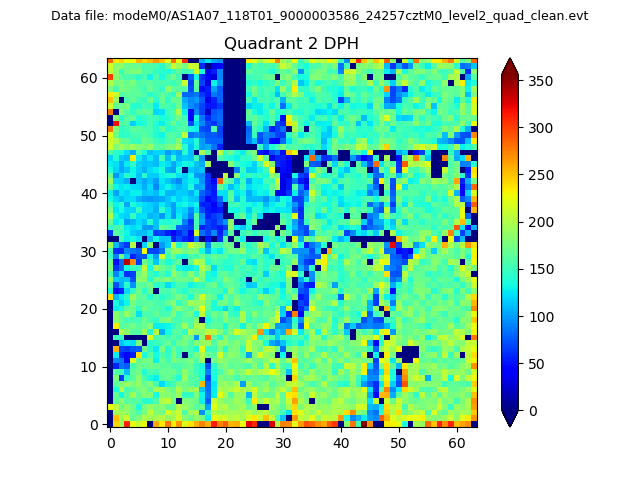
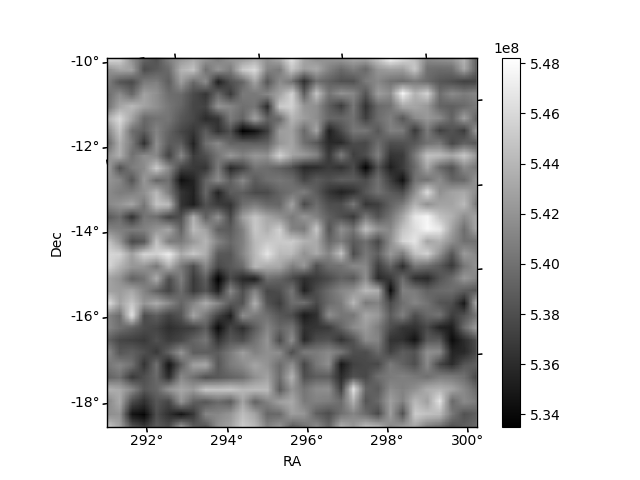
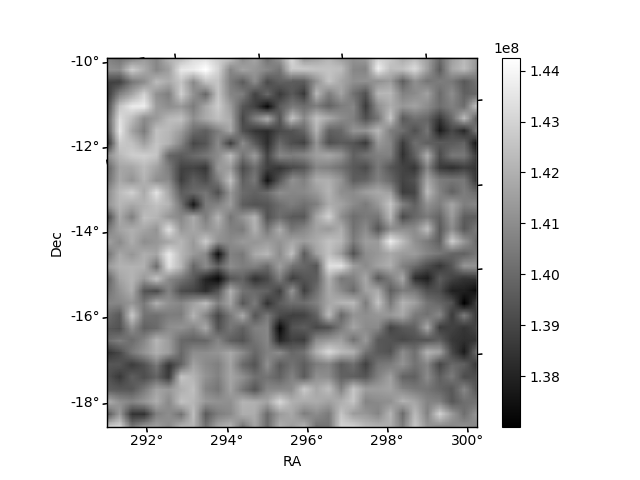
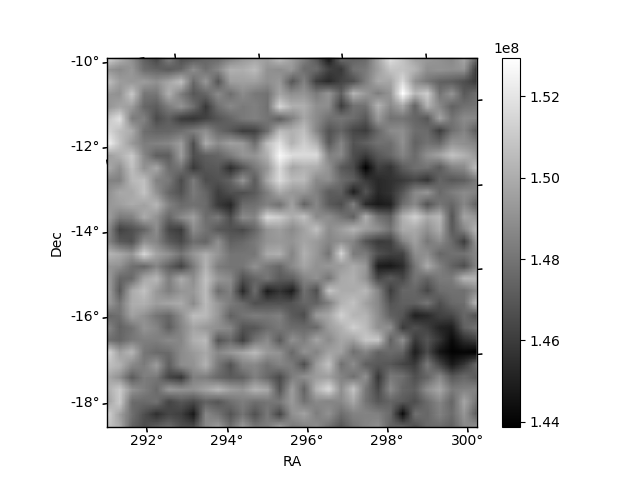
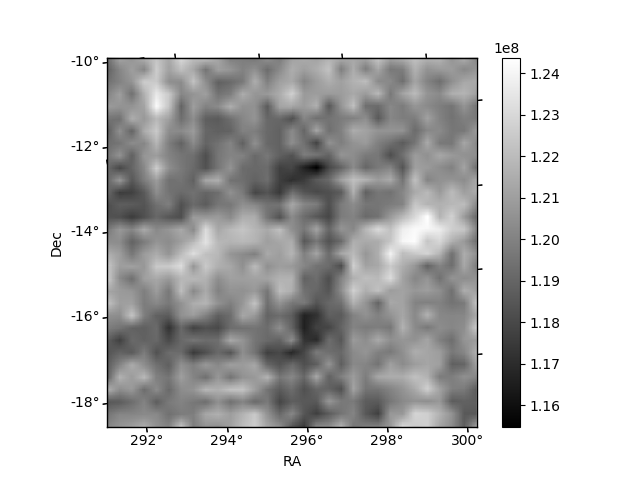
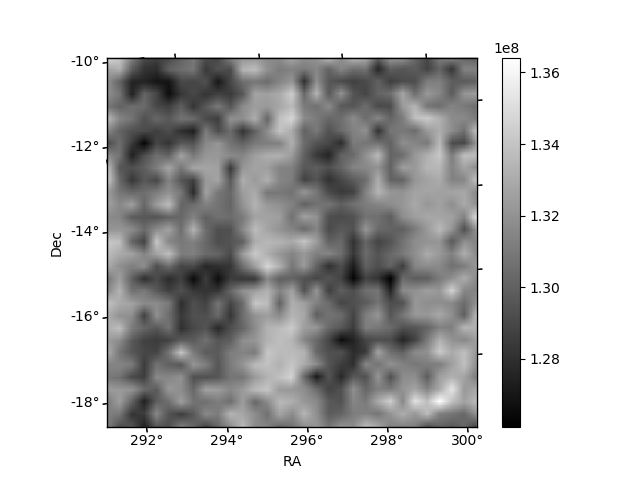
Histogram calculated using DETX and DETY for each event in the final _common_clean file
| Quadrant A | 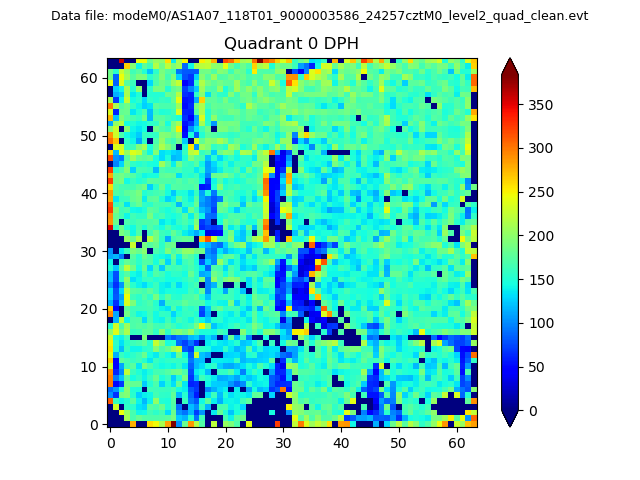 |
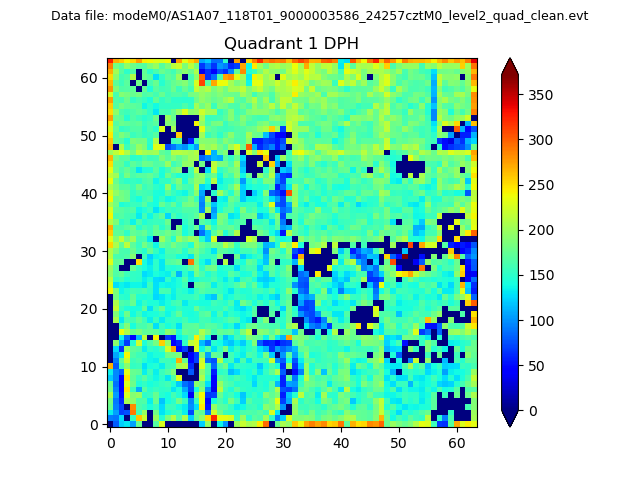 |
Quadrant B |
|---|---|---|---|
| Quadrant D | 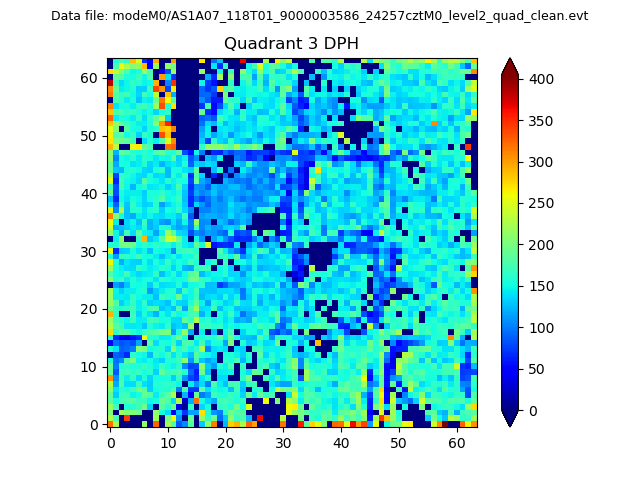 |
 |
Quadrant C |
| Plot type | Count rate plots | Images |
|---|---|---|
| Comparison with Poisson distribution Blue bars denote a histogram of data divided into 1 sec bins. Red curve is a Poisson curve with rate = median count rate of data. |
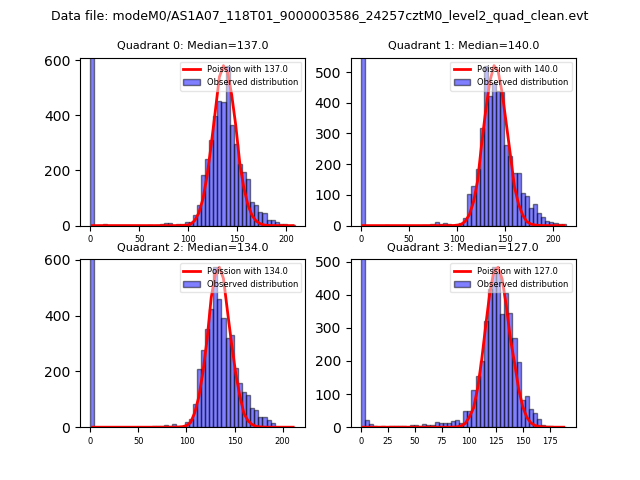 |
 |
| Quadrant-wise count rates Data is divided into 100 sec bins |
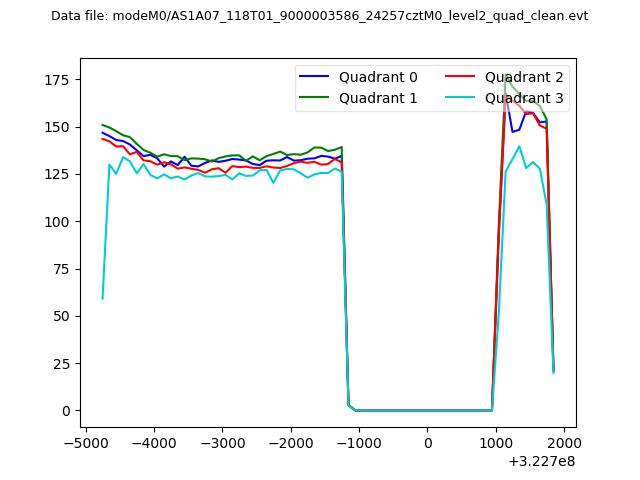 |
|
| Module-wise count rates for Quadrant A Data is divided into 100 sec bins |
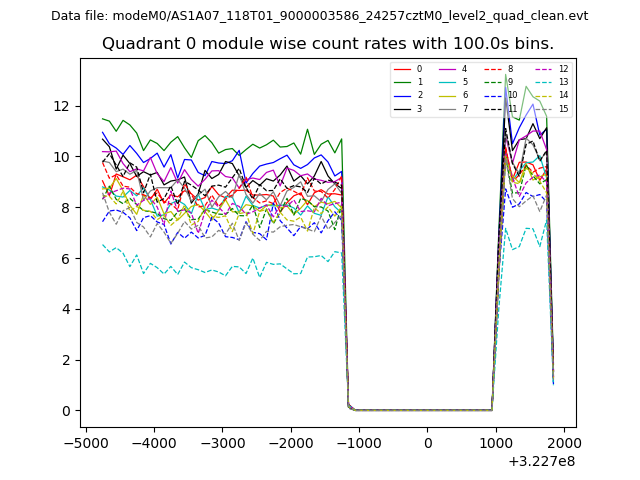 |
 |
| Module-wise count rates for Quadrant B Data is divided into 100 sec bins |
 |
 |
| Module-wise count rates for Quadrant C Data is divided into 100 sec bins |
 |
 |
| Module-wise count rates for Quadrant D Data is divided into 100 sec bins |
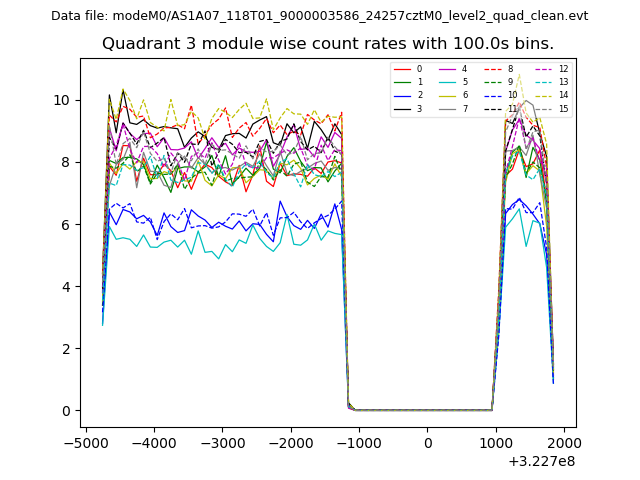 |
 |
| Parameter | Plot |
|---|---|
| CZT HV Monitor |  |
| D_VDD | 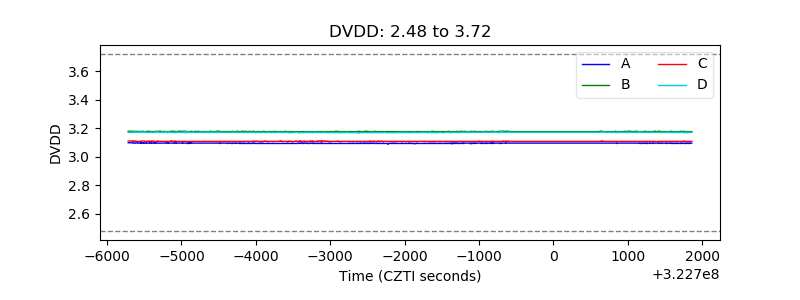 |
| Temperature 1 | 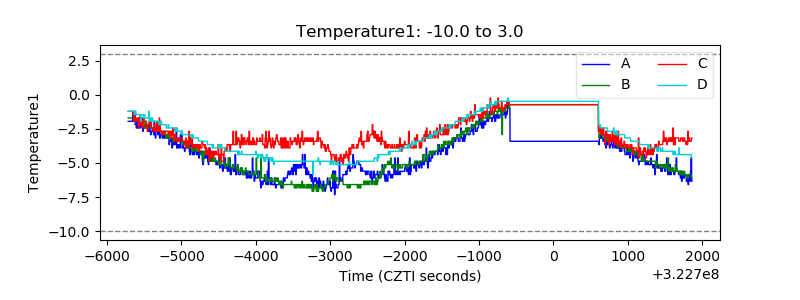 |
| Veto HV Monitor | 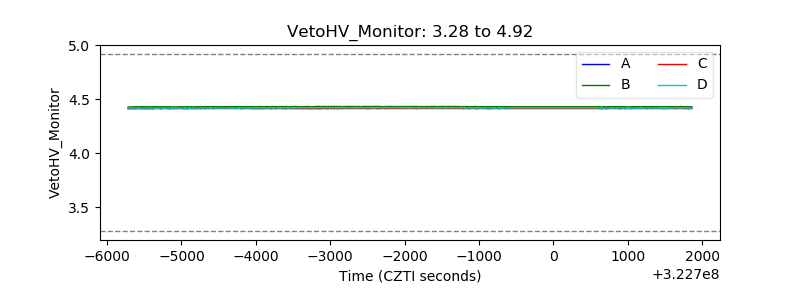 |
| Veto LLD | 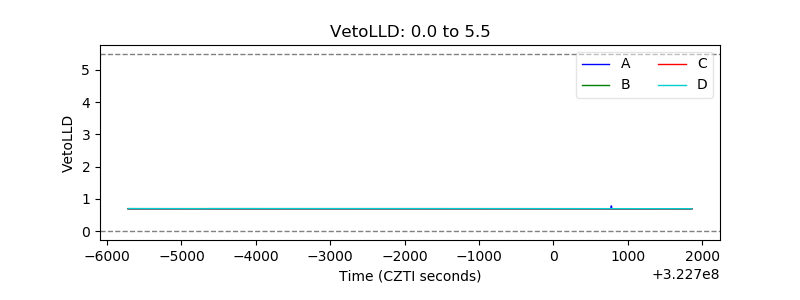 |
| Alpha Counter | 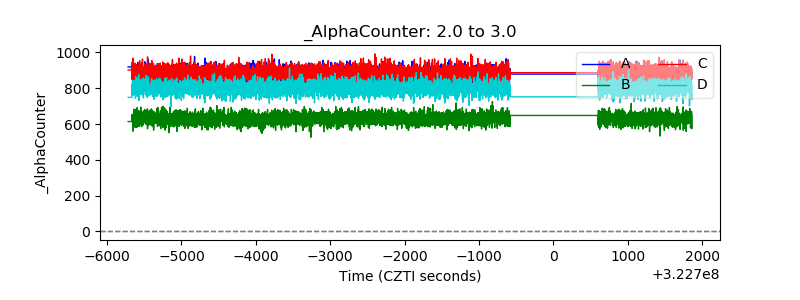 |
| _CPM_Rate | 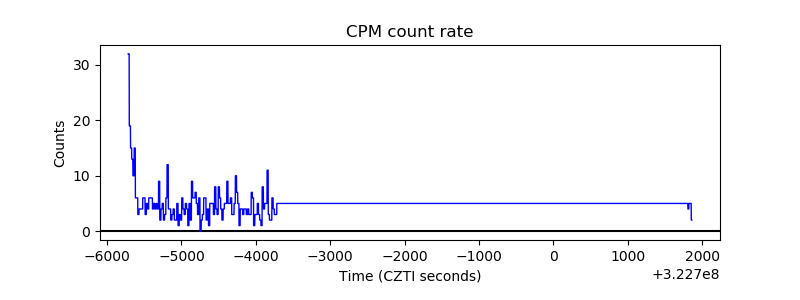 |
| CZT Counter | 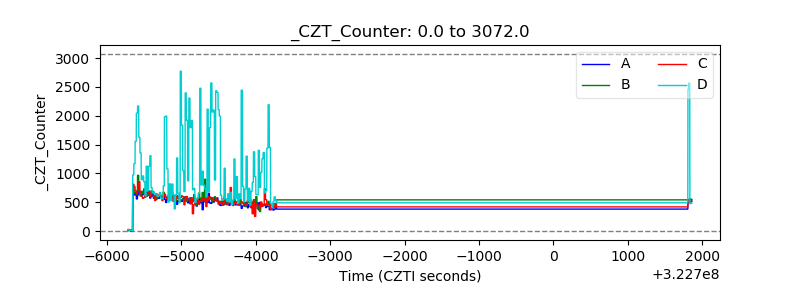 |
| +2.5 Volts monitor |  |
| +5 Volts monitor |  |
| _ROLL_ROT | 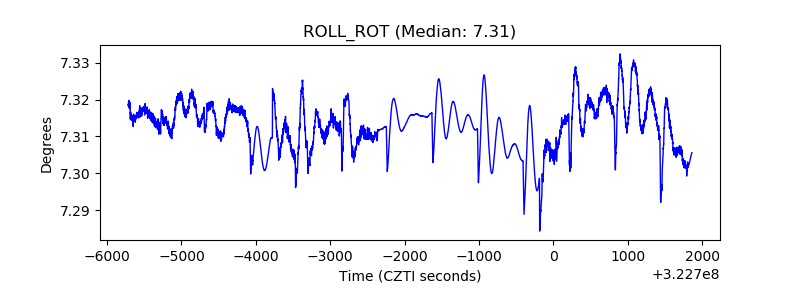 |
| _Roll_DEC | 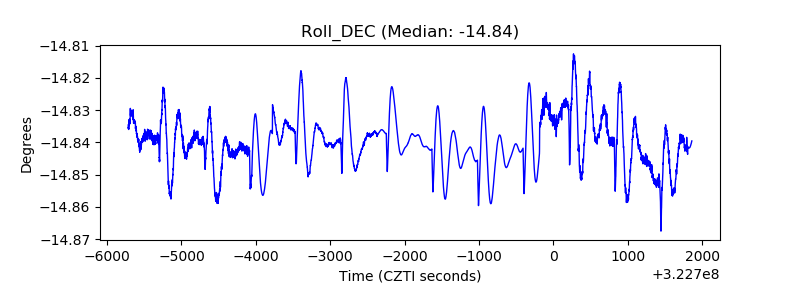 |
| _Roll_RA | 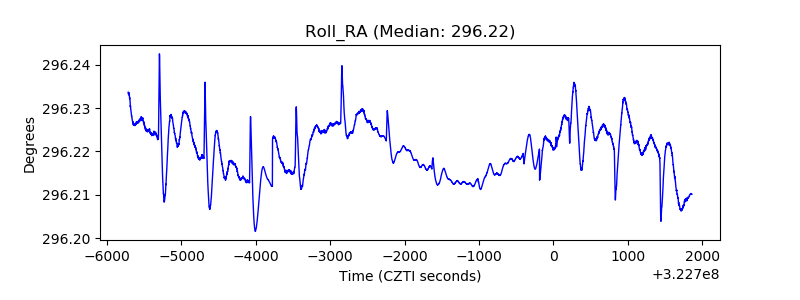 |
| Veto Counter | 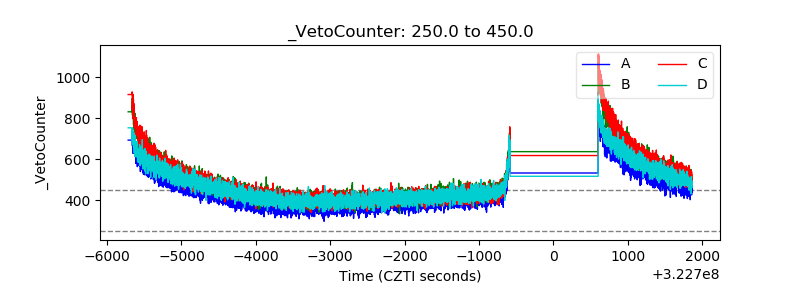 |