| Param | Original file | Final file |
|---|---|---|
| Filename | modeM0/AS1A07_118T01_9000003586_24258cztM0_level2.evt | modeM0/AS1A07_118T01_9000003586_24258cztM0_level2_quad_clean.evt |
| Size (bytes) | 557,029,440 | 109,330,560 |
| Size | 531.2 MB | 104.3 MB |
| Events in quadrant A | 3,463,135 | 725,928 |
| Events in quadrant B | 3,486,154 | 755,838 |
| Events in quadrant C | 3,427,878 | 723,350 |
| Events in quadrant D | 6,066,987 | 667,443 |
| Mode M0 | |||
|---|---|---|---|
| Quadrant | BADHDUFLAG | Total packets | Discarded packets |
| A | 0 | 14318 | 2 |
| B | 0 | 14399 | 2 |
| C | 0 | 14140 | 2 |
| D | 0 | 22389 | 2 |
| Mode SS | |||
|---|---|---|---|
| Quadrant | BADHDUFLAG | Total packets | Discarded packets |
| A | 0 | 126 | 0 |
| B | 0 | 126 | 0 |
| C | 0 | 126 | 0 |
| D | 0 | 126 | 0 |
| Mode M9 | |||
|---|---|---|---|
| Quadrant | BADHDUFLAG | Total packets | Discarded packets |
| A | 0 | 13 | 0 |
| B | 0 | 14 | 0 |
| C | 0 | 14 | 0 |
| D | 0 | 14 | 0 |
| Quadrant | Total seconds | Saturated seconds | Saturation percentage |
|---|---|---|---|
| A | 6291 | 79 | 1.255762% |
| B | 6291 | 87 | 1.382928% |
| C | 6291 | 85 | 1.351137% |
| D | 6291 | 547 | 8.694961% |
Noise dominated data is calculated using 1-second bins in cleaned event files. If a bin has >2000 counts, and if more than 50% of those come from <1% of pixels, then it is considered to be noise-dominated and hence unusable.
| Quadrant | # 1 sec bins | Bins with >0 counts | Bins with >2000 counts | High rate bins dominated by noise | Noise dominated (total time) | Noise dominated (detector-on time) | Marked lightcurve |
|---|---|---|---|---|---|---|---|
| A | 7576 | 6291 | 36 | 36 | 0.48% | 0.57% | 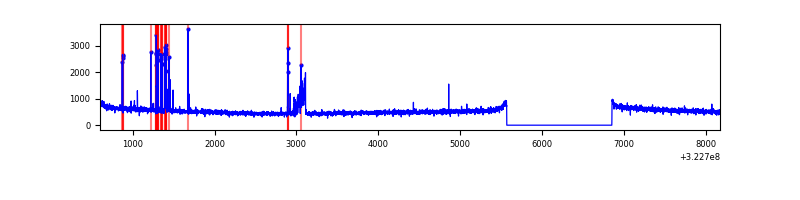 |
| B | 7576 | 6291 | 12 | 12 | 0.16% | 0.19% | 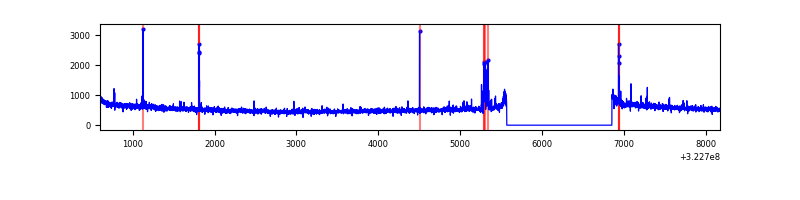 |
| C | 7576 | 6292 | 0 | 0 | 0.00% | 0.00% | 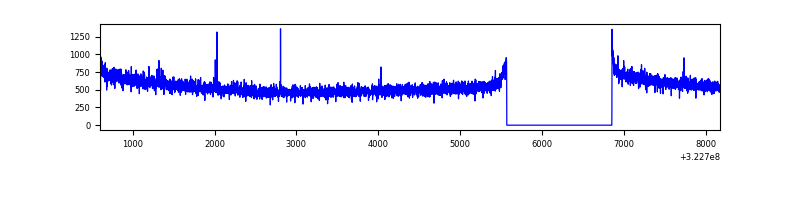 |
| D | 7576 | 6292 | 448 | 448 | 5.91% | 7.12% | 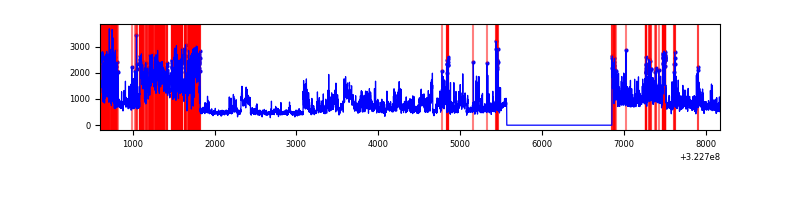 |
Top three noisy pixels from each quadrant. If the there are fewer than three noisy pixels in the level2.evt file, extra rows are filled as -1
| Pixel properties | Quadrant properties | ||||||
|---|---|---|---|---|---|---|---|
| Quadrant | DetID | PixID | Counts | Sigma | Mean | Median | Sigma |
| A | 6 | 16 | 194805 | 1157.27 | 848 | 831 | 167.6 |
| A | 13 | 254 | 9903 | 54.12 | 848 | 831 | 167.6 |
| A | 0 | 226 | 7239 | 38.23 | 848 | 831 | 167.6 |
| B | 12 | 17 | 82585 | 512.34 | 857 | 837 | 159.6 |
| B | 0 | 229 | 28155 | 171.21 | 857 | 837 | 159.6 |
| B | 12 | 111 | 18381 | 109.95 | 857 | 837 | 159.6 |
| C | 14 | 238 | 133674 | 687.78 | 833 | 841 | 193.1 |
| C | 7 | 247 | 22168 | 110.43 | 833 | 841 | 193.1 |
| C | 2 | 16 | 15736 | 77.12 | 833 | 841 | 193.1 |
| D | 8 | 195 | 1129725 | 5802.96 | 804 | 783 | 194.5 |
| D | 1 | 52 | 900106 | 4622.68 | 804 | 783 | 194.5 |
| D | 7 | 238 | 516840 | 2652.62 | 804 | 783 | 194.5 |
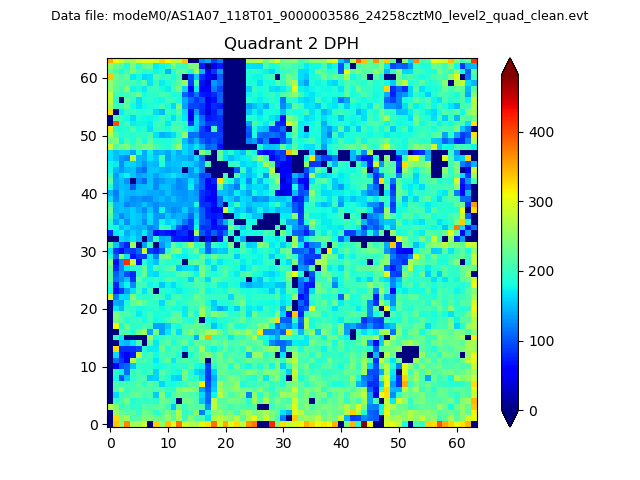
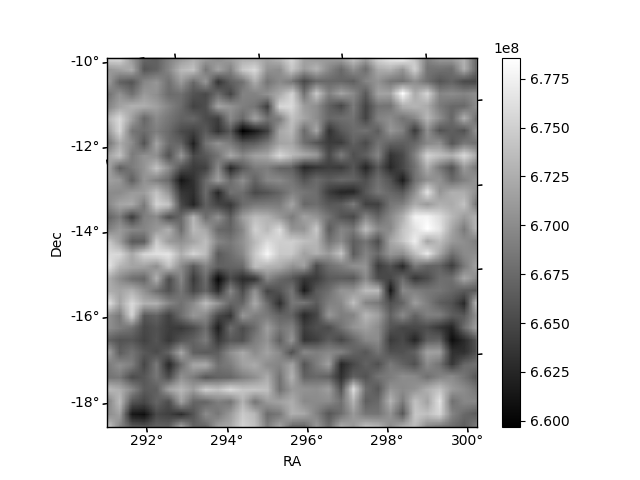
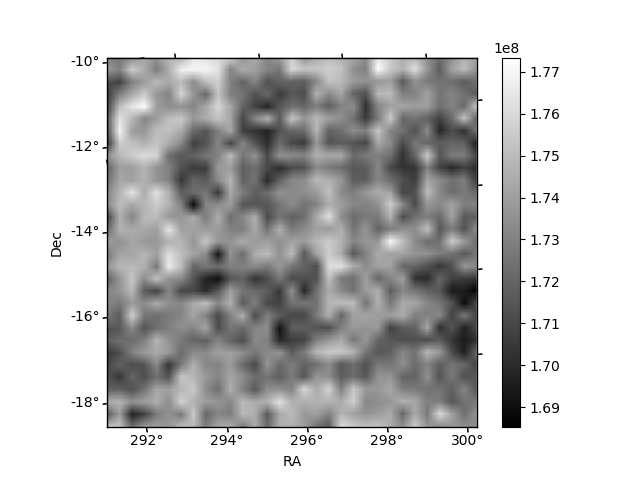
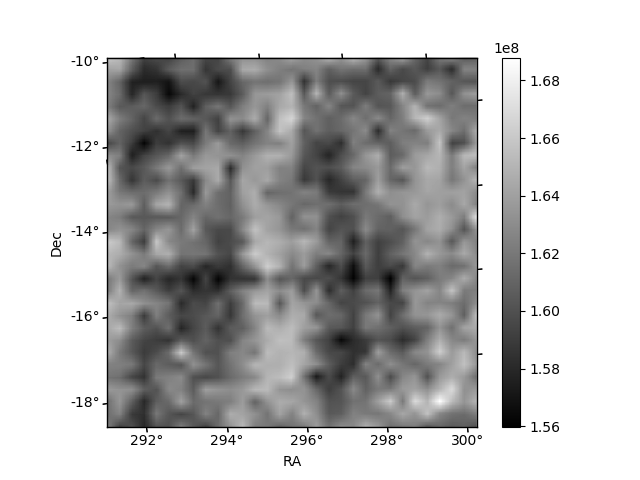
Histogram calculated using DETX and DETY for each event in the final _common_clean file
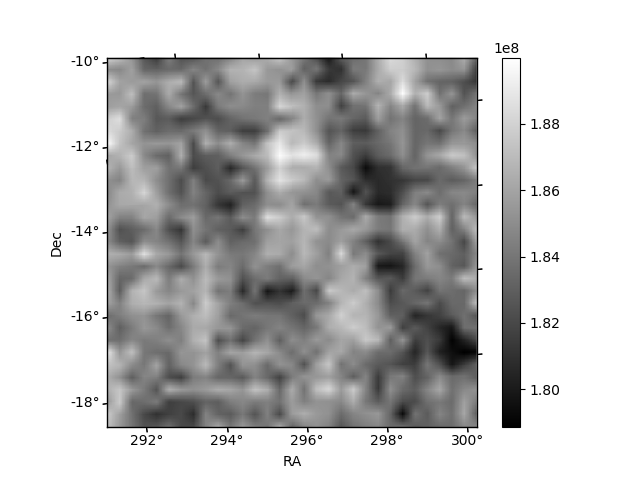
| Quadrant A | 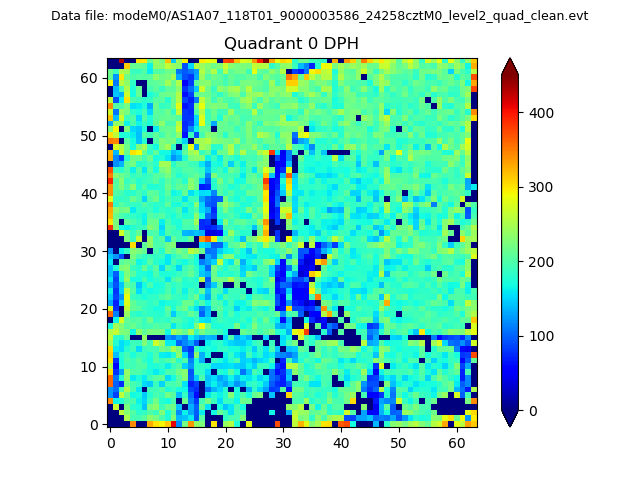 |
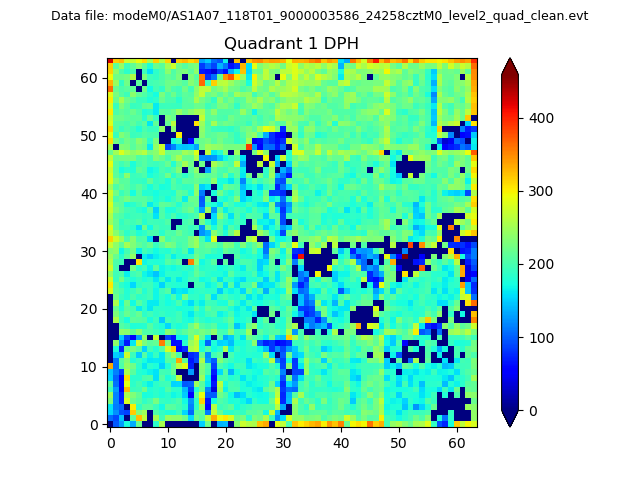 |
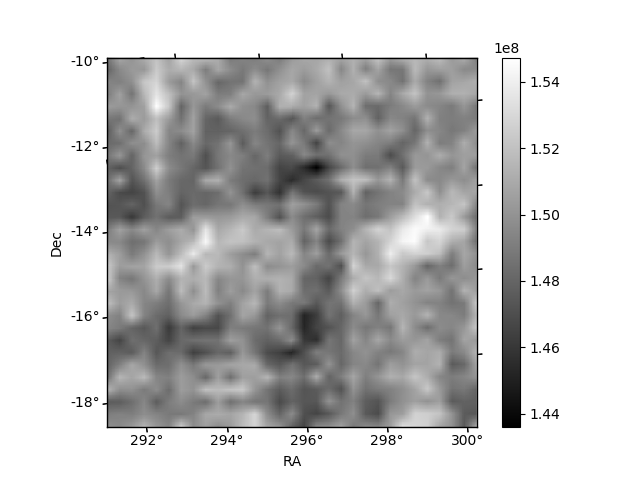
Quadrant B |
|---|---|---|---|
| Quadrant D | 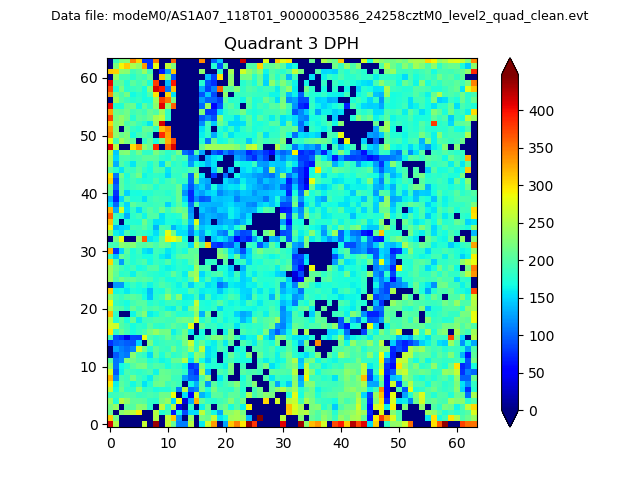 |
 |
Quadrant C |
| Plot type | Count rate plots | Images |
|---|---|---|
| Comparison with Poisson distribution Blue bars denote a histogram of data divided into 1 sec bins. Red curve is a Poisson curve with rate = median count rate of data. |
 |
 |
| Quadrant-wise count rates Data is divided into 100 sec bins |
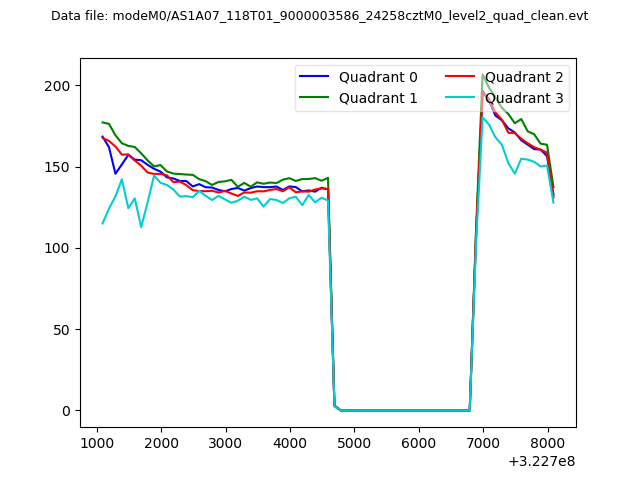 |
|
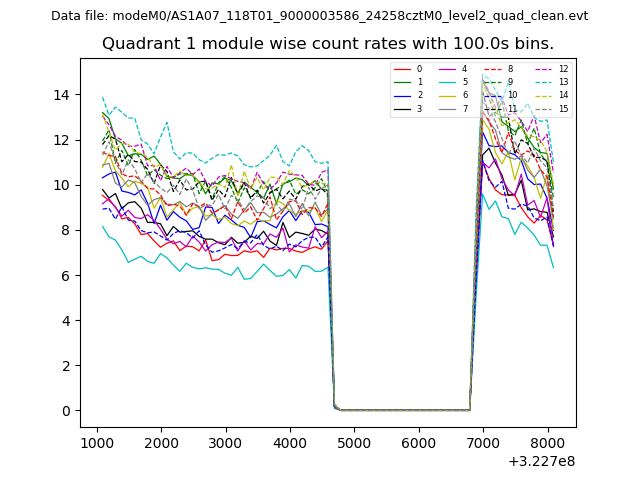
| Module-wise count rates for Quadrant A Data is divided into 100 sec bins |
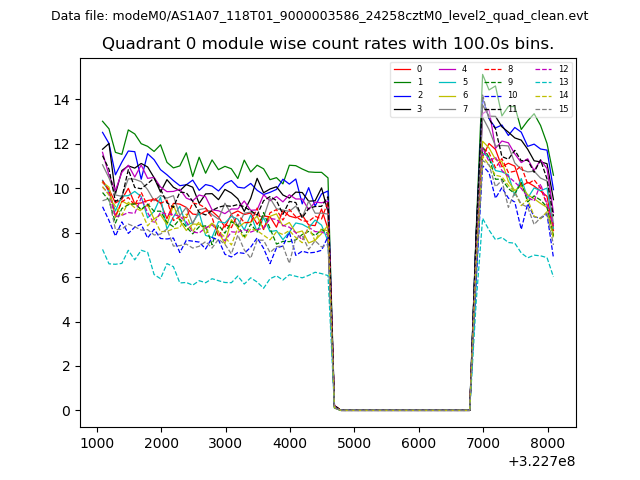 |
 |
| Module-wise count rates for Quadrant B Data is divided into 100 sec bins |
 |
 |
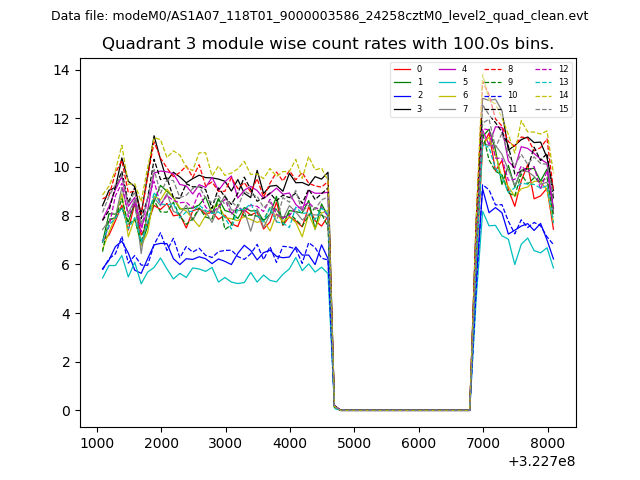
| Module-wise count rates for Quadrant C Data is divided into 100 sec bins |
 |
 |
| Module-wise count rates for Quadrant D Data is divided into 100 sec bins |
 |
 |
| Parameter | Plot |
|---|---|
| CZT HV Monitor |  |
| D_VDD | 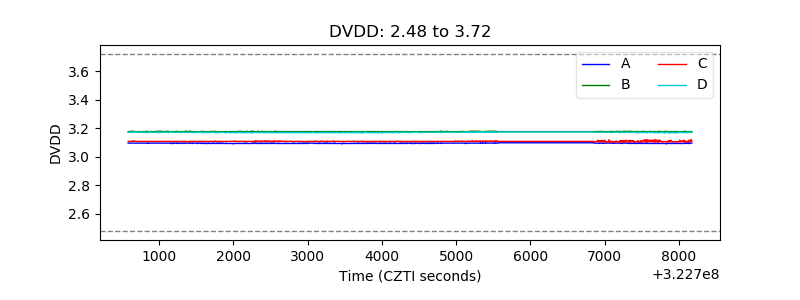 |
| Temperature 1 | 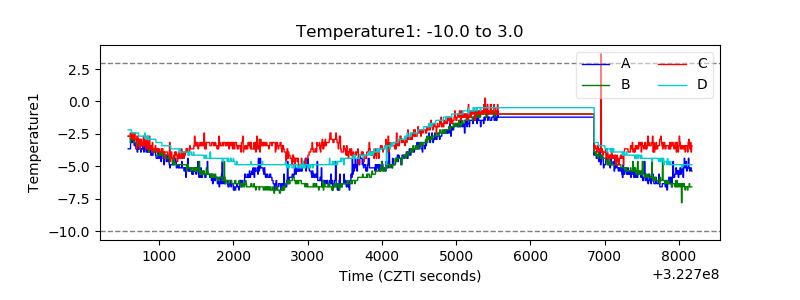 |
| Veto HV Monitor | 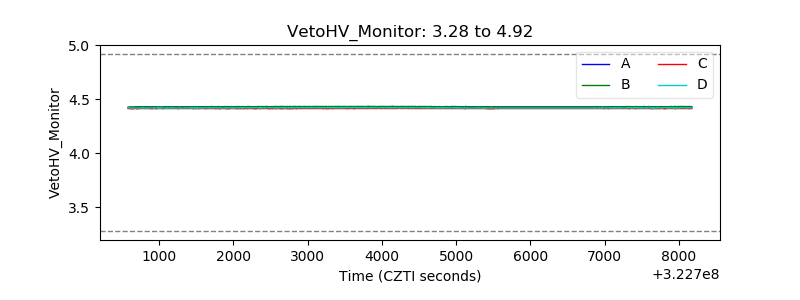 |
| Veto LLD | 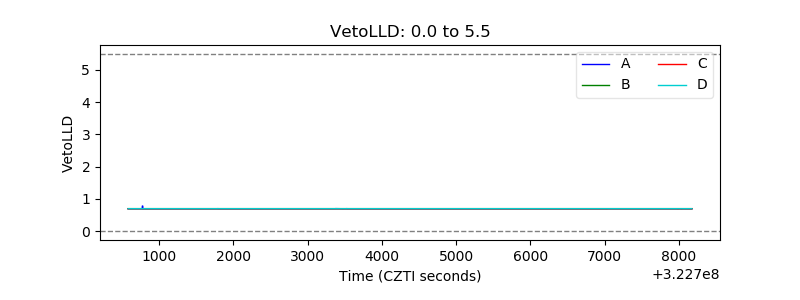 |
| Alpha Counter | 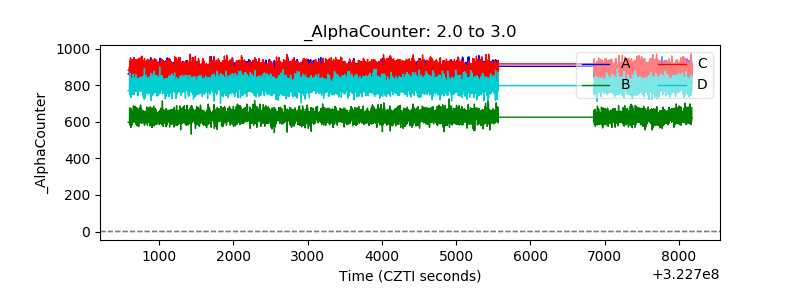 |
| _CPM_Rate | 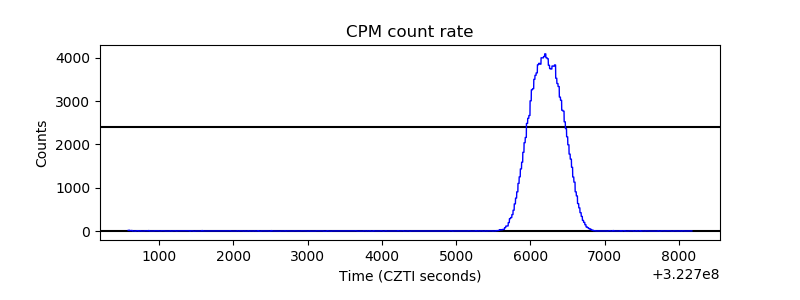 |
| CZT Counter | 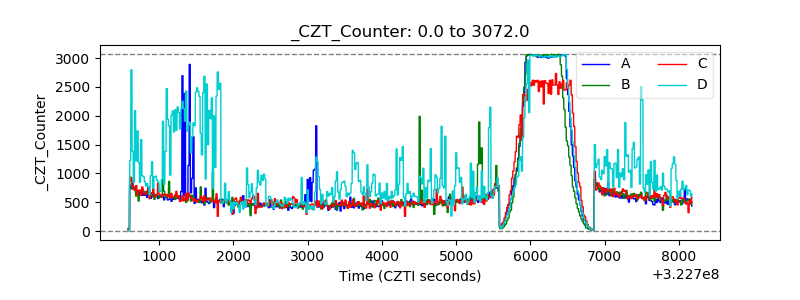 |
| +2.5 Volts monitor |  |
| +5 Volts monitor |  |
| _ROLL_ROT |  |
| _Roll_DEC | 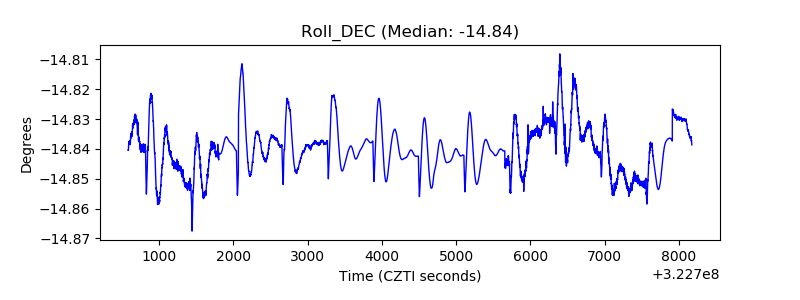 |
| _Roll_RA | 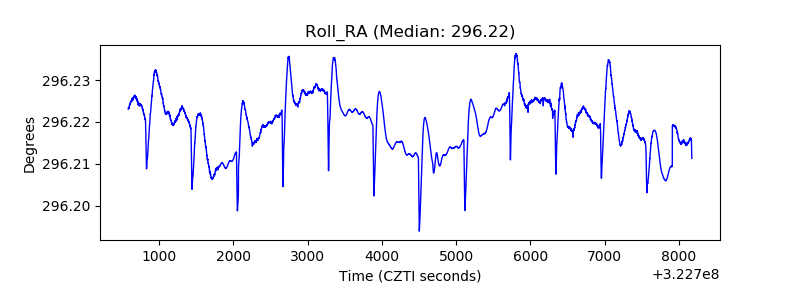 |
| Veto Counter | 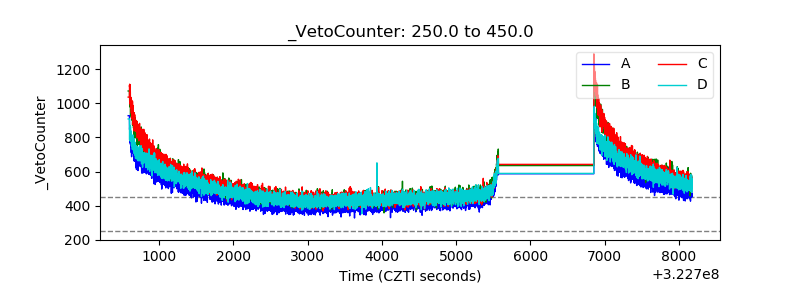 |