| Param | Original file | Final file |
|---|---|---|
| Filename | modeM0/AS1A07_118T01_9000003586_24259cztM0_level2.evt | modeM0/AS1A07_118T01_9000003586_24259cztM0_level2_quad_clean.evt |
| Size (bytes) | 526,838,400 | 115,018,560 |
| Size | 502.4 MB | 109.7 MB |
| Events in quadrant A | 3,255,626 | 769,935 |
| Events in quadrant B | 3,447,511 | 800,984 |
| Events in quadrant C | 3,483,353 | 764,452 |
| Events in quadrant D | 5,351,008 | 717,661 |
| Mode M0 | |||
|---|---|---|---|
| Quadrant | BADHDUFLAG | Total packets | Discarded packets |
| A | 0 | 13489 | 2 |
| B | 0 | 14117 | 3 |
| C | 0 | 14154 | 2 |
| D | 0 | 20284 | 2 |
| Mode SS | |||
|---|---|---|---|
| Quadrant | BADHDUFLAG | Total packets | Discarded packets |
| A | 0 | 124 | 0 |
| B | 0 | 124 | 0 |
| C | 0 | 124 | 0 |
| D | 0 | 124 | 0 |
| Mode M9 | |||
|---|---|---|---|
| Quadrant | BADHDUFLAG | Total packets | Discarded packets |
| A | 0 | 19 | 0 |
| B | 0 | 20 | 0 |
| C | 0 | 20 | 0 |
| D | 0 | 20 | 0 |
| Quadrant | Total seconds | Saturated seconds | Saturation percentage |
|---|---|---|---|
| A | 6173 | 43 | 0.696582% |
| B | 6172 | 87 | 1.409592% |
| C | 6172 | 133 | 2.154893% |
| D | 6172 | 319 | 5.168503% |
Noise dominated data is calculated using 1-second bins in cleaned event files. If a bin has >2000 counts, and if more than 50% of those come from <1% of pixels, then it is considered to be noise-dominated and hence unusable.
| Quadrant | # 1 sec bins | Bins with >0 counts | Bins with >2000 counts | High rate bins dominated by noise | Noise dominated (total time) | Noise dominated (detector-on time) | Marked lightcurve |
|---|---|---|---|---|---|---|---|
| A | 7508 | 6173 | 0 | 0 | 0.00% | 0.00% | 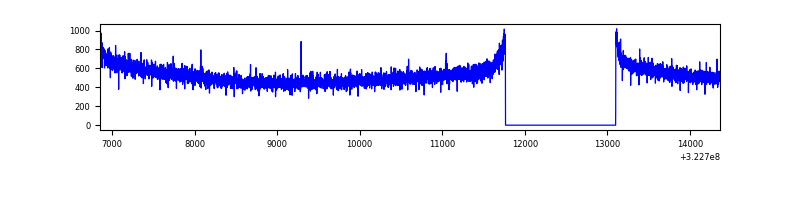 |
| B | 7507 | 6172 | 6 | 6 | 0.08% | 0.10% | 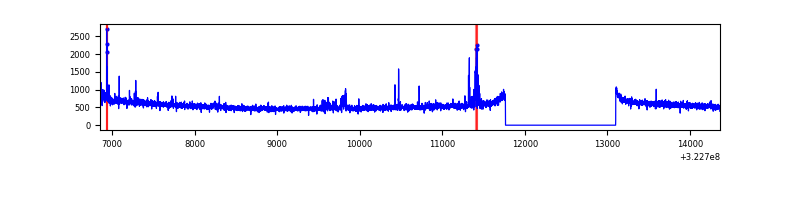 |
| C | 7507 | 6173 | 26 | 26 | 0.35% | 0.42% | 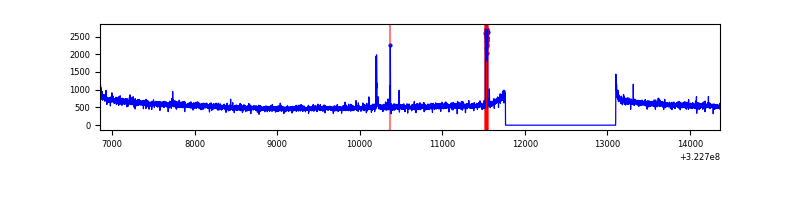 |
| D | 7507 | 6172 | 248 | 248 | 3.30% | 4.02% | 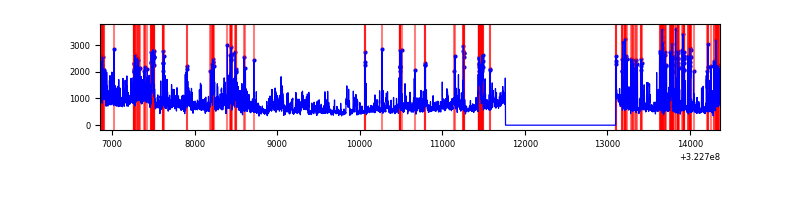 |
Top three noisy pixels from each quadrant. If the there are fewer than three noisy pixels in the level2.evt file, extra rows are filled as -1
| Pixel properties | Quadrant properties | ||||||
|---|---|---|---|---|---|---|---|
| Quadrant | DetID | PixID | Counts | Sigma | Mean | Median | Sigma |
| A | 13 | 254 | 9727 | 53.09 | 845 | 829 | 167.6 |
| A | 0 | 226 | 7437 | 39.43 | 845 | 829 | 167.6 |
| A | 3 | 137 | 6923 | 36.36 | 845 | 829 | 167.6 |
| B | 0 | 245 | 44149 | 271.67 | 855 | 835 | 159.4 |
| B | 0 | 230 | 27583 | 167.76 | 855 | 835 | 159.4 |
| B | 12 | 111 | 18082 | 108.17 | 855 | 835 | 159.4 |
| C | 14 | 238 | 132585 | 684.71 | 828 | 836 | 192.4 |
| C | 3 | 233 | 64490 | 330.82 | 828 | 836 | 192.4 |
| C | 2 | 16 | 31996 | 161.94 | 828 | 836 | 192.4 |
| D | 8 | 195 | 874007 | 4418.83 | 818 | 799 | 197.6 |
| D | 1 | 52 | 555274 | 2805.9 | 818 | 799 | 197.6 |
| D | 12 | 32 | 273849 | 1381.76 | 818 | 799 | 197.6 |
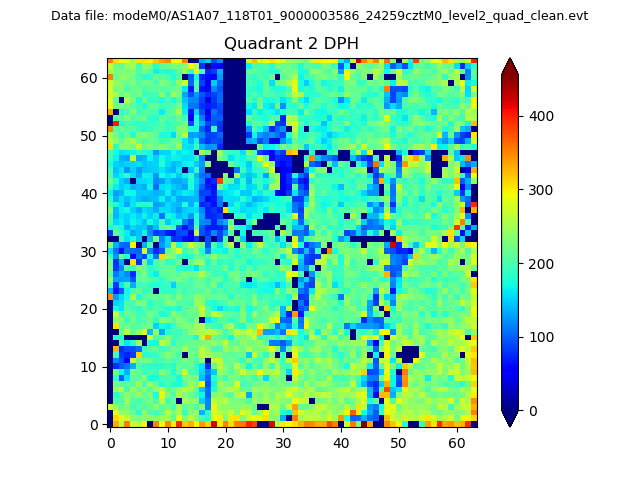
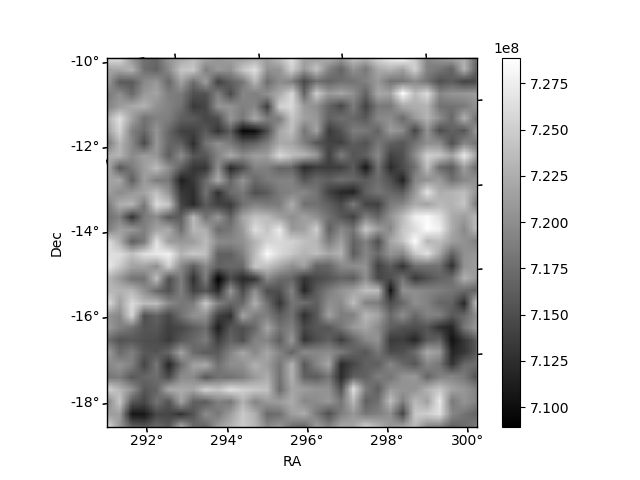
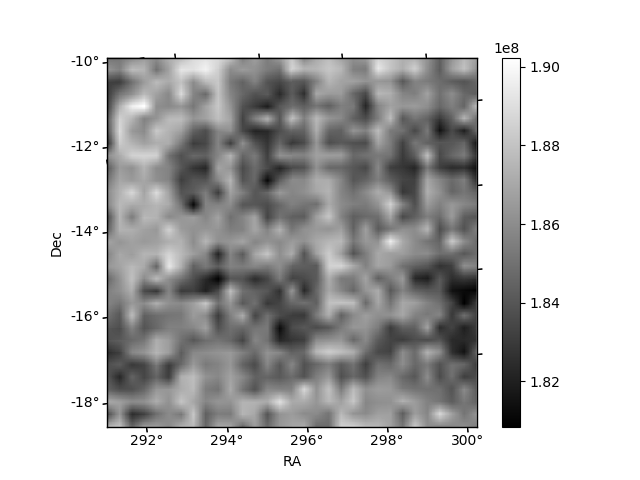
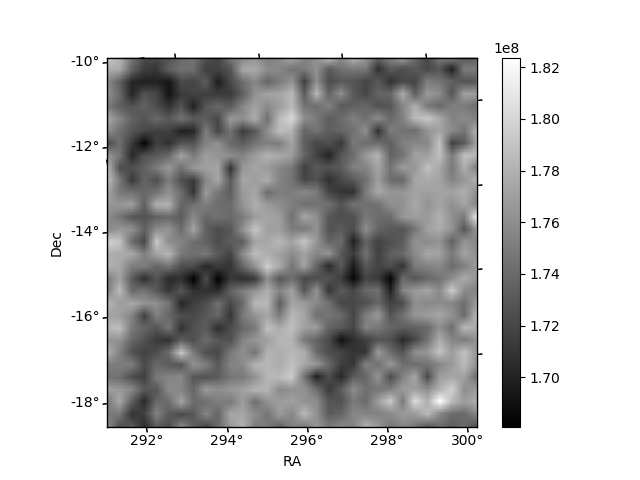
Histogram calculated using DETX and DETY for each event in the final _common_clean file
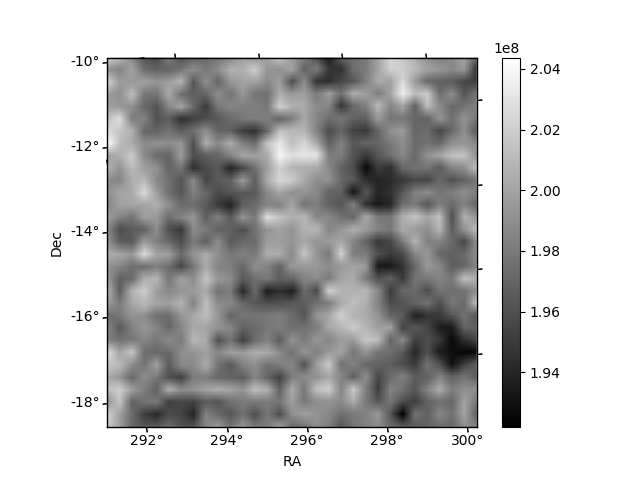
| Quadrant A | 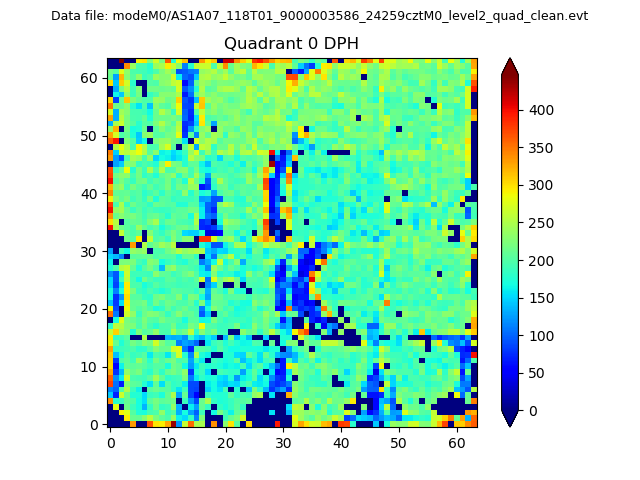 |
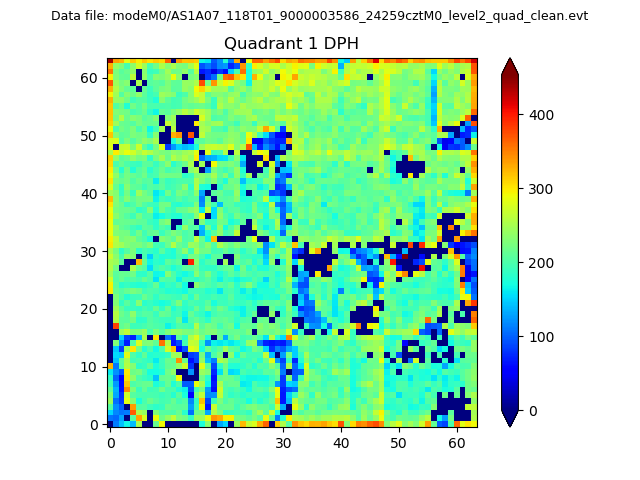 |
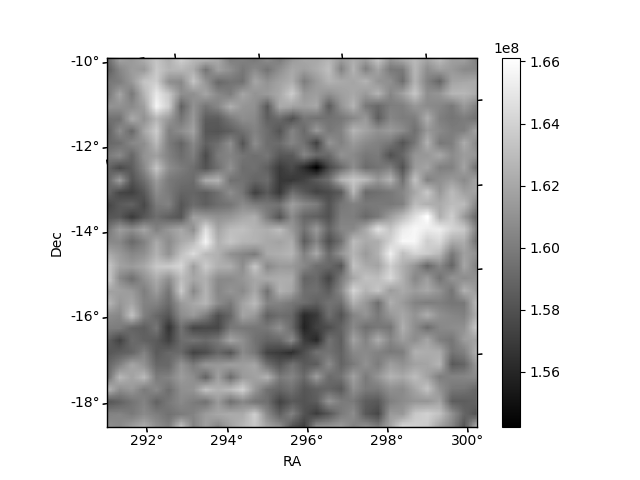
Quadrant B |
|---|---|---|---|
| Quadrant D | 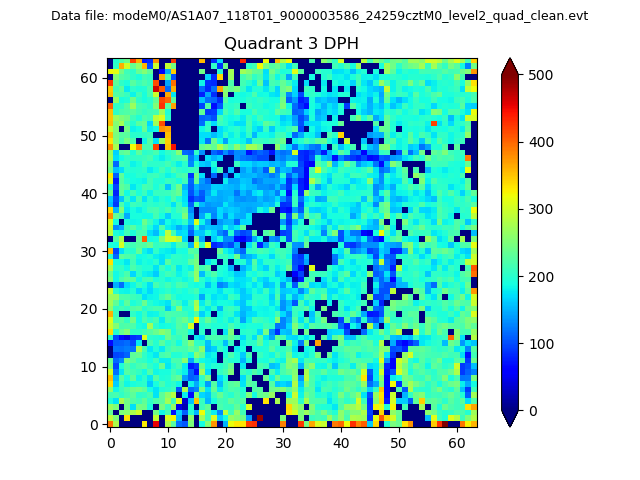 |
 |
Quadrant C |
| Plot type | Count rate plots | Images |
|---|---|---|
| Comparison with Poisson distribution Blue bars denote a histogram of data divided into 1 sec bins. Red curve is a Poisson curve with rate = median count rate of data. |
 |
 |
| Quadrant-wise count rates Data is divided into 100 sec bins |
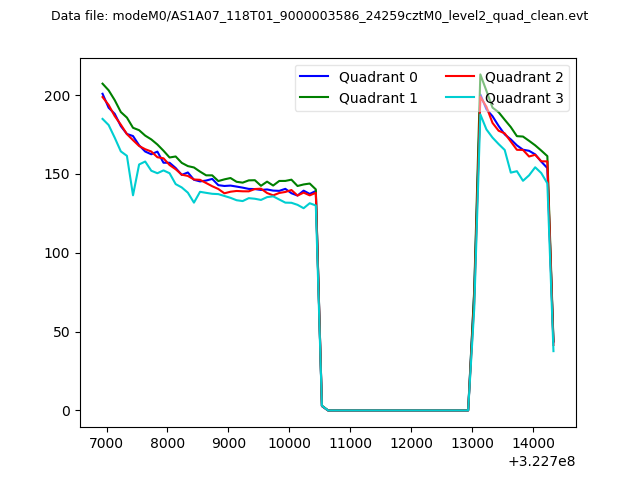 |
|
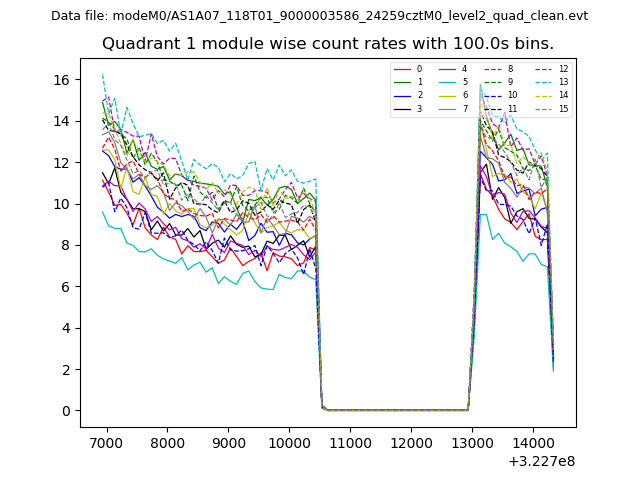
| Module-wise count rates for Quadrant A Data is divided into 100 sec bins |
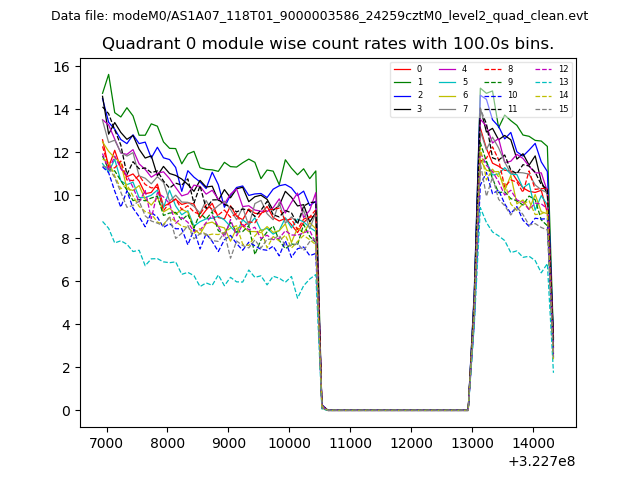 |
 |
| Module-wise count rates for Quadrant B Data is divided into 100 sec bins |
 |
 |
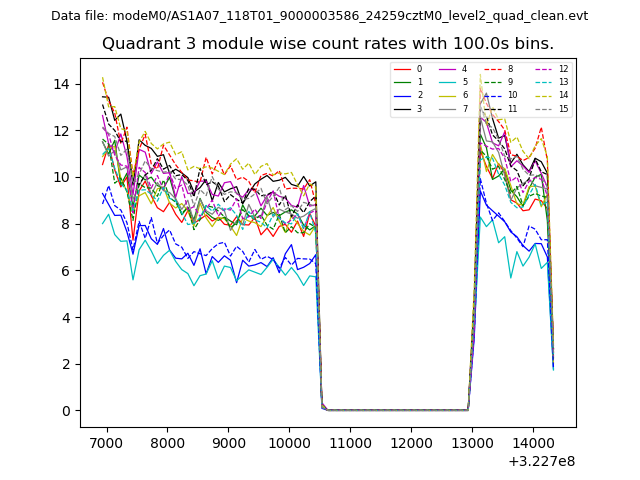
| Module-wise count rates for Quadrant C Data is divided into 100 sec bins |
 |
 |
| Module-wise count rates for Quadrant D Data is divided into 100 sec bins |
 |
 |
| Parameter | Plot |
|---|---|
| CZT HV Monitor |  |
| D_VDD | 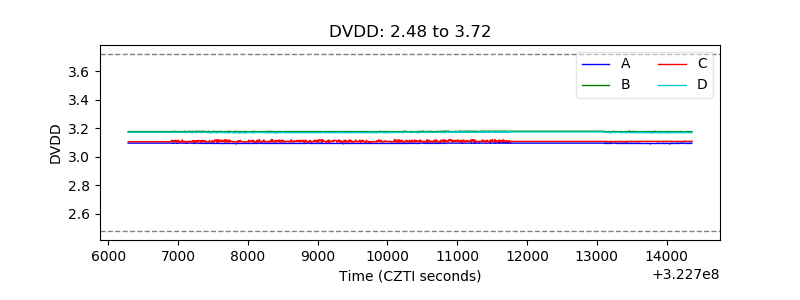 |
| Temperature 1 | 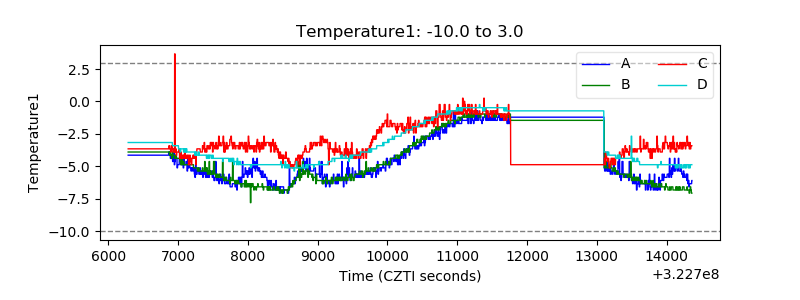 |
| Veto HV Monitor | 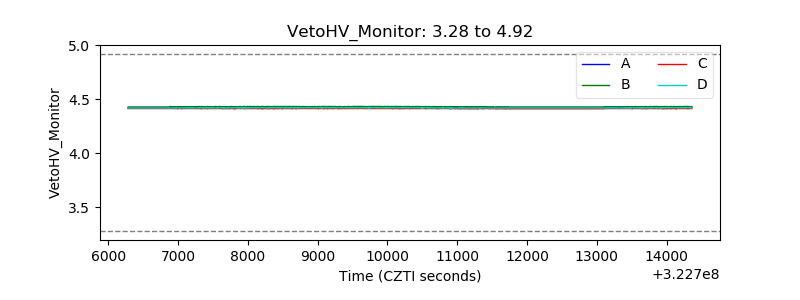 |
| Veto LLD | 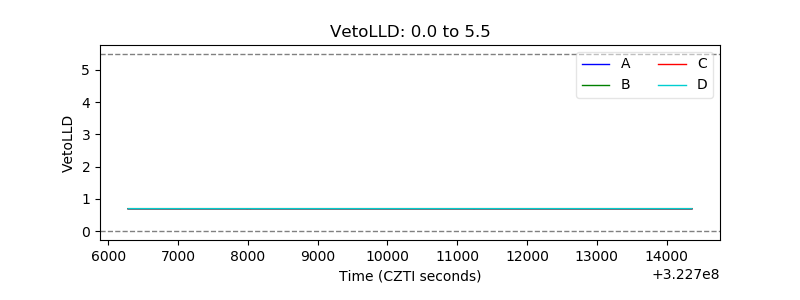 |
| Alpha Counter |  |
| _CPM_Rate | 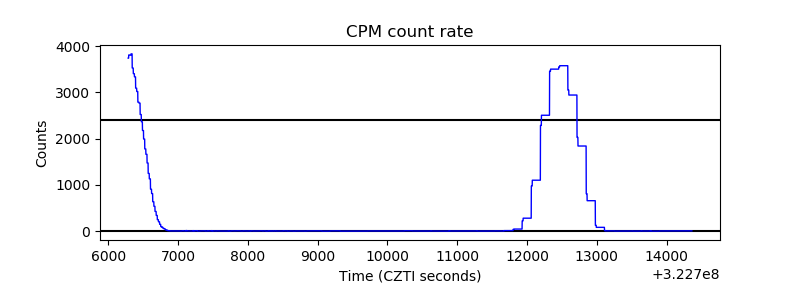 |
| CZT Counter | 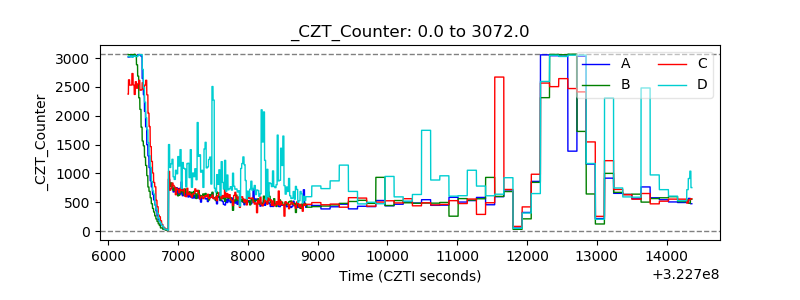 |
| +2.5 Volts monitor |  |
| +5 Volts monitor |  |
| _ROLL_ROT |  |
| _Roll_DEC | 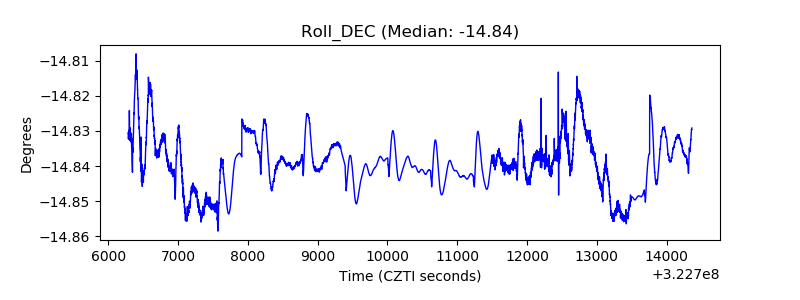 |
| _Roll_RA | 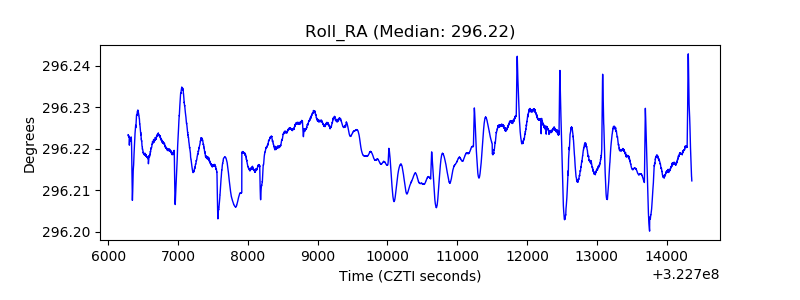 |
| Veto Counter |  |