| Param | Original file | Final file |
|---|---|---|
| Filename | modeM0/AS1A07_118T01_9000003586_24261cztM0_level2.evt | modeM0/AS1A07_118T01_9000003586_24261cztM0_level2_quad_clean.evt |
| Size (bytes) | 526,092,480 | 103,824,000 |
| Size | 501.7 MB | 99.0 MB |
| Events in quadrant A | 3,355,380 | 673,943 |
| Events in quadrant B | 3,876,708 | 697,295 |
| Events in quadrant C | 3,470,276 | 665,295 |
| Events in quadrant D | 4,776,976 | 641,762 |
| Mode M0 | |||
|---|---|---|---|
| Quadrant | BADHDUFLAG | Total packets | Discarded packets |
| A | 0 | 14060 | 2 |
| B | 0 | 15679 | 2 |
| C | 0 | 14252 | 2 |
| D | 0 | 18729 | 2 |
| Mode SS | |||
|---|---|---|---|
| Quadrant | BADHDUFLAG | Total packets | Discarded packets |
| A | 0 | 136 | 0 |
| B | 0 | 136 | 0 |
| C | 0 | 136 | 0 |
| D | 0 | 136 | 0 |
| Mode M9 | |||
|---|---|---|---|
| Quadrant | BADHDUFLAG | Total packets | Discarded packets |
| A | 0 | 16 | 0 |
| B | 0 | 17 | 0 |
| C | 0 | 17 | 0 |
| D | 0 | 17 | 0 |
| Quadrant | Total seconds | Saturated seconds | Saturation percentage |
|---|---|---|---|
| A | 6685 | 49 | 0.732984% |
| B | 6685 | 139 | 2.079282% |
| C | 6685 | 76 | 1.136874% |
| D | 6685 | 145 | 2.169035% |
Noise dominated data is calculated using 1-second bins in cleaned event files. If a bin has >2000 counts, and if more than 50% of those come from <1% of pixels, then it is considered to be noise-dominated and hence unusable.
| Quadrant | # 1 sec bins | Bins with >0 counts | Bins with >2000 counts | High rate bins dominated by noise | Noise dominated (total time) | Noise dominated (detector-on time) | Marked lightcurve |
|---|---|---|---|---|---|---|---|
| A | 7940 | 6685 | 0 | 0 | 0.00% | 0.00% | 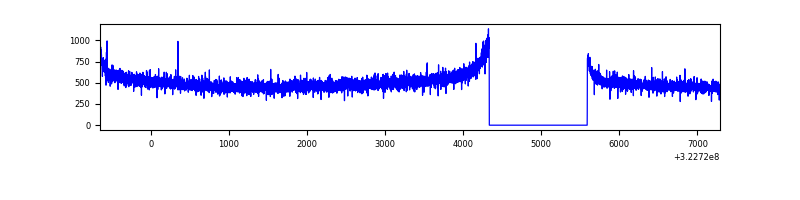 |
| B | 7940 | 6685 | 27 | 27 | 0.34% | 0.40% | 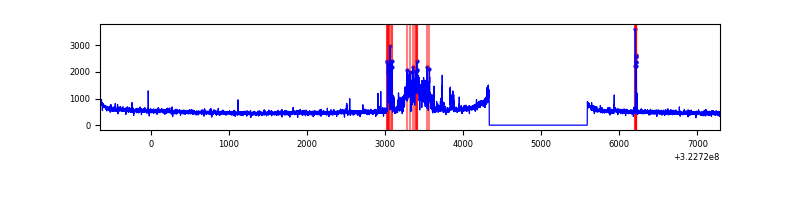 |
| C | 7940 | 6686 | 0 | 0 | 0.00% | 0.00% |  |
| D | 7940 | 6686 | 76 | 76 | 0.96% | 1.14% | 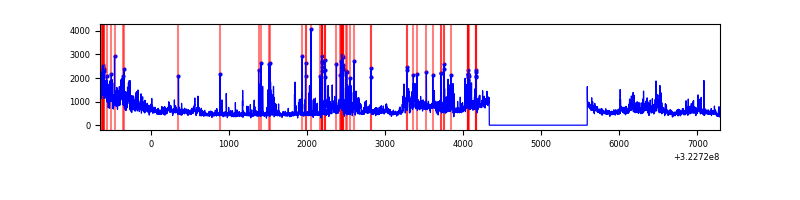 |
Top three noisy pixels from each quadrant. If the there are fewer than three noisy pixels in the level2.evt file, extra rows are filled as -1
| Pixel properties | Quadrant properties | ||||||
|---|---|---|---|---|---|---|---|
| Quadrant | DetID | PixID | Counts | Sigma | Mean | Median | Sigma |
| A | 13 | 254 | 9740 | 51.1 | 871 | 854 | 173.9 |
| A | 0 | 226 | 7418 | 37.74 | 871 | 854 | 173.9 |
| A | 3 | 137 | 7132 | 36.1 | 871 | 854 | 173.9 |
| B | 15 | 33 | 286771 | 1745.93 | 872 | 853 | 163.8 |
| B | 0 | 245 | 88671 | 536.25 | 872 | 853 | 163.8 |
| B | 12 | 17 | 70175 | 423.31 | 872 | 853 | 163.8 |
| C | 14 | 238 | 133852 | 669.4 | 850 | 859 | 198.7 |
| C | 7 | 247 | 14614 | 69.23 | 850 | 859 | 198.7 |
| C | 3 | 233 | 7367 | 32.76 | 850 | 859 | 198.7 |
| D | 8 | 195 | 509115 | 2463.45 | 852 | 830 | 206.3 |
| D | 7 | 238 | 332542 | 1607.67 | 852 | 830 | 206.3 |
| D | 1 | 52 | 278670 | 1346.57 | 852 | 830 | 206.3 |
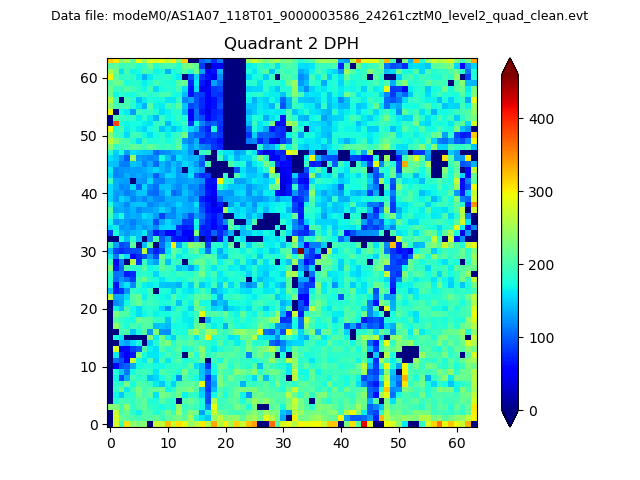
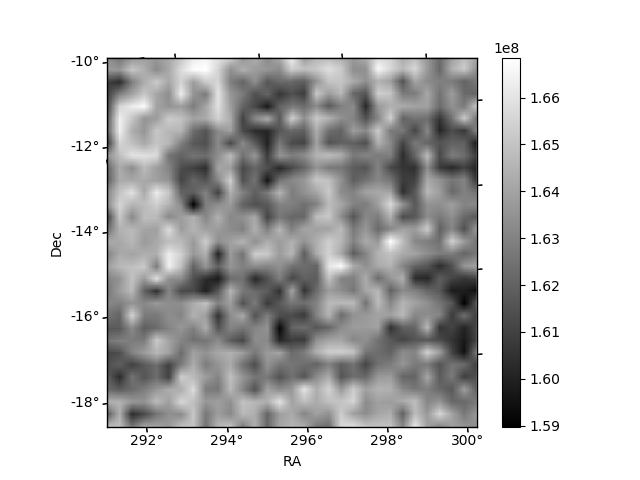
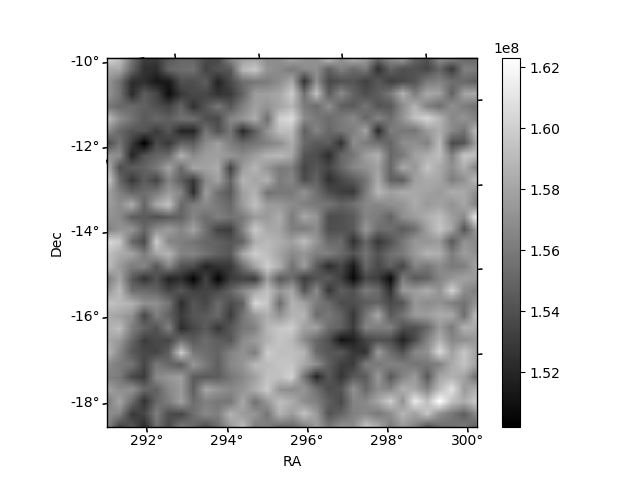
Histogram calculated using DETX and DETY for each event in the final _common_clean file
| Quadrant A | 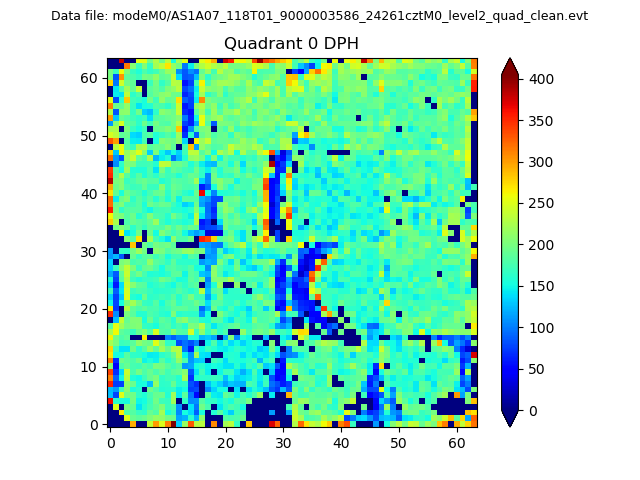 |
 |
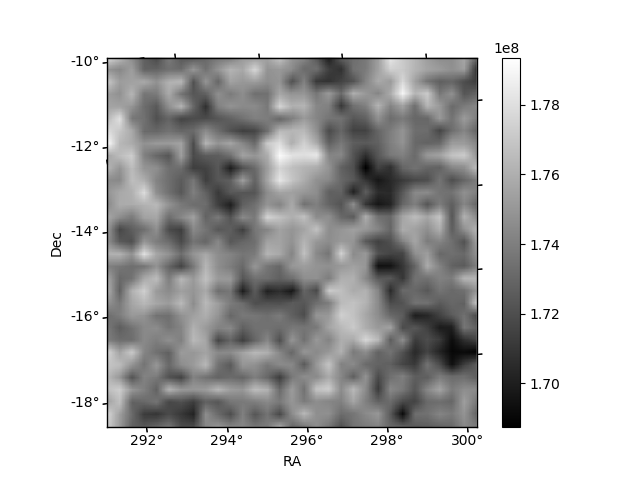
Quadrant B |
|---|---|---|---|
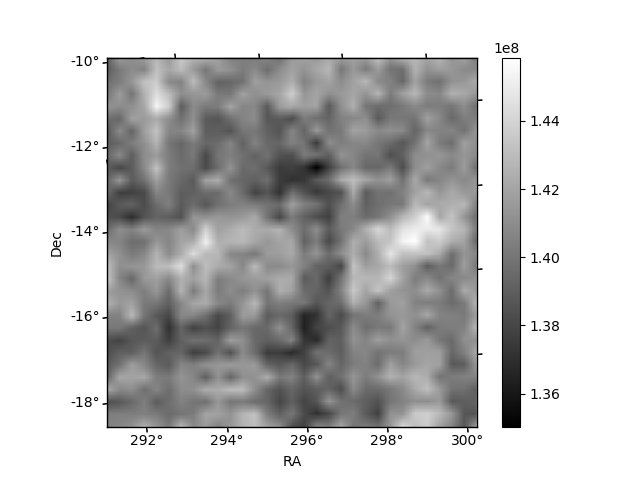
| Quadrant D | 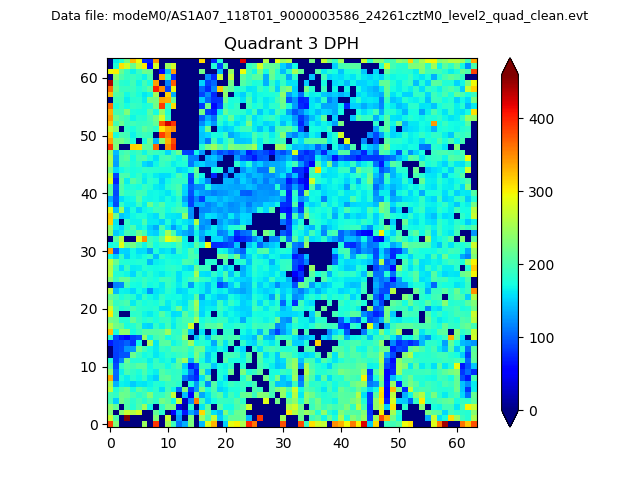 |
 |
Quadrant C |
| Plot type | Count rate plots | Images |
|---|---|---|
| Comparison with Poisson distribution Blue bars denote a histogram of data divided into 1 sec bins. Red curve is a Poisson curve with rate = median count rate of data. |
 |
 |
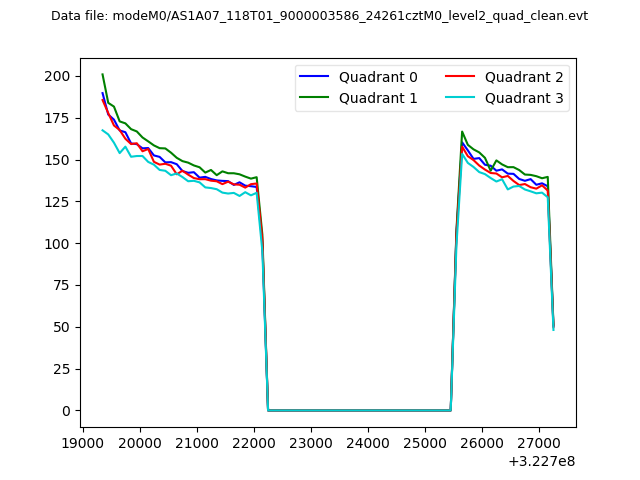
| Quadrant-wise count rates Data is divided into 100 sec bins |
 |
|
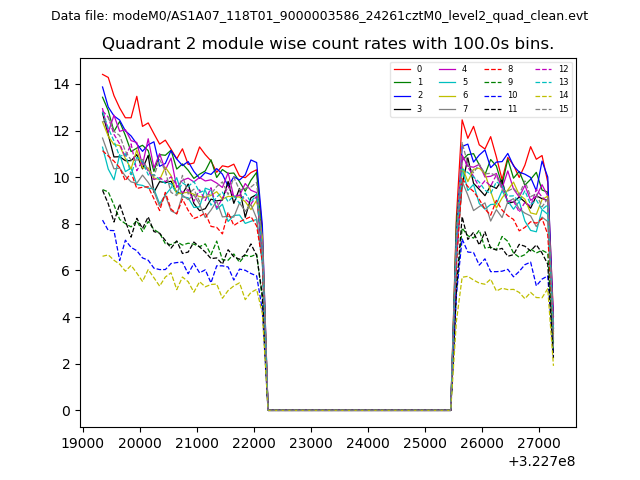
| Module-wise count rates for Quadrant A Data is divided into 100 sec bins |
 |
 |
| Module-wise count rates for Quadrant B Data is divided into 100 sec bins |
 |
 |
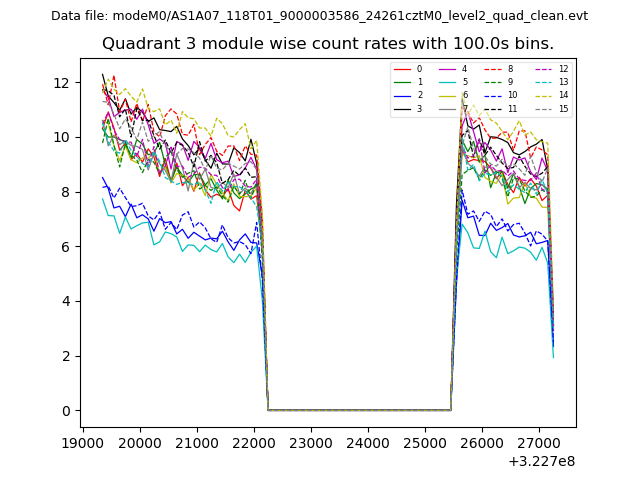
| Module-wise count rates for Quadrant C Data is divided into 100 sec bins |
 |
 |
| Module-wise count rates for Quadrant D Data is divided into 100 sec bins |
 |
 |
| Parameter | Plot |
|---|---|
| CZT HV Monitor | 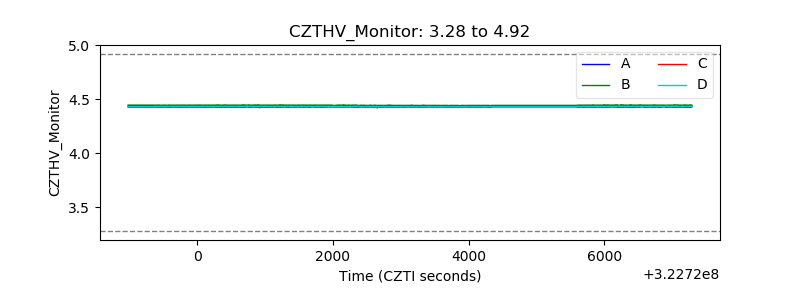 |
| D_VDD | 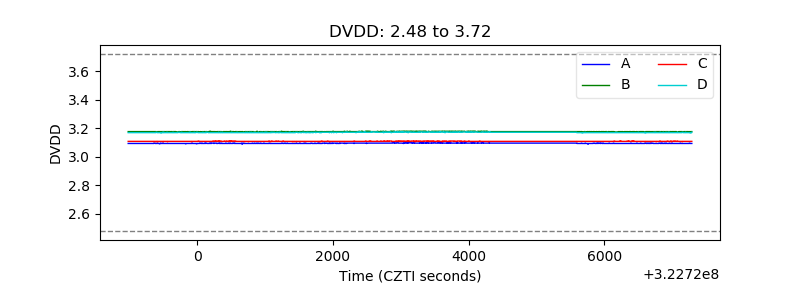 |
| Temperature 1 | 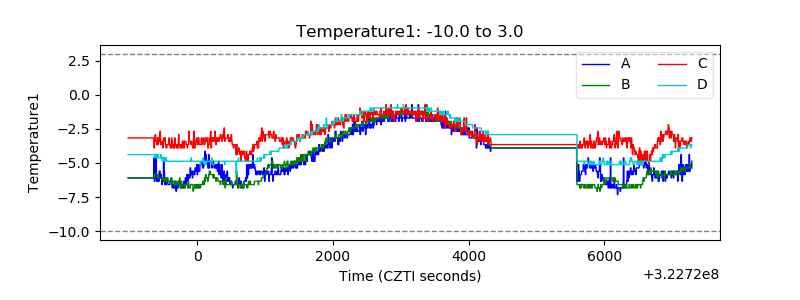 |
| Veto HV Monitor |  |
| Veto LLD | 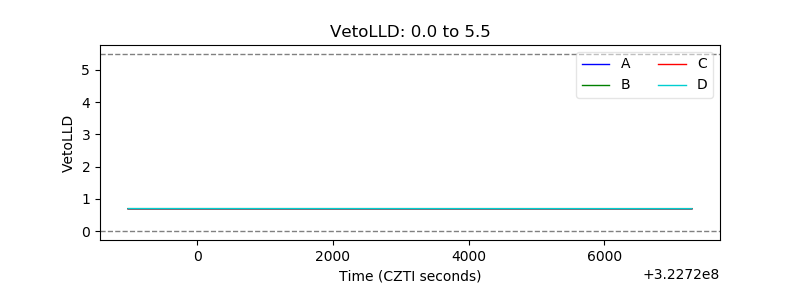 |
| Alpha Counter | 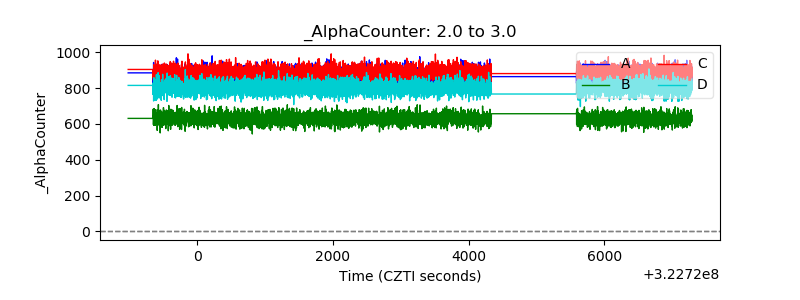 |
| _CPM_Rate | 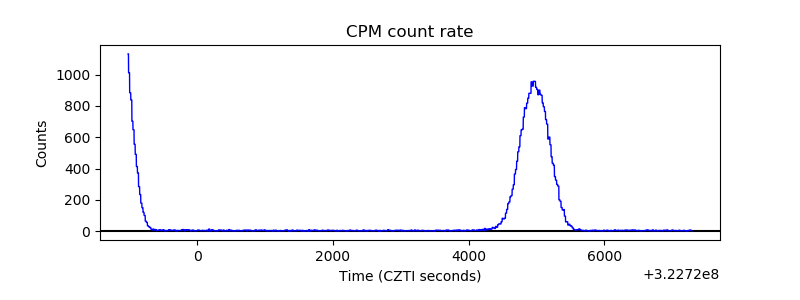 |
| CZT Counter | 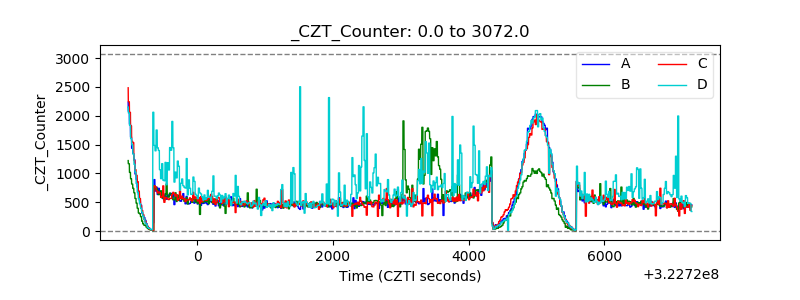 |
| +2.5 Volts monitor |  |
| +5 Volts monitor |  |
| _ROLL_ROT |  |
| _Roll_DEC | 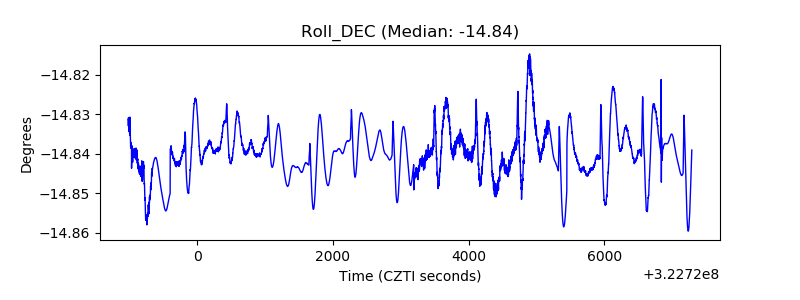 |
| _Roll_RA | 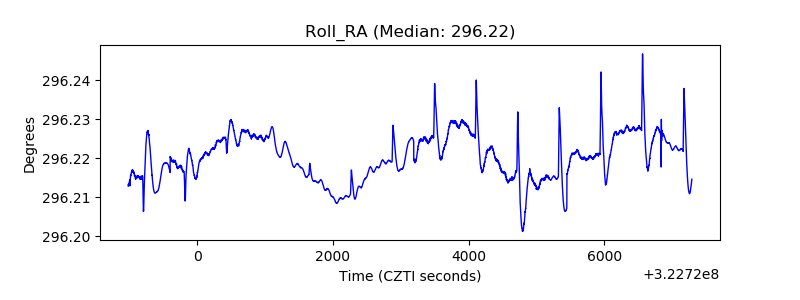 |
| Veto Counter | 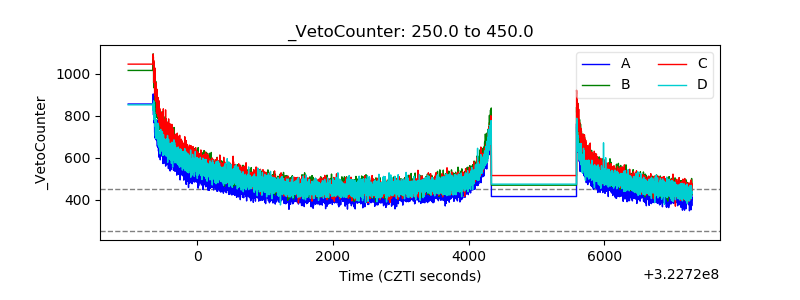 |