| Param | Original file | Final file |
|---|---|---|
| Filename | modeM0/AS1A07_118T01_9000003586_24262cztM0_level2.evt | modeM0/AS1A07_118T01_9000003586_24262cztM0_level2_quad_clean.evt |
| Size (bytes) | 532,543,680 | 94,331,520 |
| Size | 507.9 MB | 90.0 MB |
| Events in quadrant A | 3,204,214 | 605,139 |
| Events in quadrant B | 3,325,346 | 621,398 |
| Events in quadrant C | 3,302,123 | 594,189 |
| Events in quadrant D | 5,843,543 | 570,183 |
| Mode M0 | |||
|---|---|---|---|
| Quadrant | BADHDUFLAG | Total packets | Discarded packets |
| A | 0 | 13703 | 1 |
| B | 0 | 13993 | 1 |
| C | 0 | 13776 | 1 |
| D | 0 | 21851 | 1 |
| Mode SS | |||
|---|---|---|---|
| Quadrant | BADHDUFLAG | Total packets | Discarded packets |
| A | 0 | 136 | 0 |
| B | 0 | 136 | 0 |
| C | 0 | 136 | 0 |
| D | 0 | 136 | 0 |
| Mode M9 | |||
|---|---|---|---|
| Quadrant | BADHDUFLAG | Total packets | Discarded packets |
| A | 0 | 10 | 0 |
| B | 0 | 10 | 0 |
| C | 0 | 10 | 0 |
| D | 0 | 10 | 0 |
| Quadrant | Total seconds | Saturated seconds | Saturation percentage |
|---|---|---|---|
| A | 6680 | 26 | 0.389222% |
| B | 6681 | 50 | 0.748391% |
| C | 6681 | 63 | 0.942973% |
| D | 6681 | 310 | 4.640024% |
Noise dominated data is calculated using 1-second bins in cleaned event files. If a bin has >2000 counts, and if more than 50% of those come from <1% of pixels, then it is considered to be noise-dominated and hence unusable.
| Quadrant | # 1 sec bins | Bins with >0 counts | Bins with >2000 counts | High rate bins dominated by noise | Noise dominated (total time) | Noise dominated (detector-on time) | Marked lightcurve |
|---|---|---|---|---|---|---|---|
| A | 7630 | 6681 | 0 | 0 | 0.00% | 0.00% | 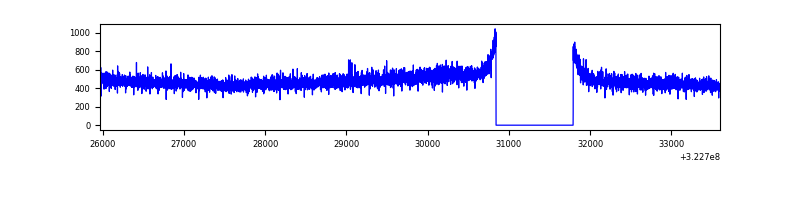 |
| B | 7631 | 6682 | 11 | 11 | 0.14% | 0.16% | 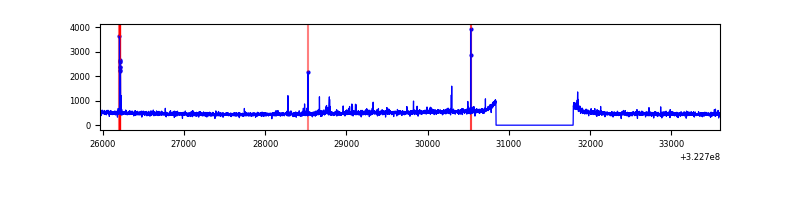 |
| C | 7631 | 6682 | 0 | 0 | 0.00% | 0.00% | 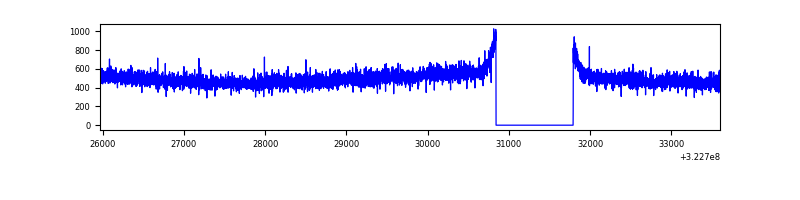 |
| D | 7631 | 6681 | 244 | 244 | 3.20% | 3.65% | 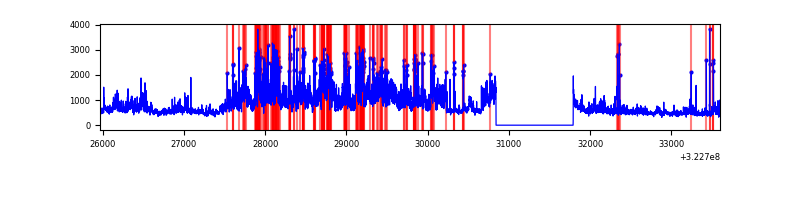 |
Top three noisy pixels from each quadrant. If the there are fewer than three noisy pixels in the level2.evt file, extra rows are filled as -1
| Pixel properties | Quadrant properties | ||||||
|---|---|---|---|---|---|---|---|
| Quadrant | DetID | PixID | Counts | Sigma | Mean | Median | Sigma |
| A | 13 | 254 | 9810 | 53.62 | 831 | 816 | 167.7 |
| A | 3 | 137 | 7056 | 37.2 | 831 | 816 | 167.7 |
| A | 0 | 226 | 6996 | 36.85 | 831 | 816 | 167.7 |
| B | 0 | 245 | 32905 | 202.83 | 831 | 813 | 158.2 |
| B | 12 | 111 | 18548 | 112.09 | 831 | 813 | 158.2 |
| B | 11 | 111 | 16703 | 100.43 | 831 | 813 | 158.2 |
| C | 14 | 238 | 129014 | 676.59 | 807 | 813 | 189.5 |
| C | 7 | 247 | 20544 | 104.13 | 807 | 813 | 189.5 |
| C | 13 | 61 | 5557 | 25.04 | 807 | 813 | 189.5 |
| D | 8 | 195 | 1730040 | 8894.15 | 805 | 785 | 194.4 |
| D | 1 | 52 | 385142 | 1976.88 | 805 | 785 | 194.4 |
| D | 1 | 239 | 304053 | 1559.81 | 805 | 785 | 194.4 |
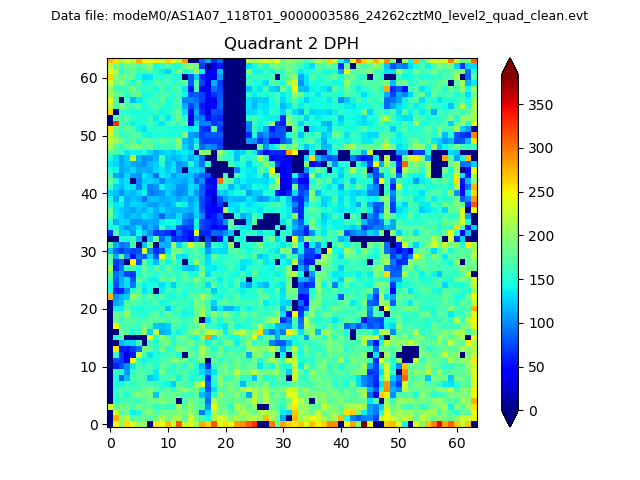
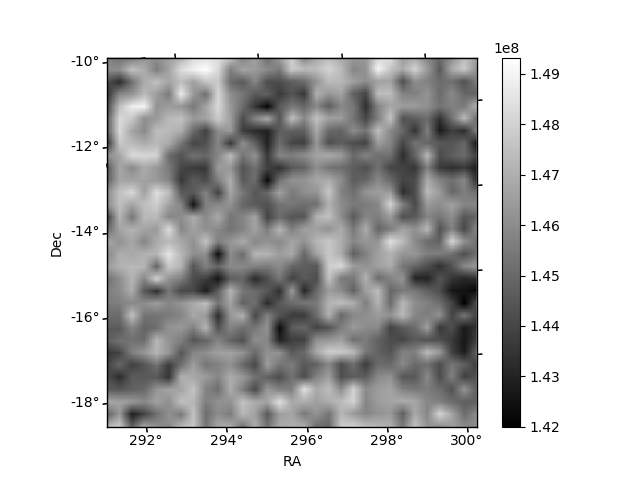
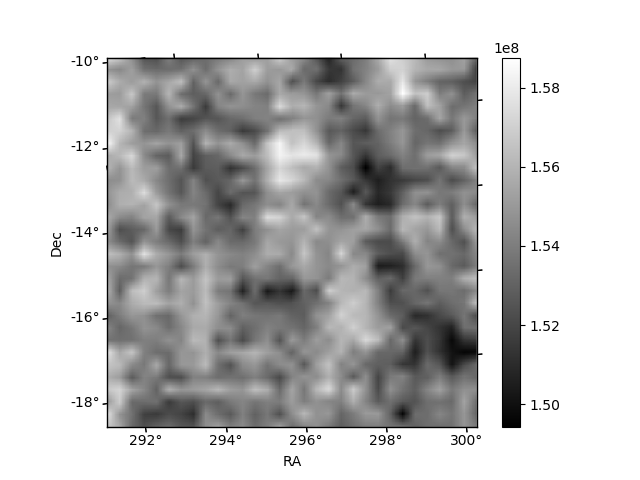
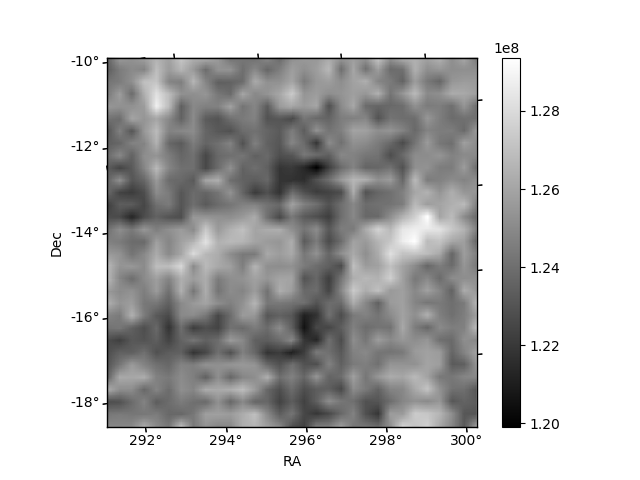
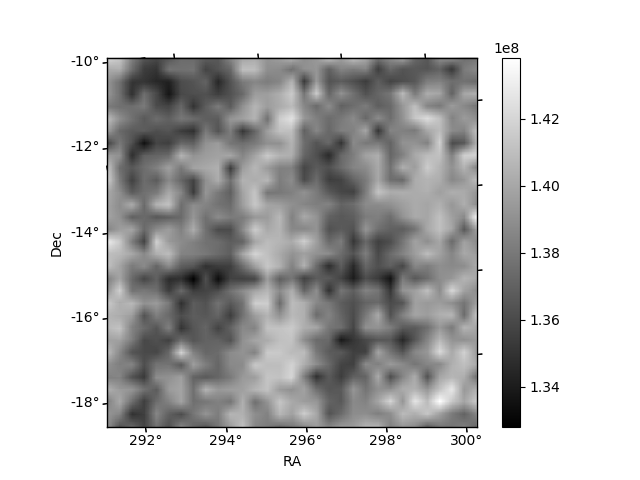
Histogram calculated using DETX and DETY for each event in the final _common_clean file
| Quadrant A |  |
 |
Quadrant B |
|---|---|---|---|
| Quadrant D | 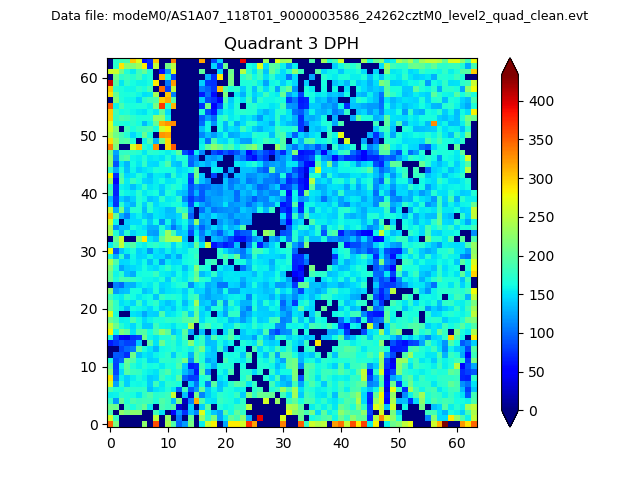 |
 |
Quadrant C |
| Plot type | Count rate plots | Images |
|---|---|---|
| Comparison with Poisson distribution Blue bars denote a histogram of data divided into 1 sec bins. Red curve is a Poisson curve with rate = median count rate of data. |
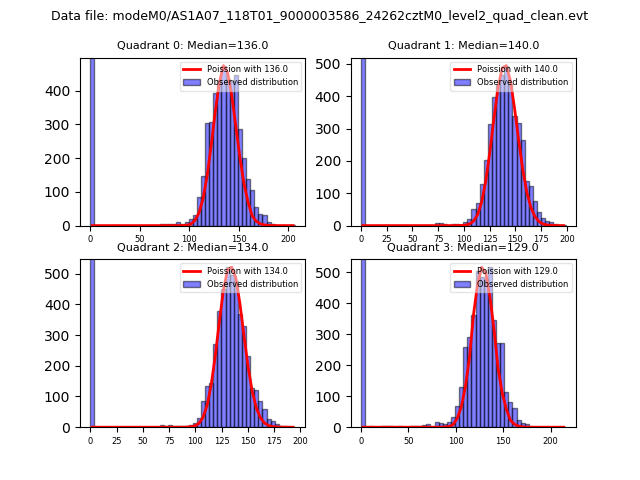 |
 |
| Quadrant-wise count rates Data is divided into 100 sec bins |
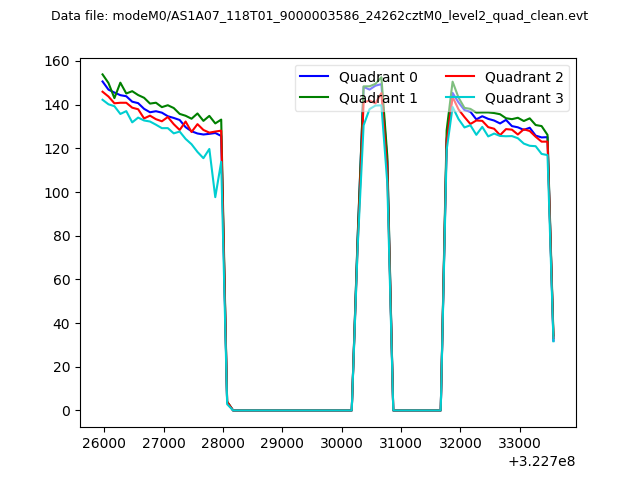 |
|
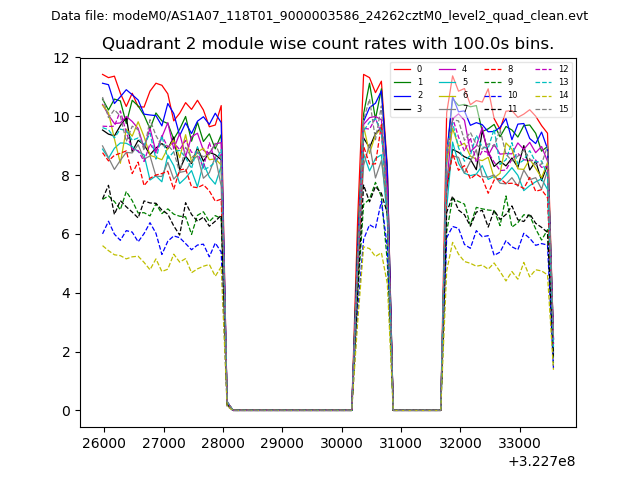
| Module-wise count rates for Quadrant A Data is divided into 100 sec bins |
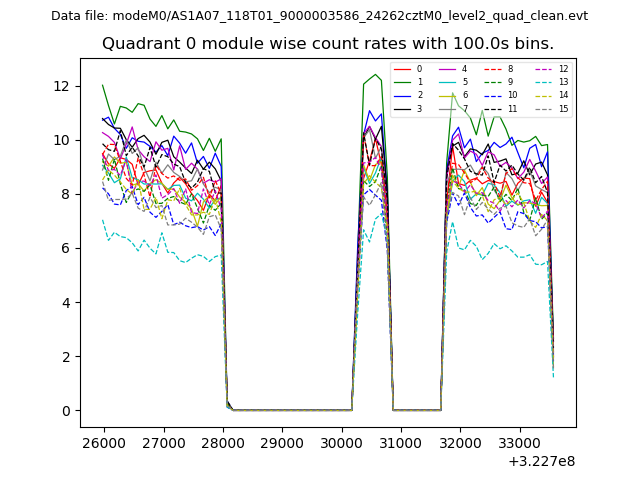 |
 |
| Module-wise count rates for Quadrant B Data is divided into 100 sec bins |
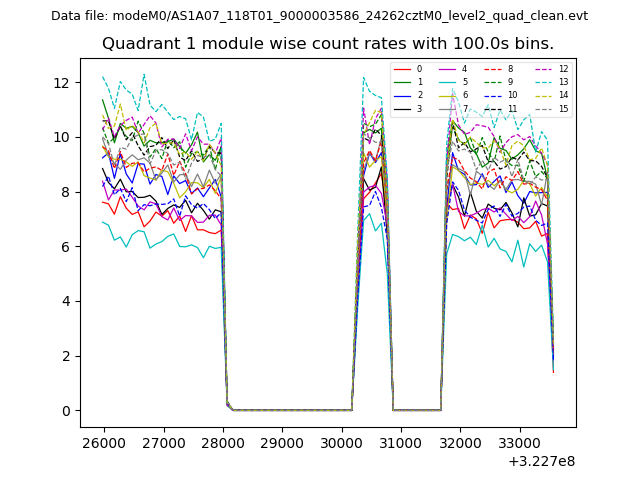 |
 |
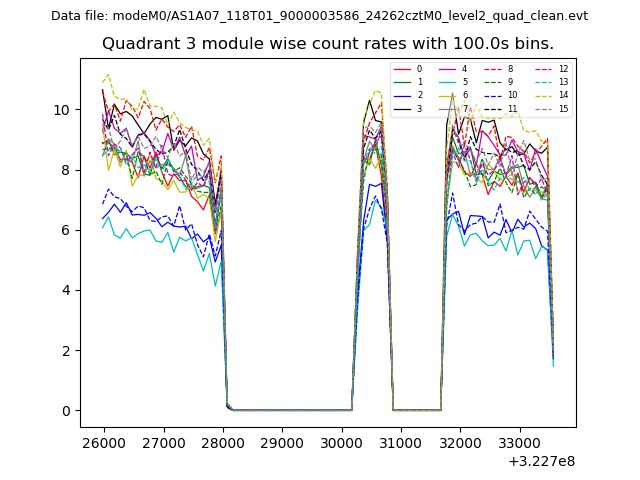
| Module-wise count rates for Quadrant C Data is divided into 100 sec bins |
 |
 |
| Module-wise count rates for Quadrant D Data is divided into 100 sec bins |
 |
 |
| Parameter | Plot |
|---|---|
| CZT HV Monitor | 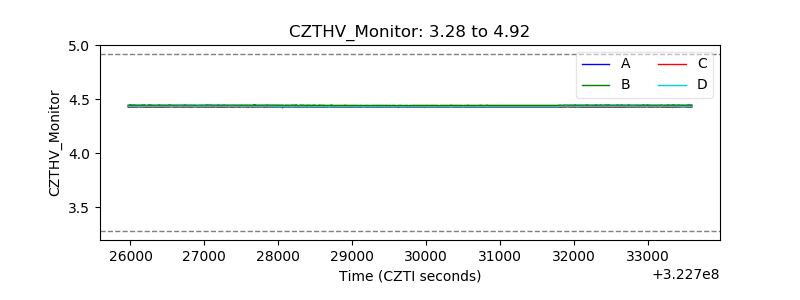 |
| D_VDD | 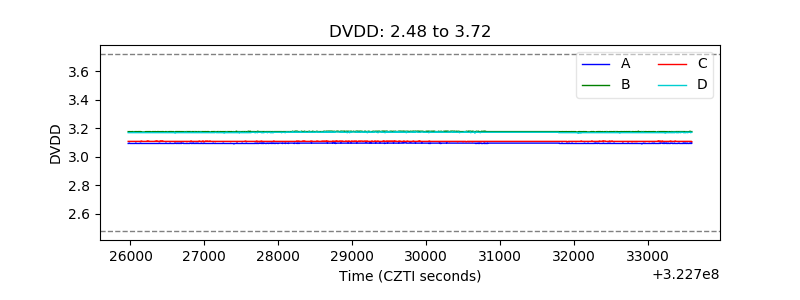 |
| Temperature 1 | 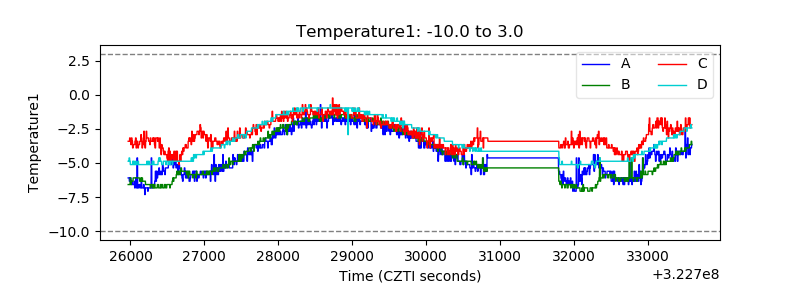 |
| Veto HV Monitor |  |
| Veto LLD | 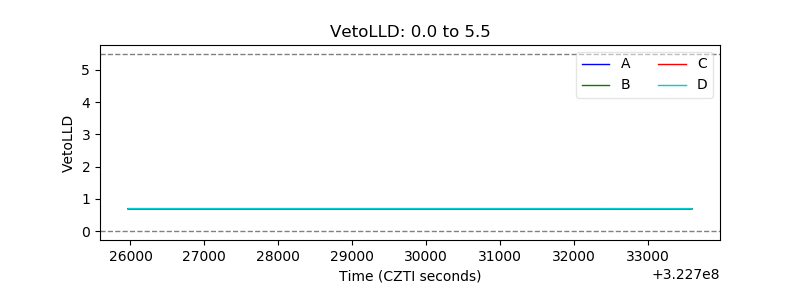 |
| Alpha Counter | 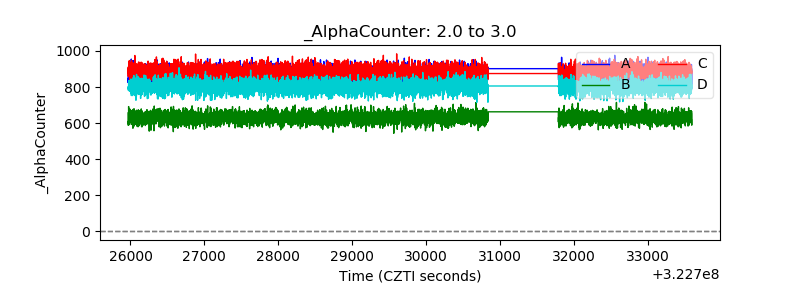 |
| _CPM_Rate |  |
| CZT Counter | 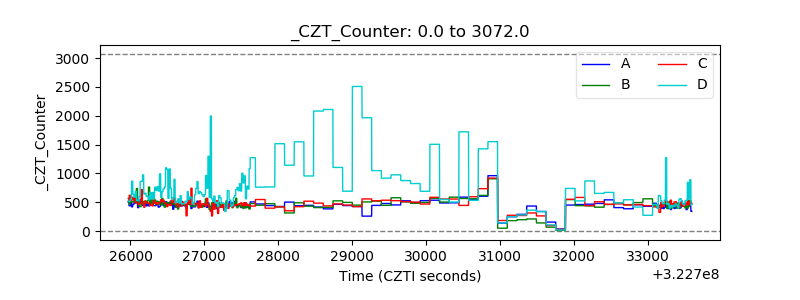 |
| +2.5 Volts monitor | 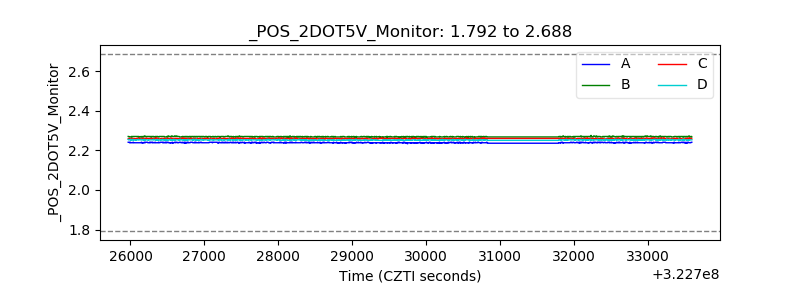 |
| +5 Volts monitor |  |
| _ROLL_ROT | 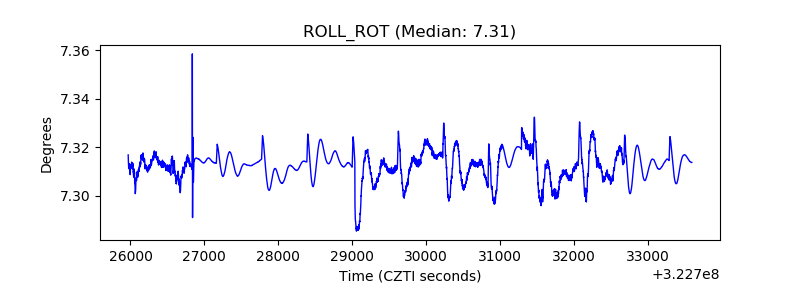 |
| _Roll_DEC |  |
| _Roll_RA | 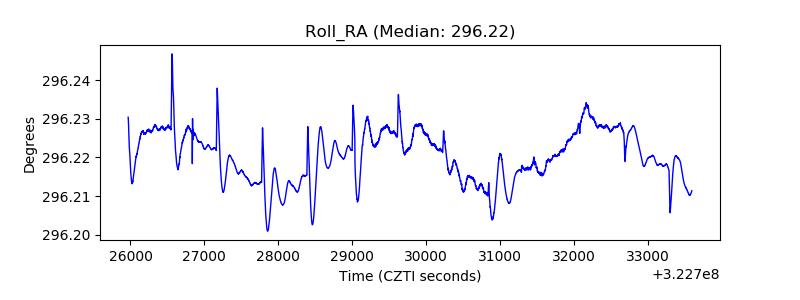 |
| Veto Counter | 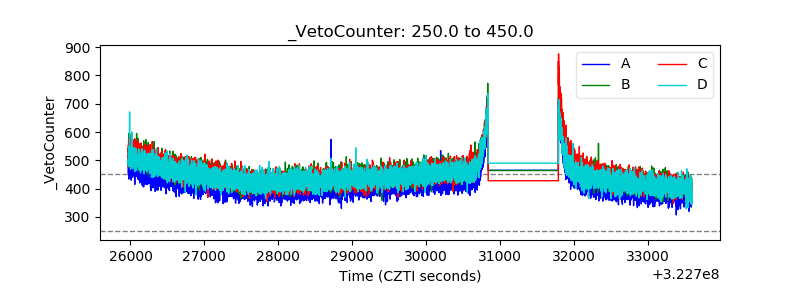 |