| Param | Original file | Final file |
|---|---|---|
| Filename | modeM0/AS1A07_118T01_9000003586_24263cztM0_level2.evt | modeM0/AS1A07_118T01_9000003586_24263cztM0_level2_quad_clean.evt |
| Size (bytes) | 426,294,720 | 76,596,480 |
| Size | 406.5 MB | 73.0 MB |
| Events in quadrant A | 2,842,777 | 480,589 |
| Events in quadrant B | 2,915,559 | 493,578 |
| Events in quadrant C | 2,899,566 | 473,357 |
| Events in quadrant D | 3,851,850 | 460,102 |
| Mode M0 | |||
|---|---|---|---|
| Quadrant | BADHDUFLAG | Total packets | Discarded packets |
| A | 0 | 13139 | 995 |
| B | 0 | 13293 | 999 |
| C | 0 | 13155 | 951 |
| D | 0 | 16364 | 1102 |
| Mode SS | |||
|---|---|---|---|
| Quadrant | BADHDUFLAG | Total packets | Discarded packets |
| A | 0 | 130 | 12 |
| B | 0 | 130 | 8 |
| C | 0 | 129 | 9 |
| D | 0 | 130 | 10 |
| Mode M9 | |||
|---|---|---|---|
| Quadrant | BADHDUFLAG | Total packets | Discarded packets |
| A | 0 | 4 | 0 |
| B | 0 | 4 | 0 |
| C | 0 | 4 | 0 |
| D | 0 | 4 | 0 |
| Quadrant | Total seconds | Saturated seconds | Saturation percentage |
|---|---|---|---|
| A | 5886 | 124 | 2.106694% |
| B | 5881 | 131 | 2.227512% |
| C | 5902 | 153 | 2.592342% |
| D | 5880 | 207 | 3.520408% |
Noise dominated data is calculated using 1-second bins in cleaned event files. If a bin has >2000 counts, and if more than 50% of those come from <1% of pixels, then it is considered to be noise-dominated and hence unusable.
| Quadrant | # 1 sec bins | Bins with >0 counts | Bins with >2000 counts | High rate bins dominated by noise | Noise dominated (total time) | Noise dominated (detector-on time) | Marked lightcurve |
|---|---|---|---|---|---|---|---|
| A | 6713 | 5936 | 0 | 0 | 0.00% | 0.00% | 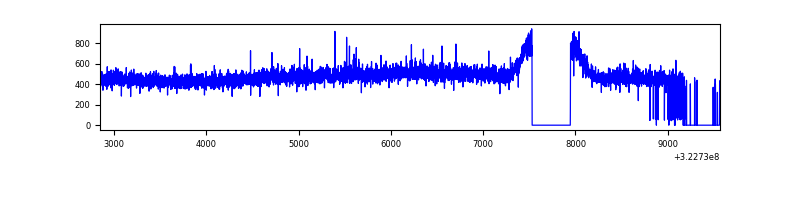 |
| B | 6710 | 5945 | 3 | 3 | 0.04% | 0.05% | 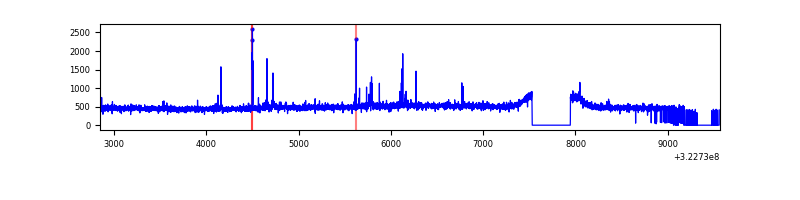 |
| C | 6717 | 5955 | 0 | 0 | 0.00% | 0.00% | 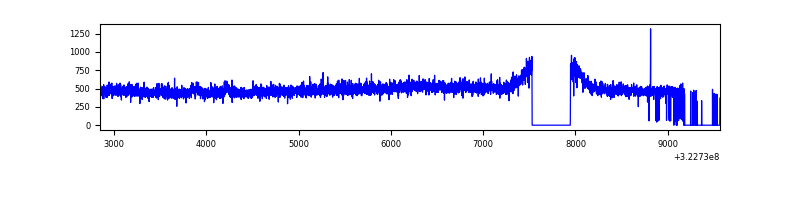 |
| D | 6686 | 5930 | 98 | 98 | 1.47% | 1.65% | 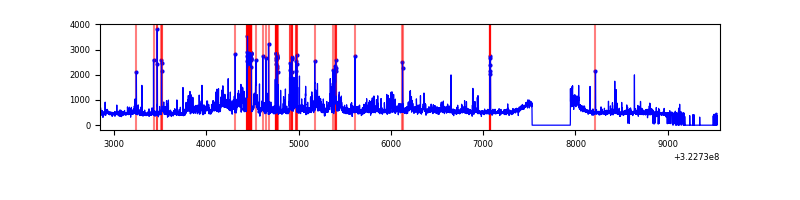 |
Top three noisy pixels from each quadrant. If the there are fewer than three noisy pixels in the level2.evt file, extra rows are filled as -1
| Pixel properties | Quadrant properties | ||||||
|---|---|---|---|---|---|---|---|
| Quadrant | DetID | PixID | Counts | Sigma | Mean | Median | Sigma |
| A | 3 | 1 | 13529 | 85.71 | 733 | 715 | 149.5 |
| A | 13 | 254 | 9202 | 56.77 | 733 | 715 | 149.5 |
| A | 3 | 137 | 6453 | 38.38 | 733 | 715 | 149.5 |
| B | 0 | 245 | 19792 | 135.21 | 730 | 710 | 141.1 |
| B | 12 | 111 | 16765 | 113.77 | 730 | 710 | 141.1 |
| B | 11 | 111 | 15058 | 101.67 | 730 | 710 | 141.1 |
| C | 14 | 238 | 111741 | 663.87 | 709 | 713 | 167.2 |
| C | 2 | 16 | 15576 | 88.87 | 709 | 713 | 167.2 |
| C | 7 | 247 | 7473 | 40.42 | 709 | 713 | 167.2 |
| D | 8 | 195 | 485316 | 2775.18 | 713 | 692 | 174.6 |
| D | 1 | 52 | 306903 | 1753.51 | 713 | 692 | 174.6 |
| D | 1 | 239 | 195627 | 1116.29 | 713 | 692 | 174.6 |
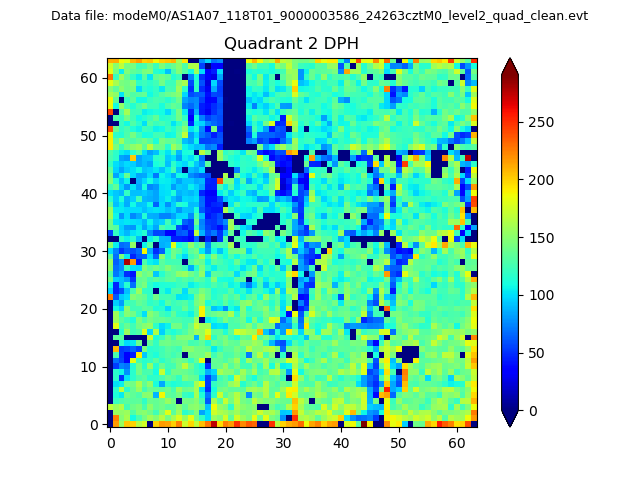
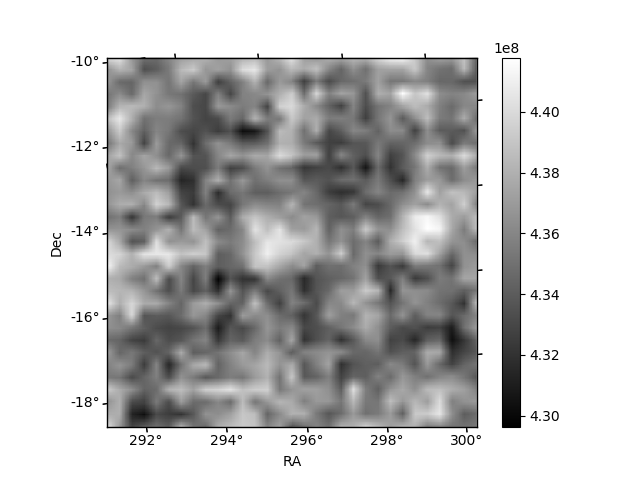
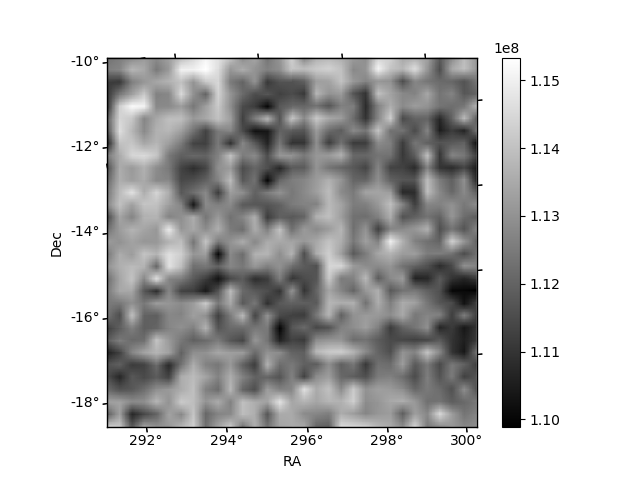
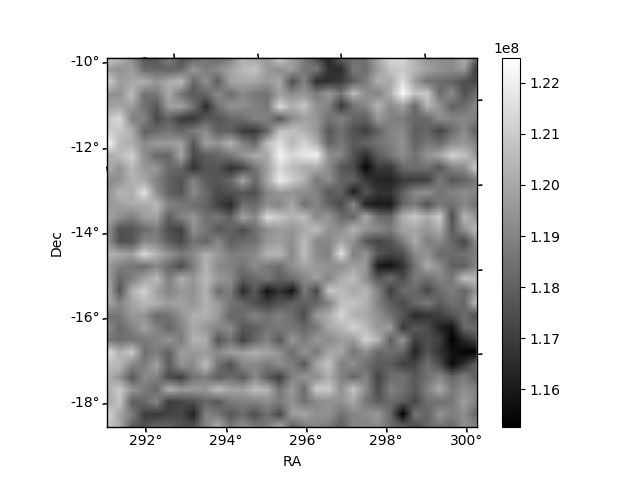
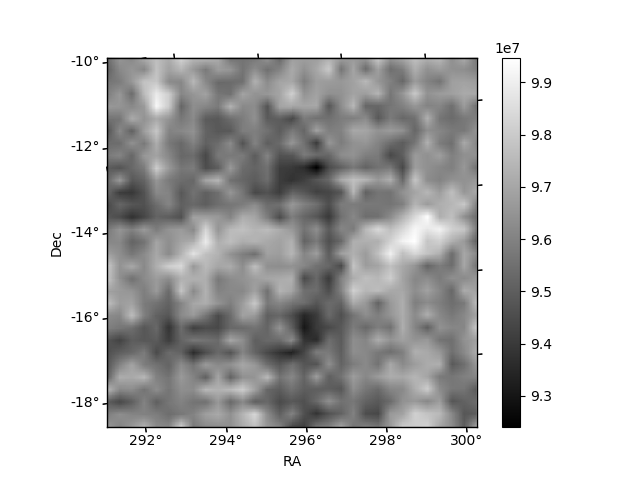
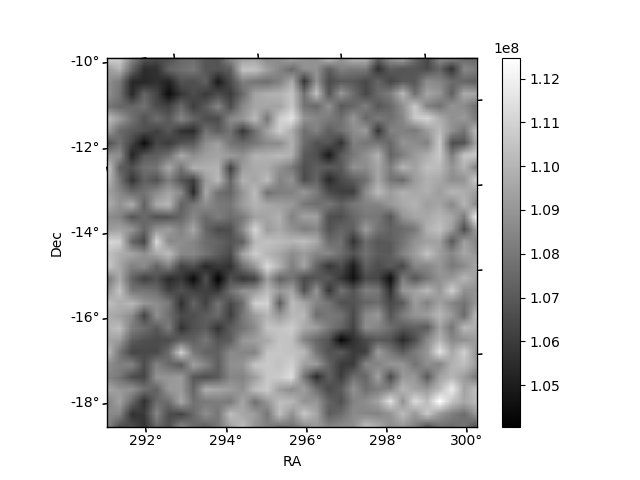
Histogram calculated using DETX and DETY for each event in the final _common_clean file
| Quadrant A | 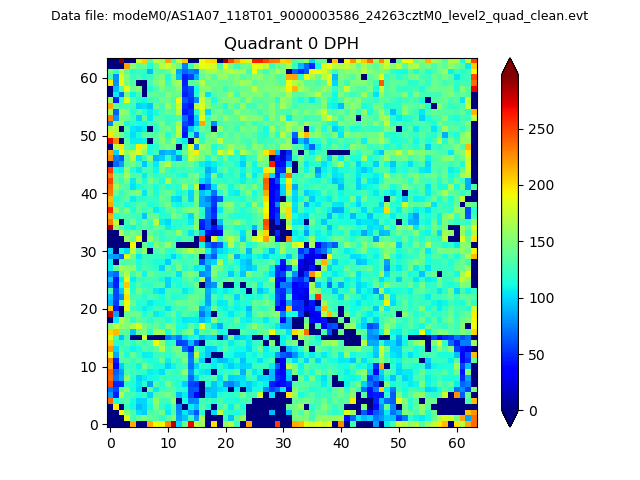 |
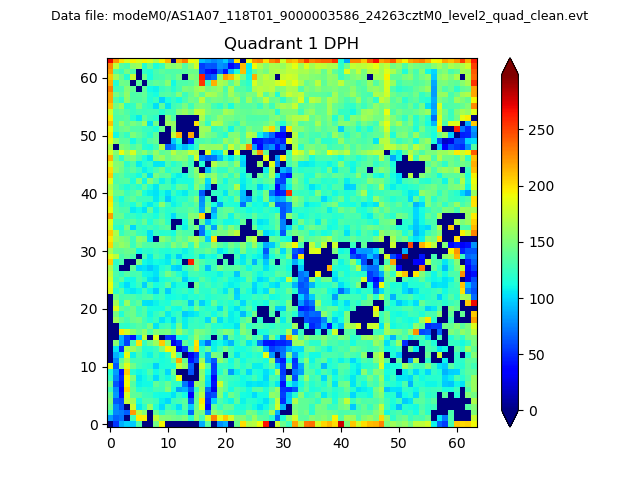 |
Quadrant B |
|---|---|---|---|
| Quadrant D | 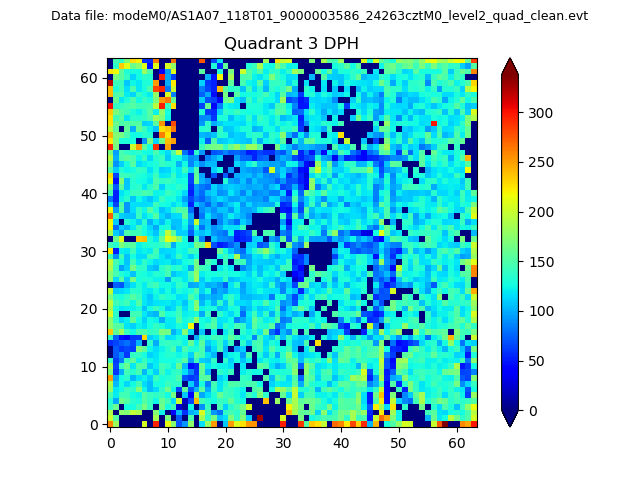 |
 |
Quadrant C |
| Plot type | Count rate plots | Images |
|---|---|---|
| Comparison with Poisson distribution Blue bars denote a histogram of data divided into 1 sec bins. Red curve is a Poisson curve with rate = median count rate of data. |
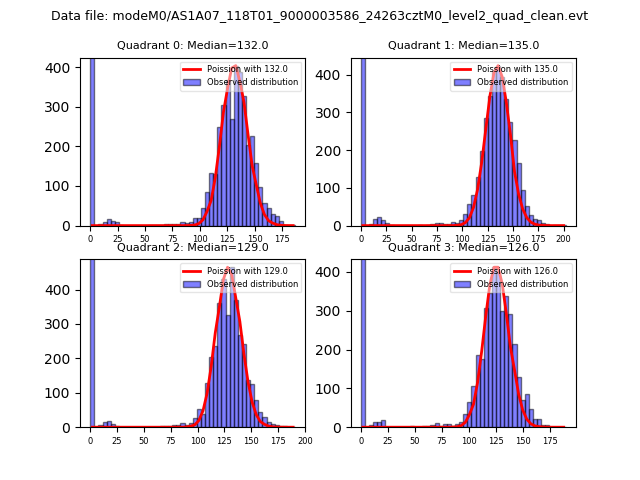 |
 |
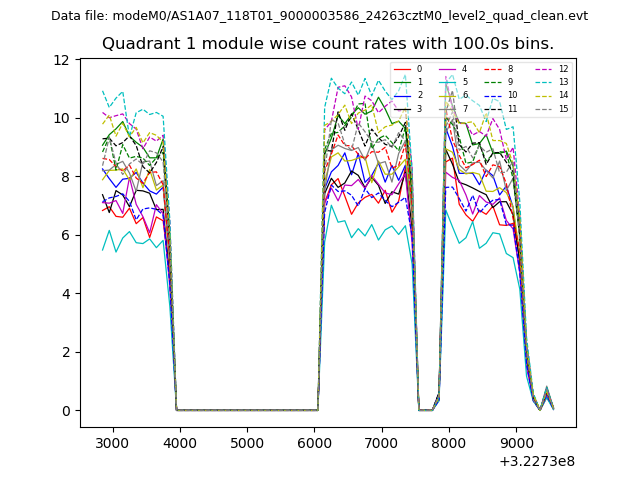
| Quadrant-wise count rates Data is divided into 100 sec bins |
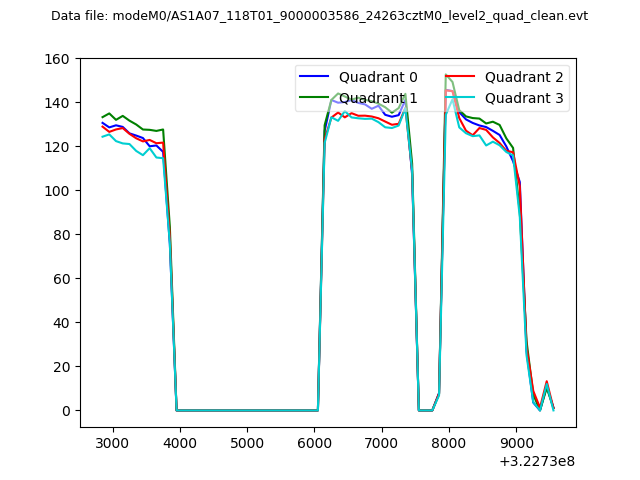 |
|
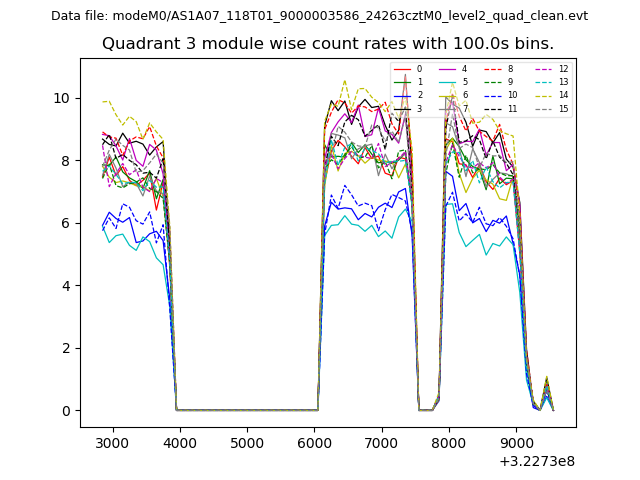
| Module-wise count rates for Quadrant A Data is divided into 100 sec bins |
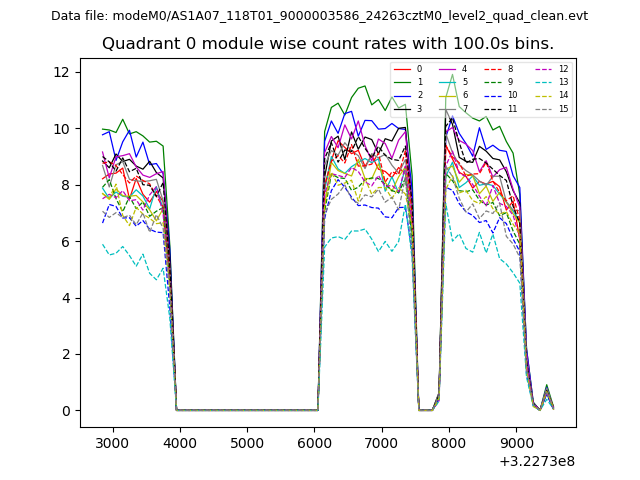 |
 |
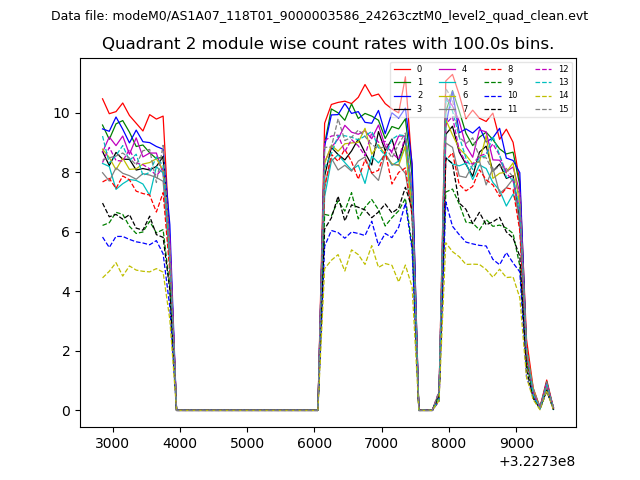
| Module-wise count rates for Quadrant B Data is divided into 100 sec bins |
 |
 |
| Module-wise count rates for Quadrant C Data is divided into 100 sec bins |
 |
 |
| Module-wise count rates for Quadrant D Data is divided into 100 sec bins |
 |
 |
| Parameter | Plot |
|---|---|
| CZT HV Monitor | 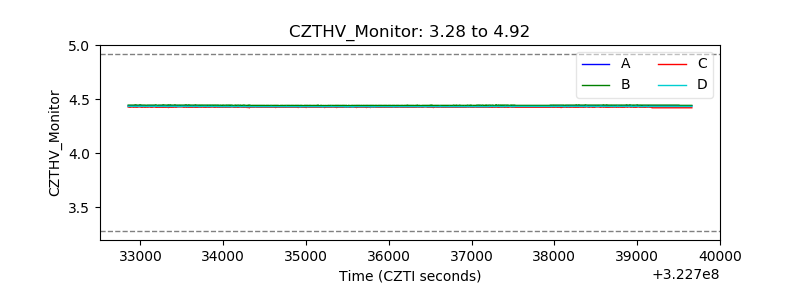 |
| D_VDD | 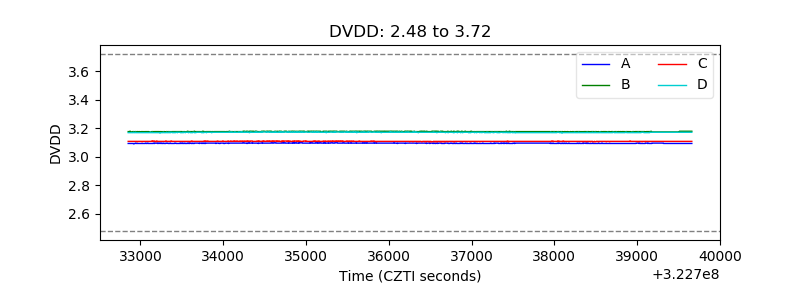 |
| Temperature 1 | 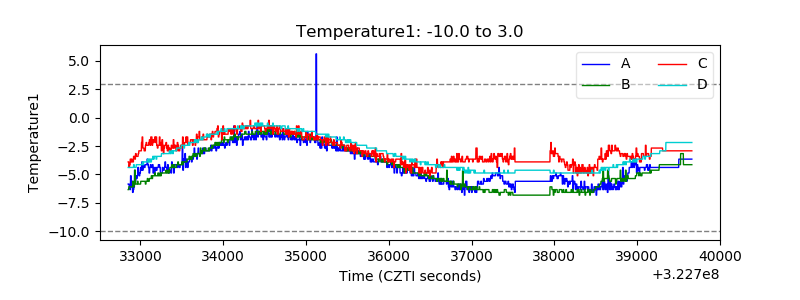 |
| Veto HV Monitor | 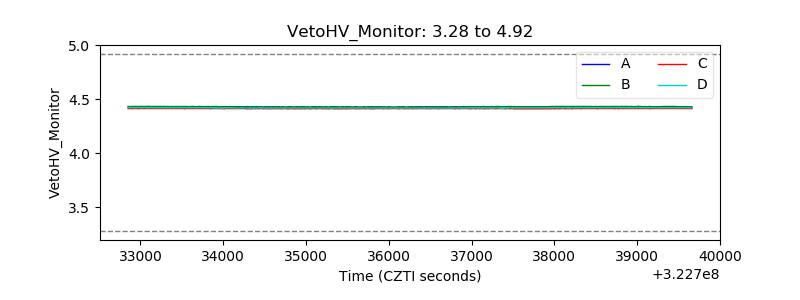 |
| Veto LLD | 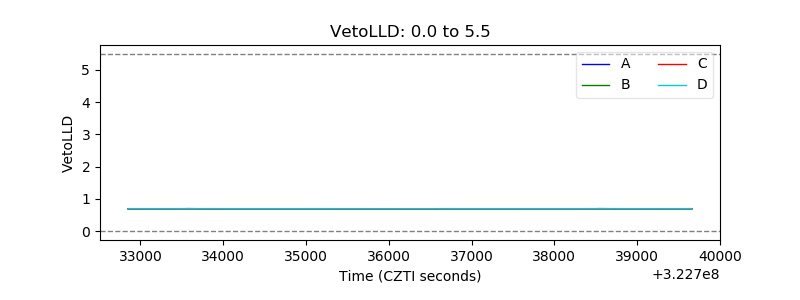 |
| Alpha Counter | 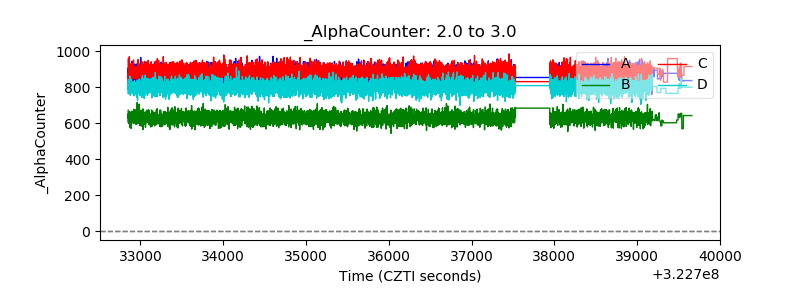 |
| _CPM_Rate | 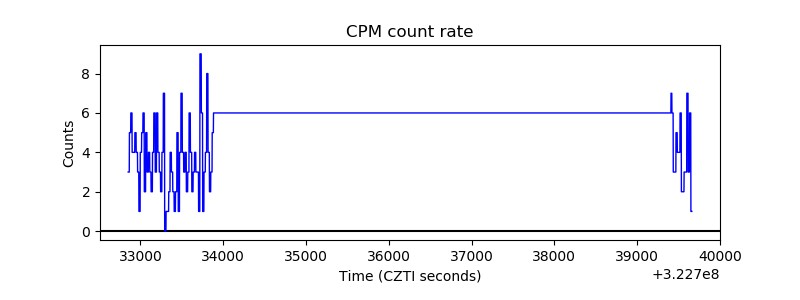 |
| CZT Counter | 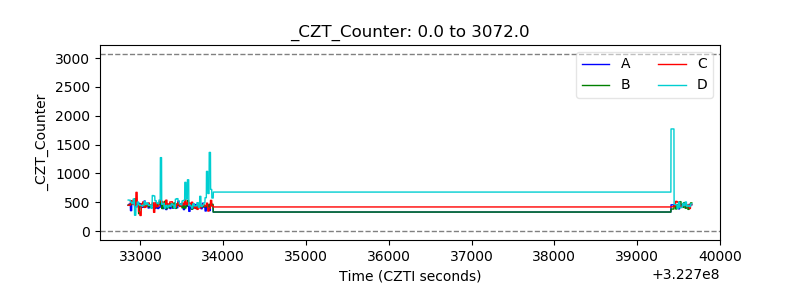 |
| +2.5 Volts monitor |  |
| +5 Volts monitor |  |
| _ROLL_ROT | 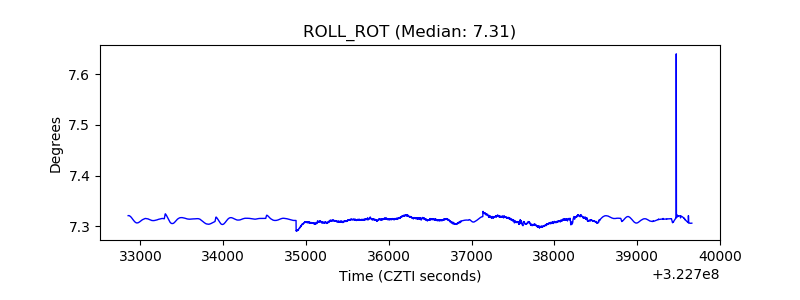 |
| _Roll_DEC |  |
| _Roll_RA | 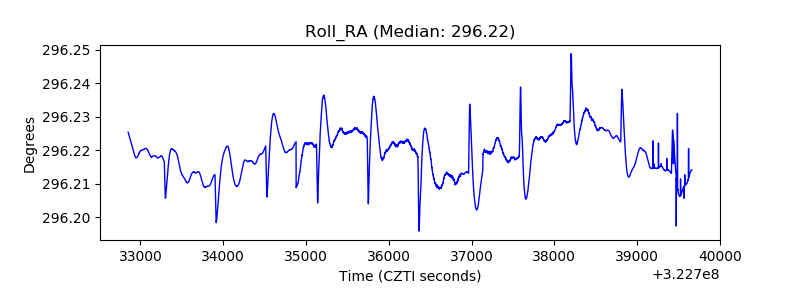 |
| Veto Counter | 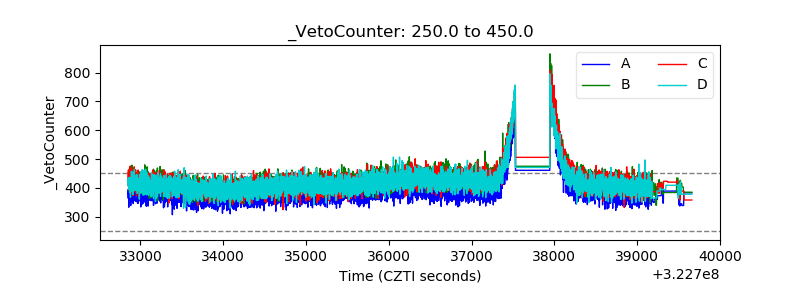 |