| Param | Original file | Final file |
|---|---|---|
| Filename | modeM0/AS1A07_118T01_9000003586_24265cztM0_level2.evt | modeM0/AS1A07_118T01_9000003586_24265cztM0_level2_quad_clean.evt |
| Size (bytes) | 558,216,000 | 84,450,240 |
| Size | 532.4 MB | 80.5 MB |
| Events in quadrant A | 3,386,716 | 523,102 |
| Events in quadrant B | 3,445,355 | 537,181 |
| Events in quadrant C | 3,860,172 | 511,083 |
| Events in quadrant D | 5,732,126 | 491,437 |
| Mode M0 | |||
|---|---|---|---|
| Quadrant | BADHDUFLAG | Total packets | Discarded packets |
| A | 0 | 14624 | 1 |
| B | 0 | 14680 | 1 |
| C | 0 | 15902 | 1 |
| D | 0 | 21787 | 1 |
| Mode SS | |||
|---|---|---|---|
| Quadrant | BADHDUFLAG | Total packets | Discarded packets |
| A | 0 | 142 | 0 |
| B | 0 | 142 | 0 |
| C | 0 | 142 | 0 |
| D | 0 | 142 | 0 |
| Mode M9 | |||
|---|---|---|---|
| Quadrant | BADHDUFLAG | Total packets | Discarded packets |
| A | 0 | 2 | 0 |
| B | 0 | 2 | 0 |
| C | 0 | 2 | 0 |
| D | 0 | 2 | 0 |
| Quadrant | Total seconds | Saturated seconds | Saturation percentage |
|---|---|---|---|
| A | 7099 | 197 | 2.775039% |
| B | 7100 | 195 | 2.746479% |
| C | 7100 | 241 | 3.394366% |
| D | 7100 | 475 | 6.690141% |
Noise dominated data is calculated using 1-second bins in cleaned event files. If a bin has >2000 counts, and if more than 50% of those come from <1% of pixels, then it is considered to be noise-dominated and hence unusable.
| Quadrant | # 1 sec bins | Bins with >0 counts | Bins with >2000 counts | High rate bins dominated by noise | Noise dominated (total time) | Noise dominated (detector-on time) | Marked lightcurve |
|---|---|---|---|---|---|---|---|
| A | 7269 | 7099 | 0 | 0 | 0.00% | 0.00% | 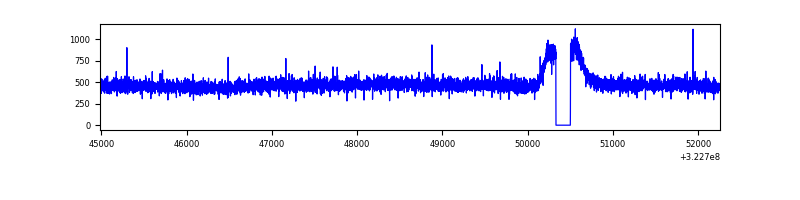 |
| B | 7270 | 7100 | 0 | 0 | 0.00% | 0.00% | 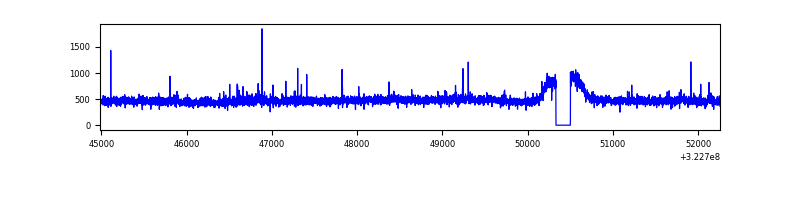 |
| C | 7270 | 7100 | 18 | 18 | 0.25% | 0.25% | 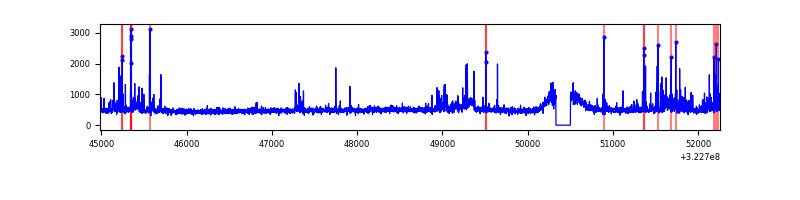 |
| D | 7270 | 7100 | 292 | 292 | 4.02% | 4.11% | 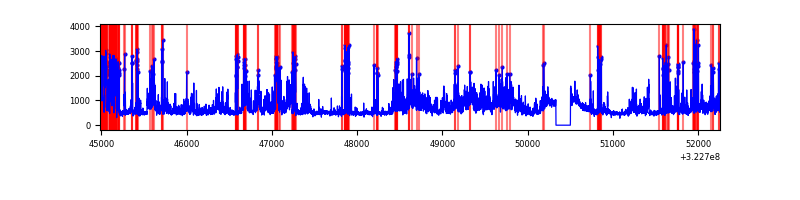 |
Top three noisy pixels from each quadrant. If the there are fewer than three noisy pixels in the level2.evt file, extra rows are filled as -1
| Pixel properties | Quadrant properties | ||||||
|---|---|---|---|---|---|---|---|
| Quadrant | DetID | PixID | Counts | Sigma | Mean | Median | Sigma |
| A | 13 | 254 | 11419 | 59.04 | 877 | 855 | 178.9 |
| A | 3 | 137 | 8135 | 40.69 | 877 | 855 | 178.9 |
| A | 0 | 226 | 7499 | 37.13 | 877 | 855 | 178.9 |
| B | 12 | 111 | 20540 | 116.24 | 871 | 846 | 169.4 |
| B | 12 | 17 | 19047 | 107.43 | 871 | 846 | 169.4 |
| B | 11 | 111 | 18610 | 104.85 | 871 | 846 | 169.4 |
| C | 2 | 16 | 398794 | 1995.09 | 843 | 850 | 199.5 |
| C | 14 | 238 | 129309 | 644.03 | 843 | 850 | 199.5 |
| C | 7 | 247 | 39097 | 191.75 | 843 | 850 | 199.5 |
| D | 8 | 195 | 1467036 | 7085.6 | 846 | 821 | 206.9 |
| D | 12 | 233 | 617428 | 2979.8 | 846 | 821 | 206.9 |
| D | 1 | 52 | 381392 | 1839.14 | 846 | 821 | 206.9 |
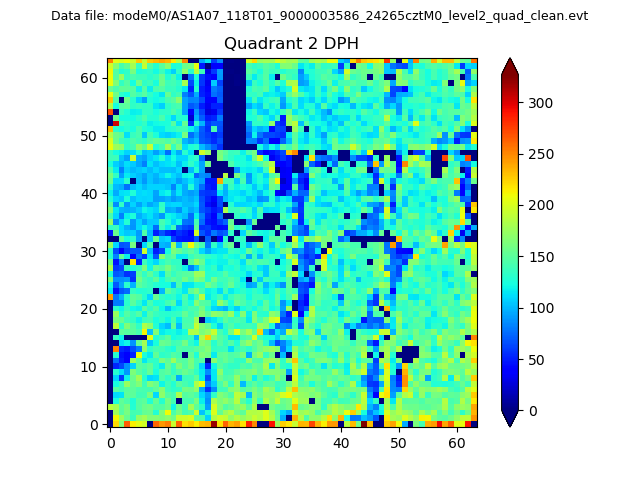
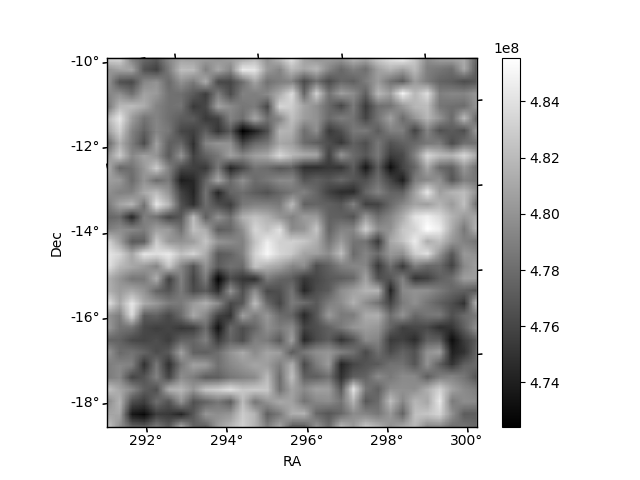
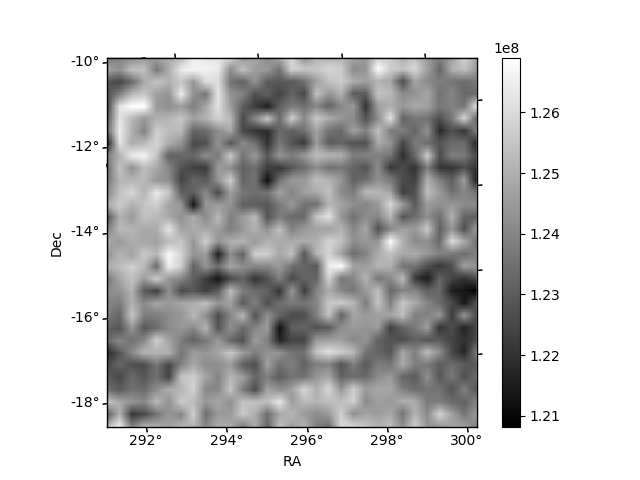
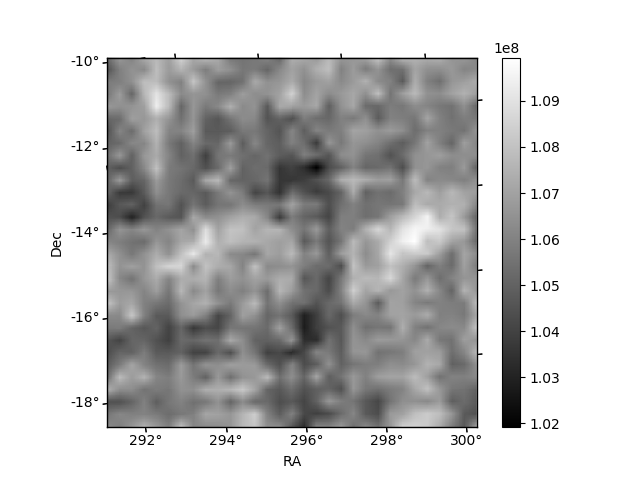
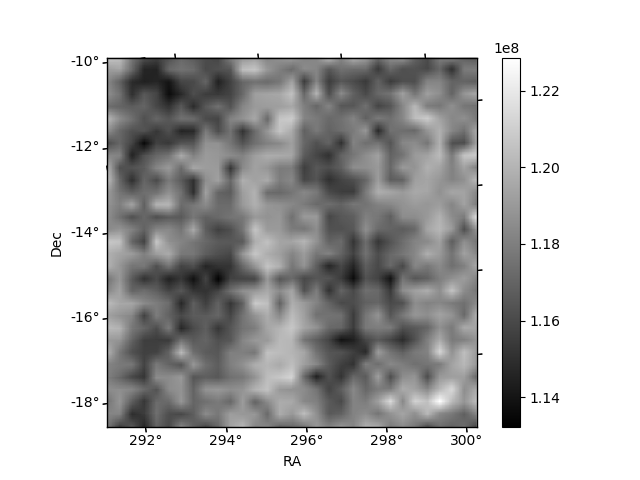
Histogram calculated using DETX and DETY for each event in the final _common_clean file
| Quadrant A | 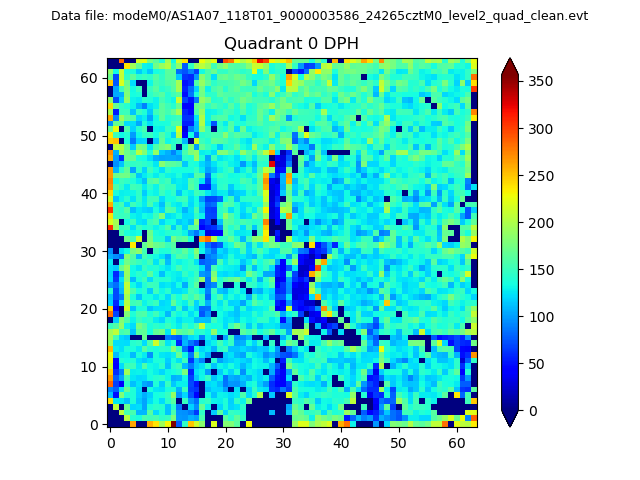 |
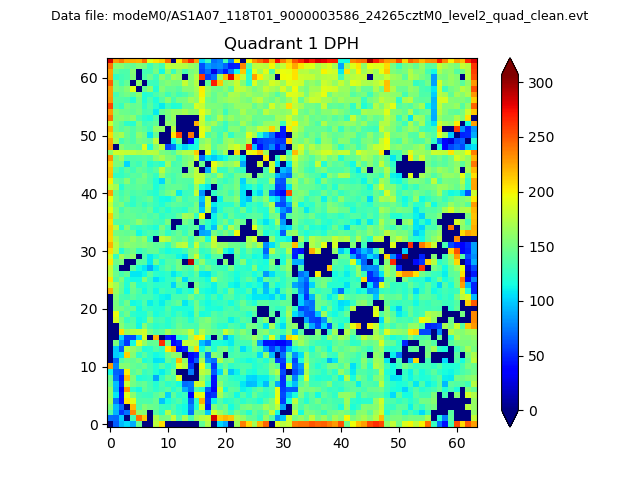 |
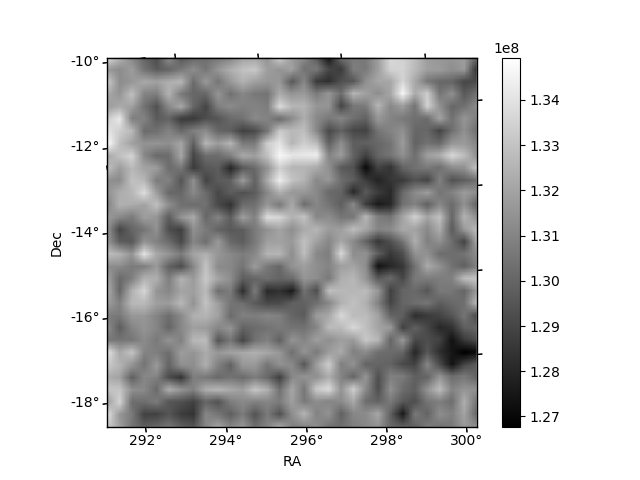
Quadrant B |
|---|---|---|---|
| Quadrant D | 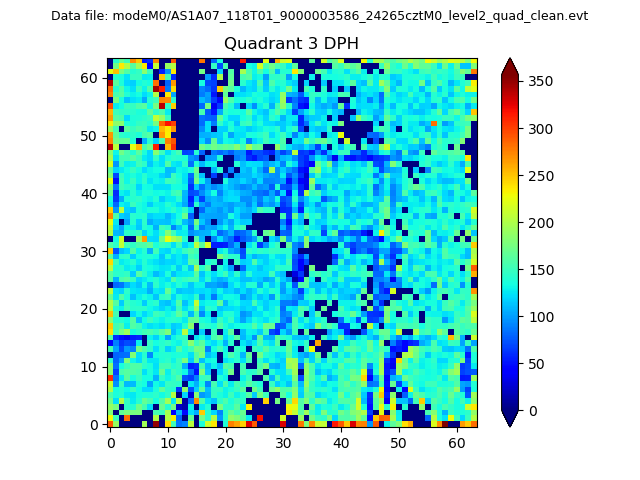 |
 |
Quadrant C |
| Plot type | Count rate plots | Images |
|---|---|---|
| Comparison with Poisson distribution Blue bars denote a histogram of data divided into 1 sec bins. Red curve is a Poisson curve with rate = median count rate of data. |
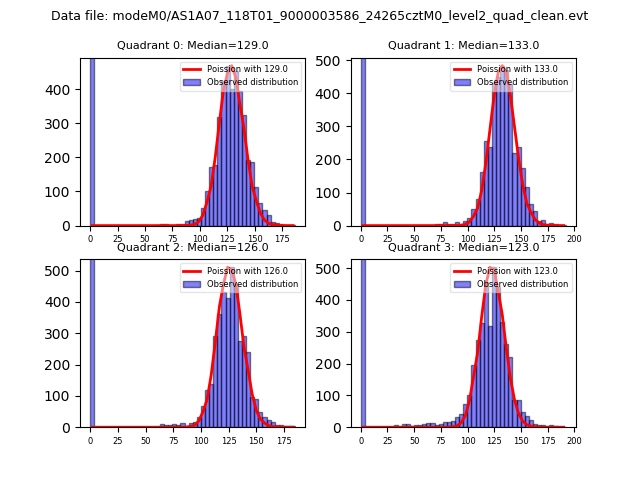 |
 |
| Quadrant-wise count rates Data is divided into 100 sec bins |
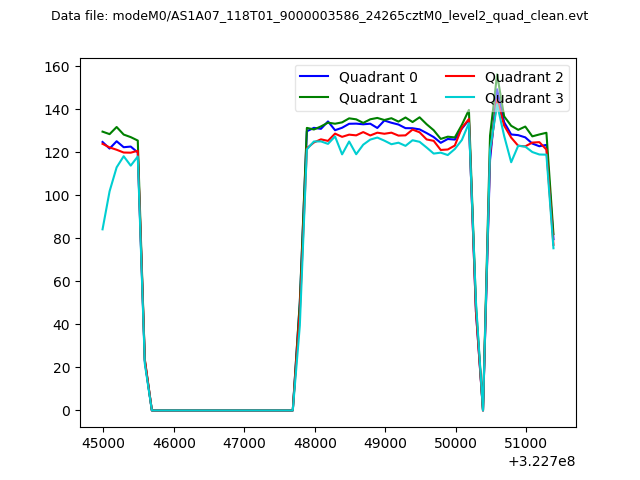 |
|
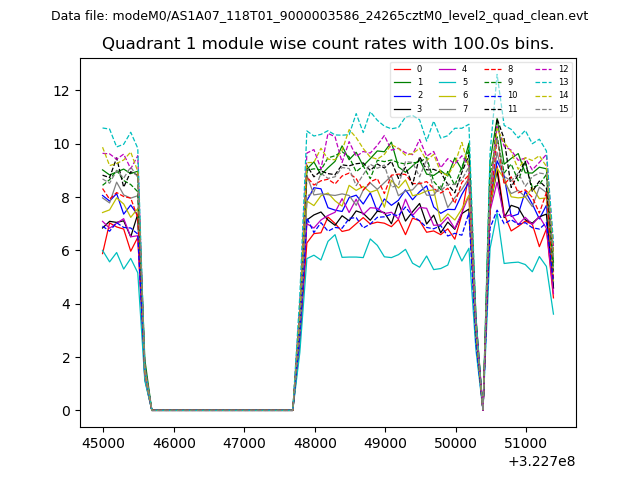
| Module-wise count rates for Quadrant A Data is divided into 100 sec bins |
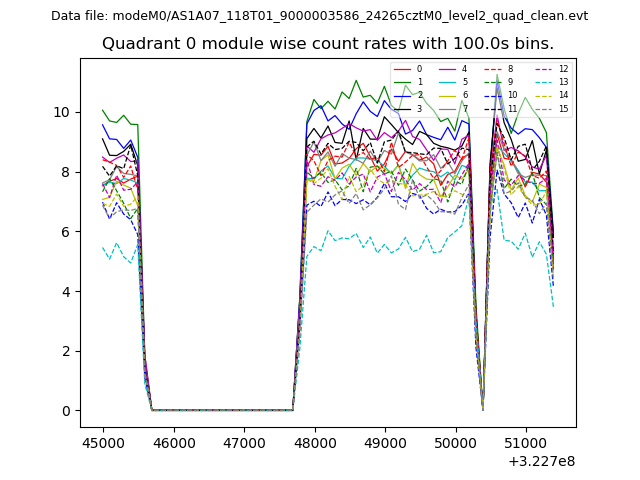 |
 |
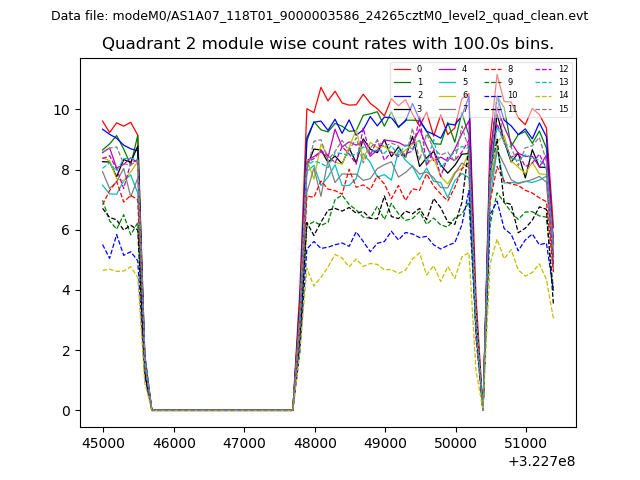
| Module-wise count rates for Quadrant B Data is divided into 100 sec bins |
 |
 |
| Module-wise count rates for Quadrant C Data is divided into 100 sec bins |
 |
 |
| Module-wise count rates for Quadrant D Data is divided into 100 sec bins |
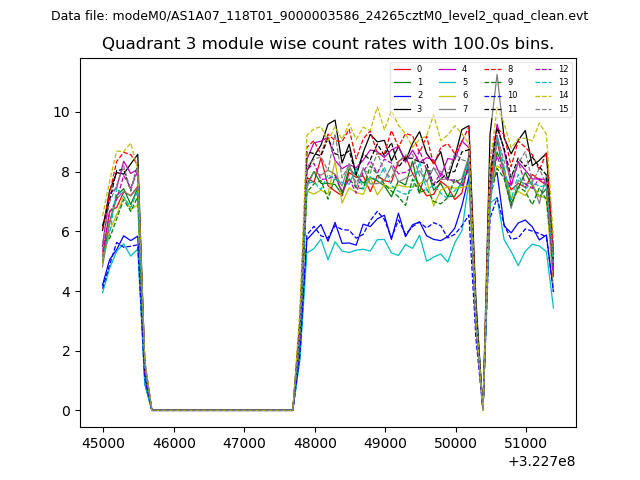 |
 |
| Parameter | Plot |
|---|---|
| CZT HV Monitor | 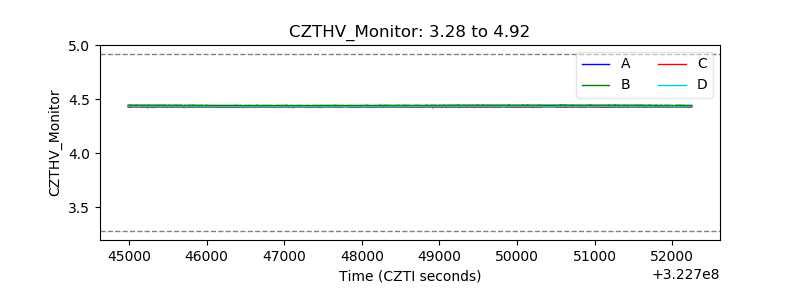 |
| D_VDD | 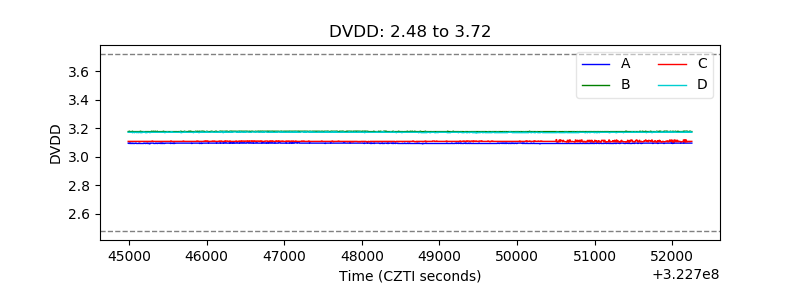 |
| Temperature 1 | 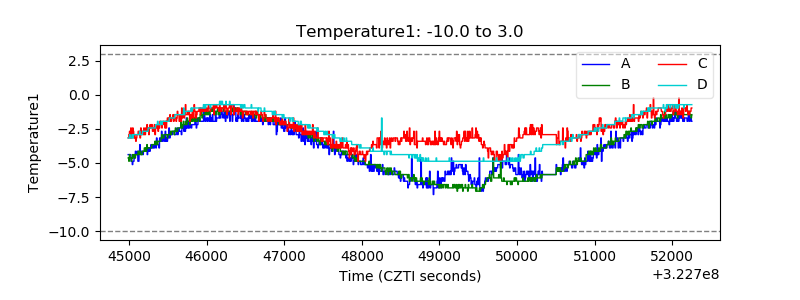 |
| Veto HV Monitor | 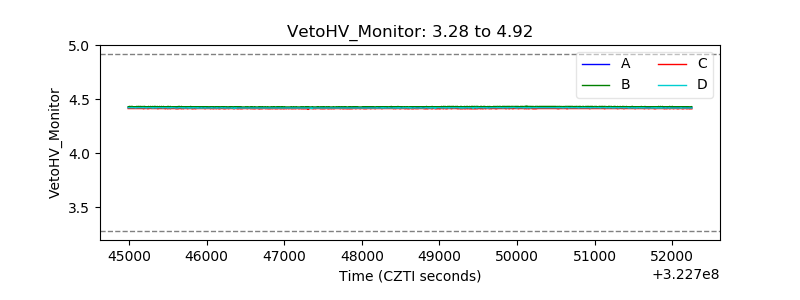 |
| Veto LLD | 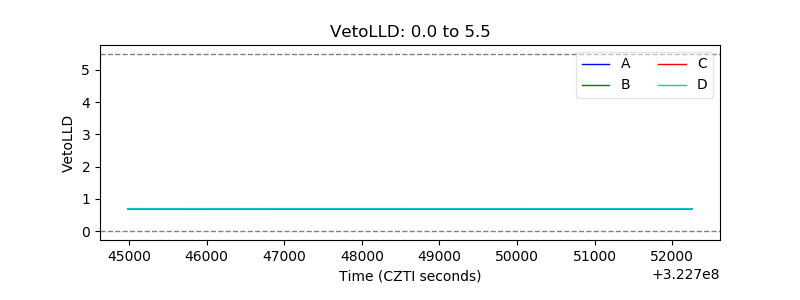 |
| Alpha Counter | 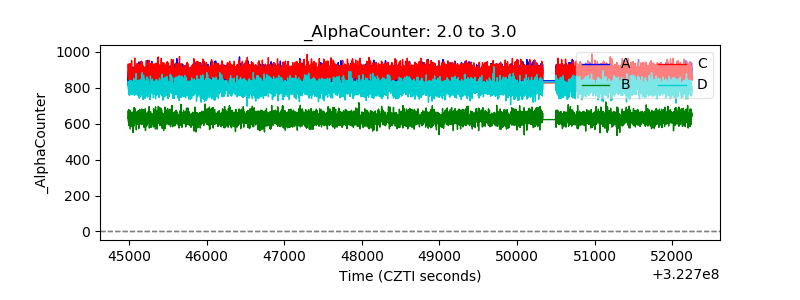 |
| _CPM_Rate | 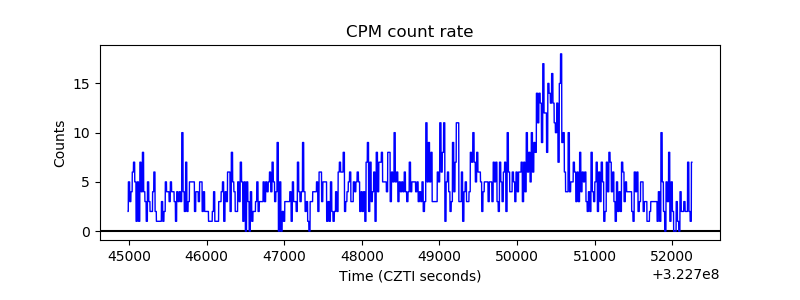 |
| CZT Counter | 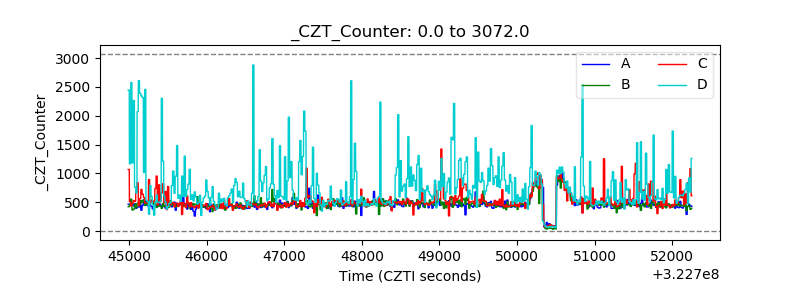 |
| +2.5 Volts monitor |  |
| +5 Volts monitor | 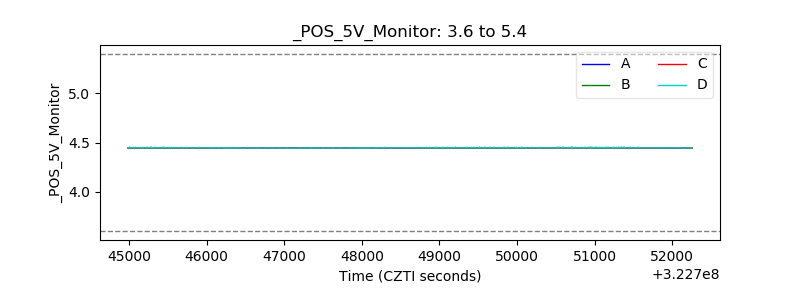 |
| _ROLL_ROT | 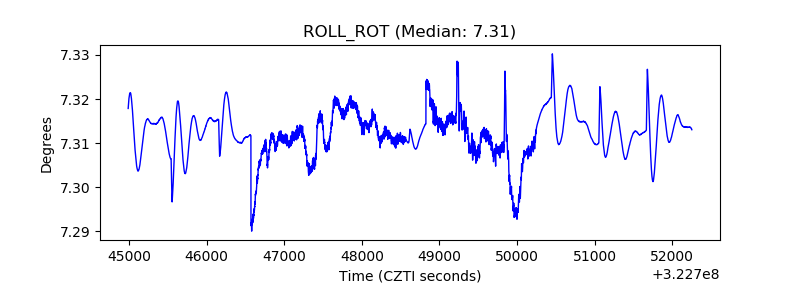 |
| _Roll_DEC | 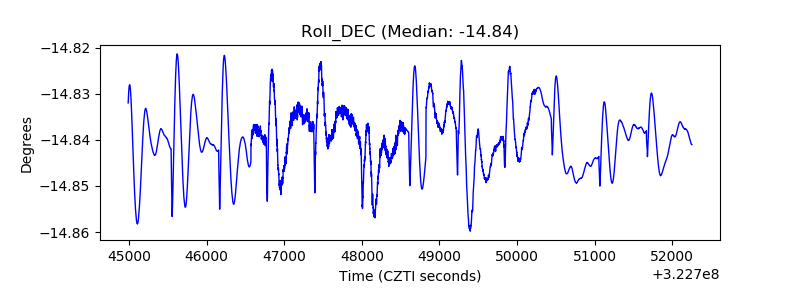 |
| _Roll_RA | 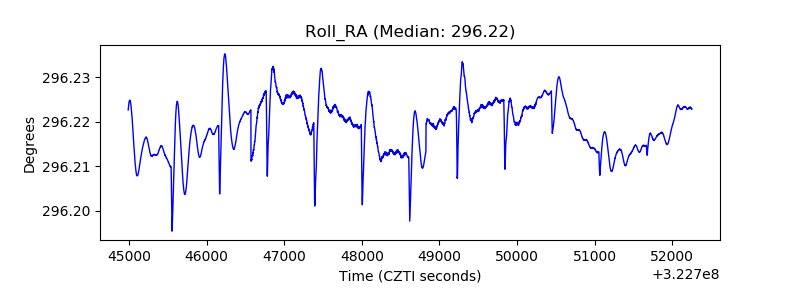 |
| Veto Counter | 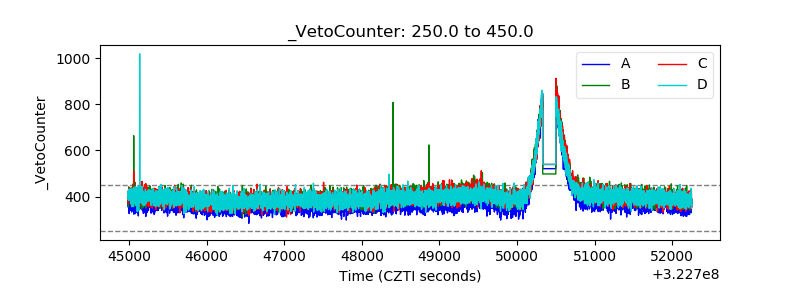 |