| Param | Original file | Final file |
|---|---|---|
| Filename | modeM0/AS1C05_007T01_9000003588cztM0_level2.fits | modeM0/AS1C05_007T01_9000003588cztM0_level2_quad_clean.evt |
| Size (bytes) | 552,646,080 | 372,242,880 |
| Size | 527.0 MB | 355.0 MB |
| Events in quadrant A | 3,475,666 | 1,972,730 |
| Events in quadrant B | 3,342,810 | 1,986,756 |
| Events in quadrant C | 3,344,964 | 1,854,819 |
| Events in quadrant D | 2,816,094 | 1,702,137 |
| Mode M0 | |||
|---|---|---|---|
| Quadrant | BADHDUFLAG | Total packets | Discarded packets |
| A | 0 | 117426 | 0 |
| B | 0 | 115190 | 0 |
| C | 0 | 157884 | 0 |
| D | 0 | 196027 | 0 |
| Mode M9 | |||
|---|---|---|---|
| Quadrant | BADHDUFLAG | Total packets | Discarded packets |
| A | 0 | 84 | 0 |
| B | 0 | 84 | 0 |
| C | 0 | 84 | 0 |
| D | 0 | 84 | 0 |
| Mode SS | |||
|---|---|---|---|
| Quadrant | BADHDUFLAG | Total packets | Discarded packets |
| A | 0 | 1116 | 0 |
| B | 0 | 1116 | 0 |
| C | 0 | 1116 | 0 |
| D | 0 | 1116 | 0 |
| Quadrant | Total seconds | Saturated seconds | Saturation percentage |
|---|---|---|---|
| A | 54719 | 1067 | 1.949963% |
| B | 54719 | 883 | 1.613699% |
| C | 54719 | 2421 | 4.424423% |
| D | 54719 | 5822 | 10.639814% |
Noise dominated data is calculated using 1-second bins in cleaned event files. If a bin has >2000 counts, and if more than 50% of those come from <1% of pixels, then it is considered to be noise-dominated and hence unusable.
| Quadrant | # 1 sec bins | Bins with >0 counts | Bins with >2000 counts | High rate bins dominated by noise | Noise dominated (total time) | Noise dominated (detector-on time) | Marked lightcurve |
|---|---|---|---|---|---|---|---|
| A | 63179 | 54709 | 0 | 0 | 0.00% | 0.00% |  |
| B | 63178 | 54708 | 0 | 0 | 0.00% | 0.00% | 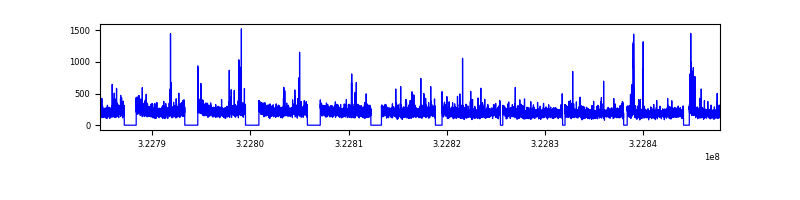 |
| C | 63179 | 54698 | 0 | 0 | 0.00% | 0.00% |  |
| D | 63179 | 54692 | 0 | 0 | 0.00% | 0.00% |  |
Top three noisy pixels from each quadrant. If the there are fewer than three noisy pixels in the level2.evt file, extra rows are filled as -1
| Pixel properties | Quadrant properties | ||||||
|---|---|---|---|---|---|---|---|
| Quadrant | DetID | PixID | Counts | Sigma | Mean | Median | Sigma |
| A | 0 | 29 | 3196 | 10.58 | 904 | 849 | 221.9 |
| A | 7 | 110 | 2772 | 8.67 | 904 | 849 | 221.9 |
| A | 9 | 19 | 2525 | 7.55 | 904 | 849 | 221.9 |
| B | 2 | 9 | 2608 | 10.04 | 881 | 839 | 176.3 |
| B | 5 | 128 | 2209 | 7.77 | 881 | 839 | 176.3 |
| B | 2 | 8 | 2178 | 7.6 | 881 | 839 | 176.3 |
| C | 1 | 80 | 2567 | 7.74 | 882 | 828 | 224.6 |
| C | 1 | 81 | 2562 | 7.72 | 882 | 828 | 224.6 |
| C | 9 | 209 | 2348 | 6.77 | 882 | 828 | 224.6 |
| D | 6 | 231 | 2019 | 5.96 | 805 | 732 | 216.0 |
| D | 7 | 3 | 1996 | 5.85 | 805 | 732 | 216.0 |
| D | 3 | 14 | 1963 | 5.7 | 805 | 732 | 216.0 |
Histogram calculated using DETX and DETY for each event in the final _common_clean file
| Quadrant A |  |
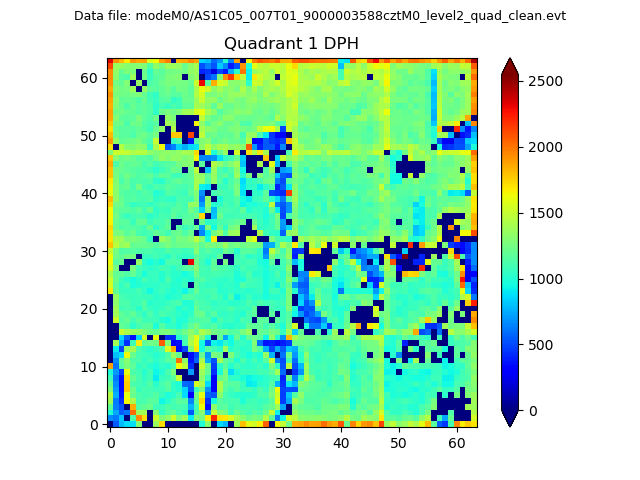 |
Quadrant B |
|---|---|---|---|
| Quadrant D |  |
 |
Quadrant C |
| Plot type | Count rate plots | Images |
|---|---|---|
| Comparison with Poisson distribution Blue bars denote a histogram of data divided into 1 sec bins. Red curve is a Poisson curve with rate = median count rate of data. |
 |
 |
| Quadrant-wise count rates Data is divided into 100 sec bins |
 |
|
| Module-wise count rates for Quadrant A Data is divided into 100 sec bins |
 |
 |
| Module-wise count rates for Quadrant B Data is divided into 100 sec bins |
 |
 |
| Module-wise count rates for Quadrant C Data is divided into 100 sec bins |
 |
 |
| Module-wise count rates for Quadrant D Data is divided into 100 sec bins |
 |
 |
| Parameter | Plot |
|---|---|
| CZT HV Monitor |  |
| D_VDD |  |
| Temperature 1 |  |
| Veto HV Monitor |  |
| Veto LLD |  |
| Alpha Counter |  |
| _CPM_Rate |  |
| CZT Counter |  |
| +2.5 Volts monitor |  |
| +5 Volts monitor |  |
| _ROLL_ROT |  |
| _Roll_DEC |  |
| _Roll_RA |  |
| Veto Counter |  |