| Param | Original file | Final file |
|---|---|---|
| Filename | modeM0/AS1C05_007T01_9000003588_24273cztM0_level2.evt | modeM0/AS1C05_007T01_9000003588_24273cztM0_level2_quad_clean.evt |
| Size (bytes) | 553,495,680 | 102,948,480 |
| Size | 527.9 MB | 98.2 MB |
| Events in quadrant A | 3,704,510 | 675,780 |
| Events in quadrant B | 3,449,604 | 697,718 |
| Events in quadrant C | 3,893,130 | 663,064 |
| Events in quadrant D | 5,280,112 | 632,865 |
| Mode M0 | |||
|---|---|---|---|
| Quadrant | BADHDUFLAG | Total packets | Discarded packets |
| A | 0 | 14802 | 2 |
| B | 0 | 14069 | 2 |
| C | 0 | 15760 | 2 |
| D | 0 | 20557 | 2 |
| Mode M9 | |||
|---|---|---|---|
| Quadrant | BADHDUFLAG | Total packets | Discarded packets |
| A | 0 | 18 | 0 |
| B | 0 | 19 | 0 |
| C | 0 | 19 | 0 |
| D | 0 | 19 | 0 |
| Mode SS | |||
|---|---|---|---|
| Quadrant | BADHDUFLAG | Total packets | Discarded packets |
| A | 0 | 132 | 0 |
| B | 0 | 132 | 0 |
| C | 0 | 132 | 0 |
| D | 0 | 132 | 0 |
| Quadrant | Total seconds | Saturated seconds | Saturation percentage |
|---|---|---|---|
| A | 6423 | 154 | 2.397634% |
| B | 6423 | 69 | 1.074264% |
| C | 6423 | 127 | 1.977269% |
| D | 6423 | 142 | 2.210805% |
Noise dominated data is calculated using 1-second bins in cleaned event files. If a bin has >2000 counts, and if more than 50% of those come from <1% of pixels, then it is considered to be noise-dominated and hence unusable.
| Quadrant | # 1 sec bins | Bins with >0 counts | Bins with >2000 counts | High rate bins dominated by noise | Noise dominated (total time) | Noise dominated (detector-on time) | Marked lightcurve |
|---|---|---|---|---|---|---|---|
| A | 7748 | 6423 | 93 | 93 | 1.20% | 1.45% | 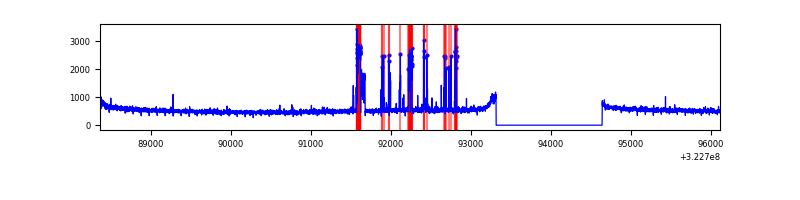 |
| B | 7748 | 6423 | 1 | 1 | 0.01% | 0.02% | 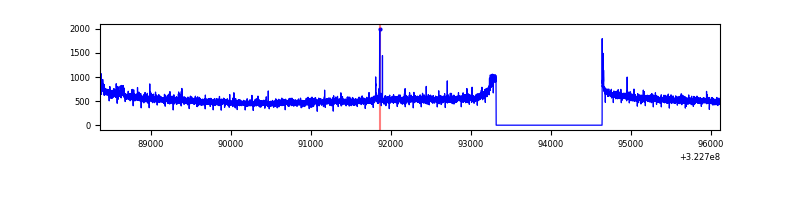 |
| C | 7748 | 6424 | 14 | 14 | 0.18% | 0.22% | 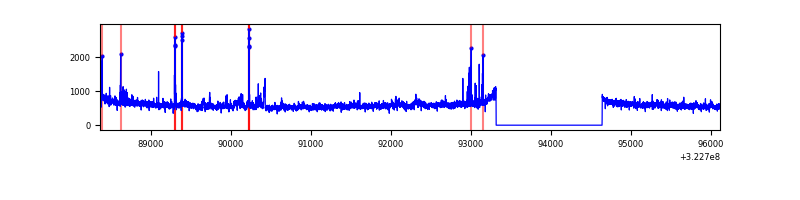 |
| D | 7748 | 6423 | 56 | 56 | 0.72% | 0.87% | 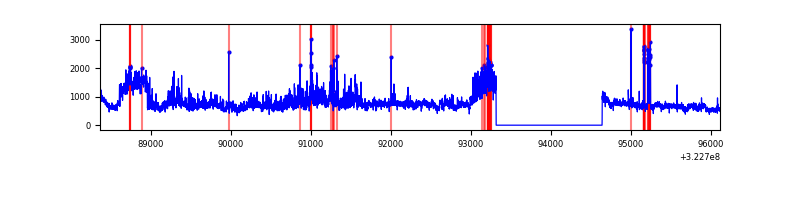 |
Top three noisy pixels from each quadrant. If the there are fewer than three noisy pixels in the level2.evt file, extra rows are filled as -1
| Pixel properties | Quadrant properties | ||||||
|---|---|---|---|---|---|---|---|
| Quadrant | DetID | PixID | Counts | Sigma | Mean | Median | Sigma |
| A | 6 | 16 | 351196 | 2009.59 | 871 | 857 | 174.3 |
| A | 13 | 254 | 9355 | 48.75 | 871 | 857 | 174.3 |
| A | 0 | 226 | 7653 | 38.98 | 871 | 857 | 174.3 |
| B | 12 | 111 | 19174 | 111.26 | 877 | 855 | 164.6 |
| B | 11 | 111 | 16848 | 97.13 | 877 | 855 | 164.6 |
| B | 14 | 111 | 15276 | 87.59 | 877 | 855 | 164.6 |
| C | 7 | 247 | 288678 | 1457.1 | 849 | 858 | 197.5 |
| C | 2 | 16 | 153964 | 775.1 | 849 | 858 | 197.5 |
| C | 14 | 238 | 138191 | 695.25 | 849 | 858 | 197.5 |
| D | 1 | 52 | 1191895 | 5876.7 | 850 | 832 | 202.7 |
| D | 8 | 195 | 739052 | 3642.38 | 850 | 832 | 202.7 |
| D | 12 | 233 | 87657 | 428.39 | 850 | 832 | 202.7 |
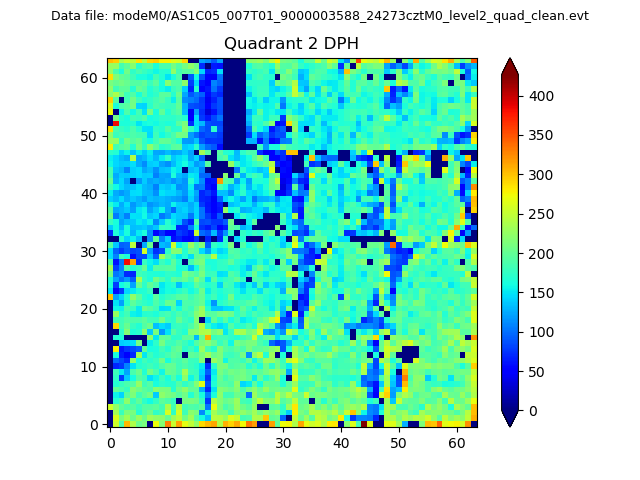
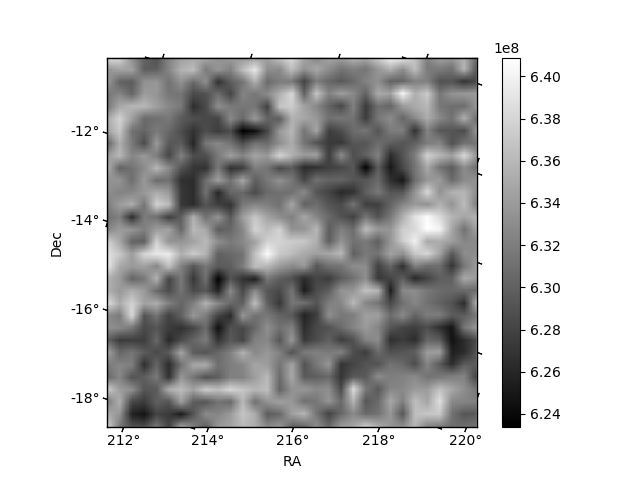
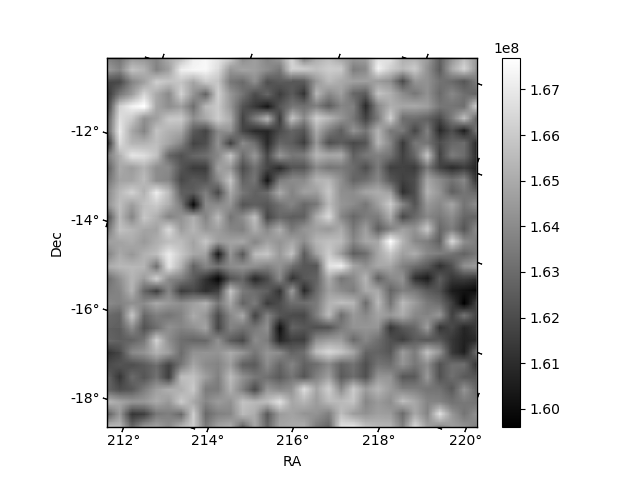
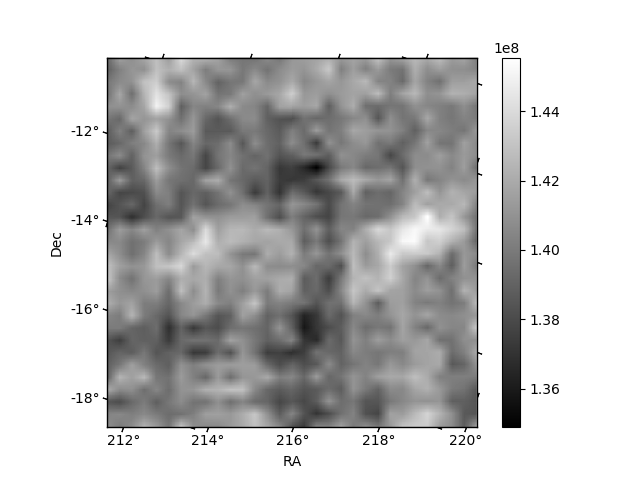
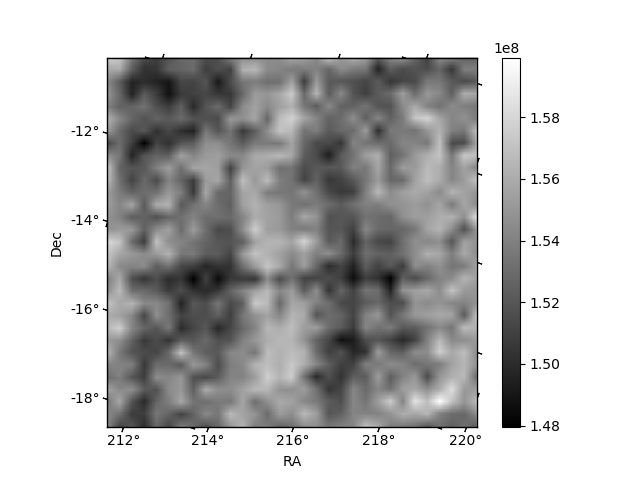
Histogram calculated using DETX and DETY for each event in the final _common_clean file
| Quadrant A | 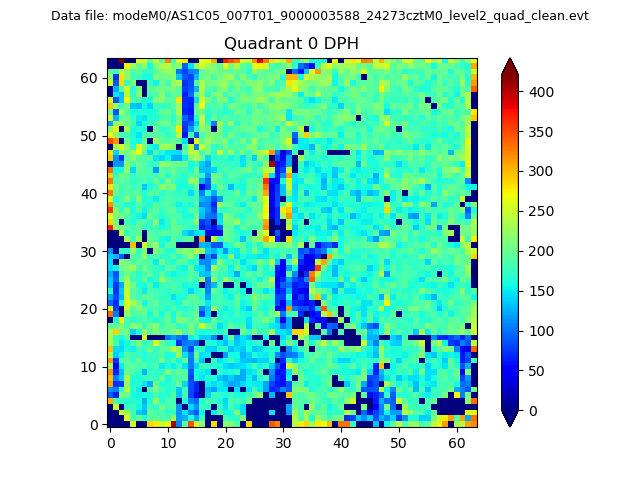 |
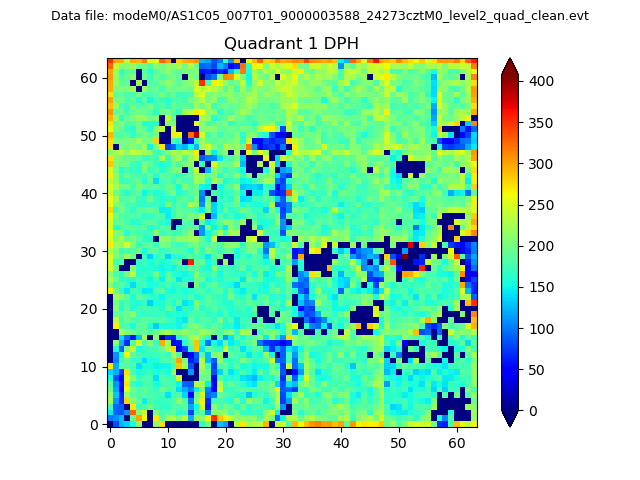 |
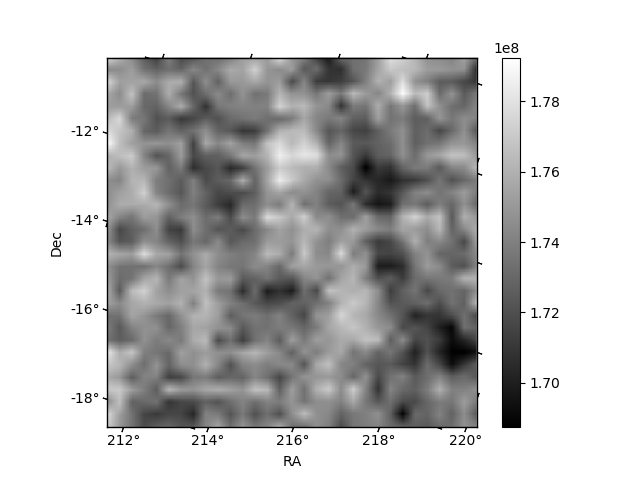
Quadrant B |
|---|---|---|---|
| Quadrant D | 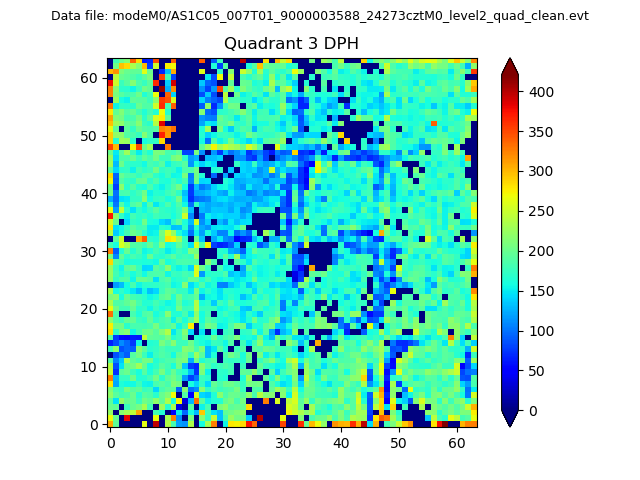 |
 |
Quadrant C |
| Plot type | Count rate plots | Images |
|---|---|---|
| Comparison with Poisson distribution Blue bars denote a histogram of data divided into 1 sec bins. Red curve is a Poisson curve with rate = median count rate of data. |
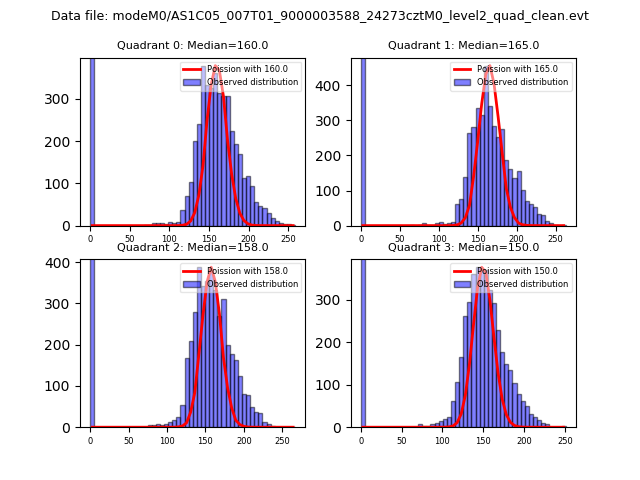 |
 |
| Quadrant-wise count rates Data is divided into 100 sec bins |
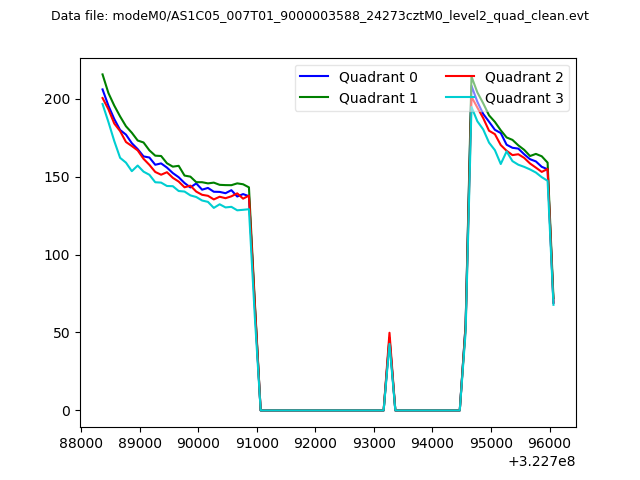 |
|
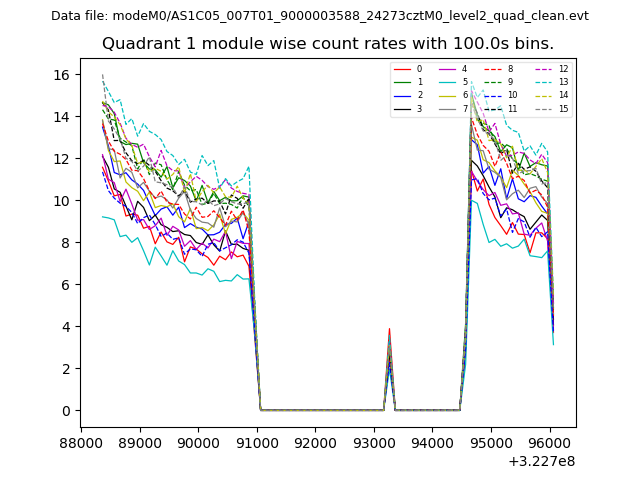
| Module-wise count rates for Quadrant A Data is divided into 100 sec bins |
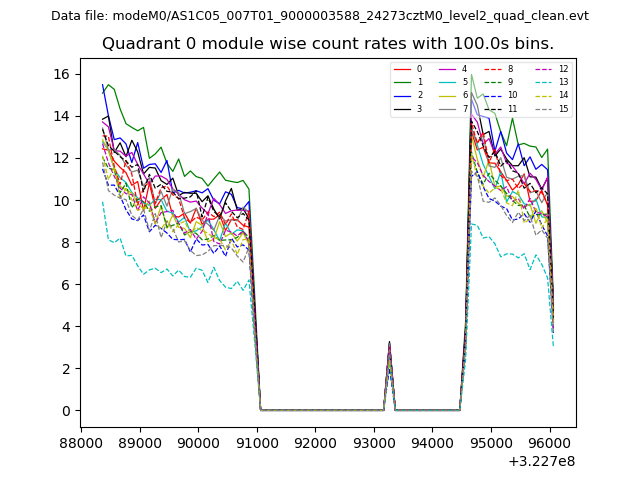 |
 |
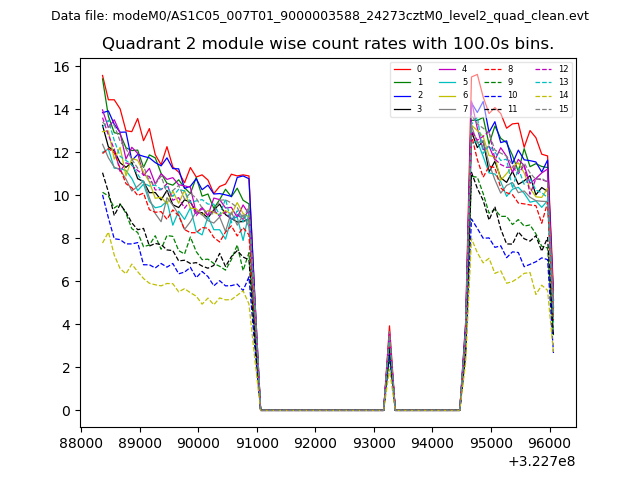
| Module-wise count rates for Quadrant B Data is divided into 100 sec bins |
 |
 |
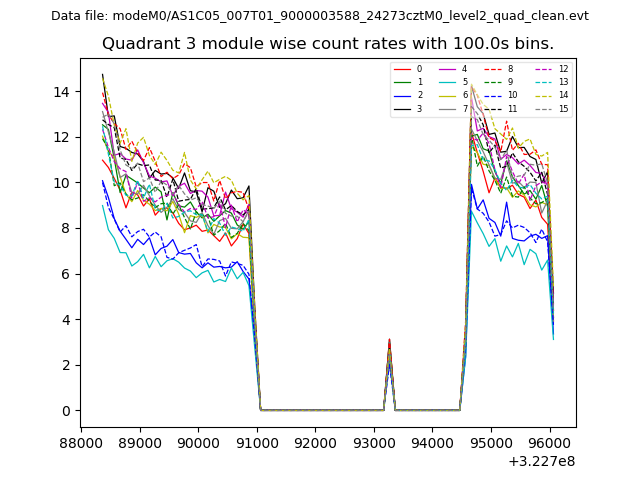
| Module-wise count rates for Quadrant C Data is divided into 100 sec bins |
 |
 |
| Module-wise count rates for Quadrant D Data is divided into 100 sec bins |
 |
 |
| Parameter | Plot |
|---|---|
| CZT HV Monitor | 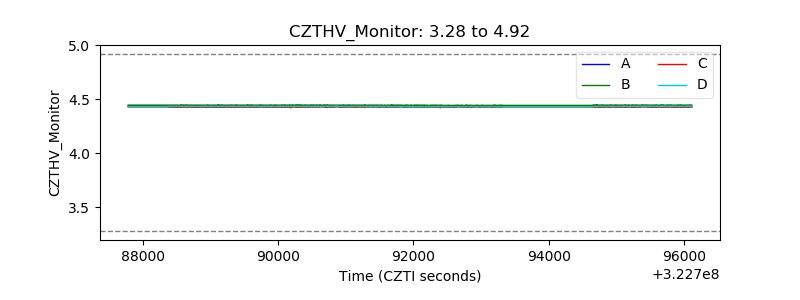 |
| D_VDD | 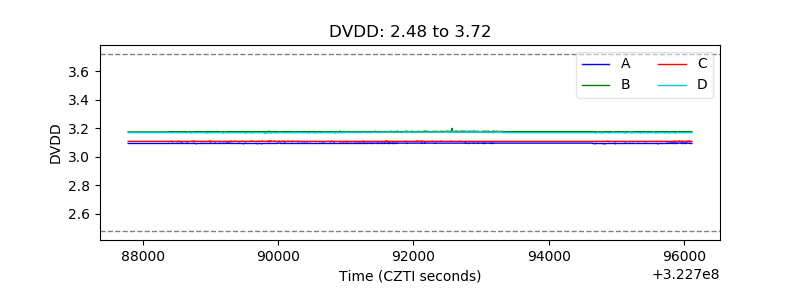 |
| Temperature 1 | 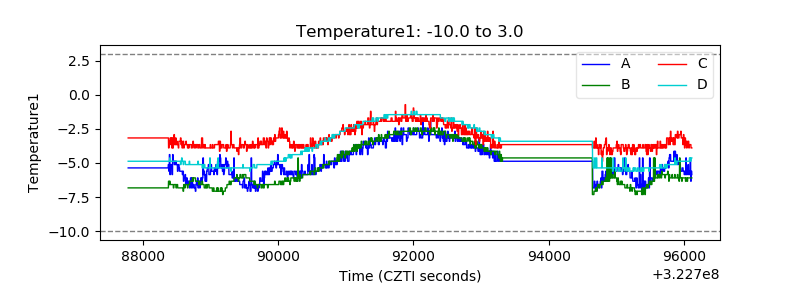 |
| Veto HV Monitor |  |
| Veto LLD | 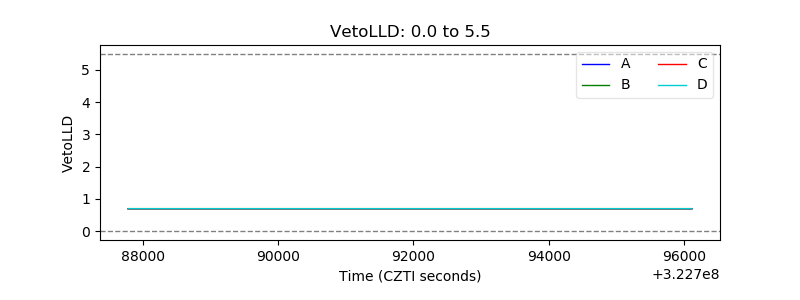 |
| Alpha Counter | 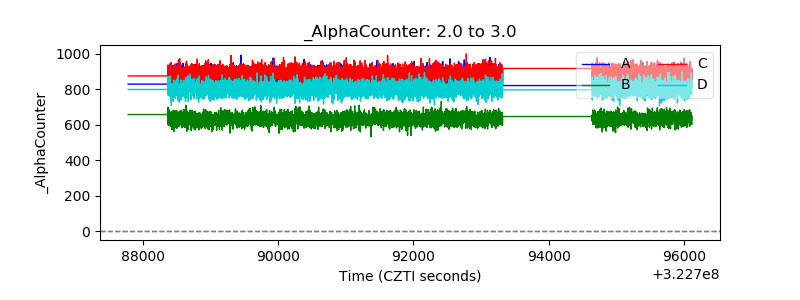 |
| _CPM_Rate | 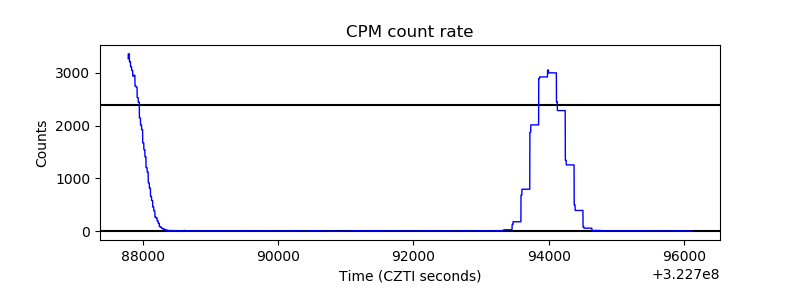 |
| CZT Counter | 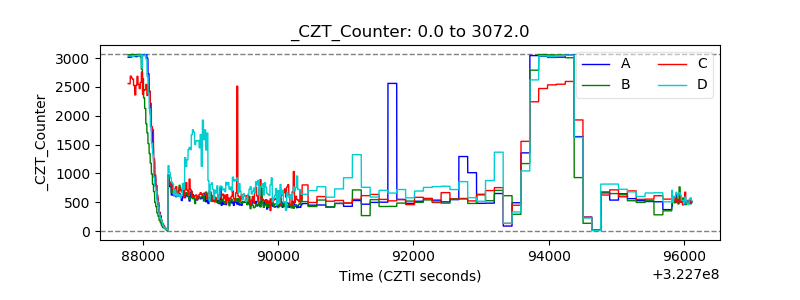 |
| +2.5 Volts monitor |  |
| +5 Volts monitor |  |
| _ROLL_ROT | 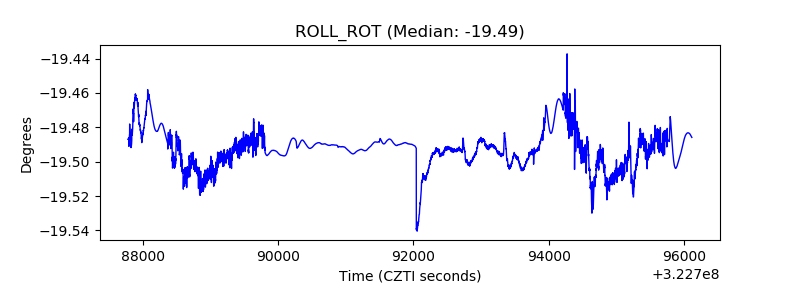 |
| _Roll_DEC | 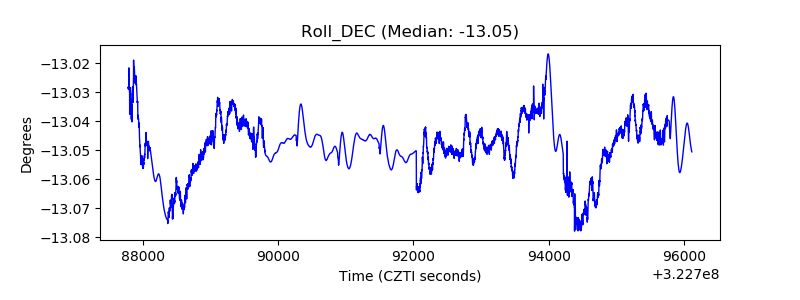 |
| _Roll_RA | 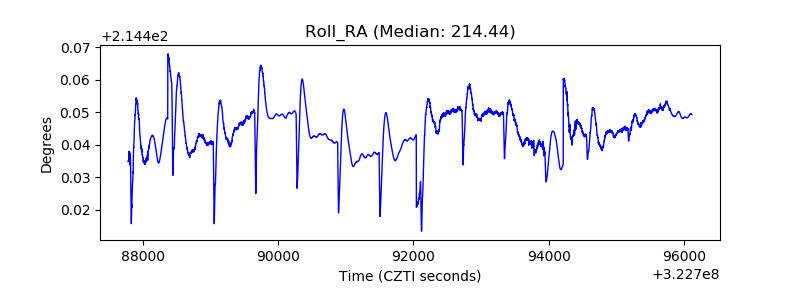 |
| Veto Counter | 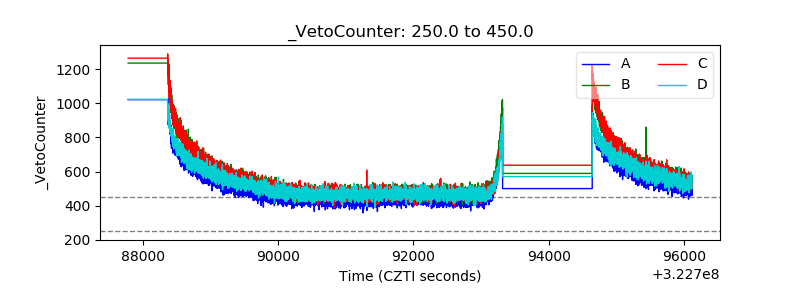 |