| Param | Original file | Final file |
|---|---|---|
| Filename | modeM0/AS1C05_007T01_9000003588_24275cztM0_level2.evt | modeM0/AS1C05_007T01_9000003588_24275cztM0_level2_quad_clean.evt |
| Size (bytes) | 743,624,640 | 95,192,640 |
| Size | 709.2 MB | 90.8 MB |
| Events in quadrant A | 3,395,728 | 640,989 |
| Events in quadrant B | 3,338,741 | 656,251 |
| Events in quadrant C | 3,810,982 | 628,227 |
| Events in quadrant D | 11,552,635 | 519,991 |
| Mode M0 | |||
|---|---|---|---|
| Quadrant | BADHDUFLAG | Total packets | Discarded packets |
| A | 0 | 13500 | 2 |
| B | 0 | 13385 | 2 |
| C | 0 | 15565 | 2 |
| D | 0 | 38655 | 2 |
| Mode M9 | |||
|---|---|---|---|
| Quadrant | BADHDUFLAG | Total packets | Discarded packets |
| A | 0 | 16 | 0 |
| B | 0 | 17 | 0 |
| C | 0 | 17 | 0 |
| D | 0 | 17 | 0 |
| Mode SS | |||
|---|---|---|---|
| Quadrant | BADHDUFLAG | Total packets | Discarded packets |
| A | 0 | 128 | 0 |
| B | 0 | 128 | 0 |
| C | 0 | 128 | 0 |
| D | 0 | 128 | 0 |
| Quadrant | Total seconds | Saturated seconds | Saturation percentage |
|---|---|---|---|
| A | 6255 | 85 | 1.358913% |
| B | 6255 | 76 | 1.215028% |
| C | 6255 | 100 | 1.598721% |
| D | 6255 | 3021 | 48.297362% |
Noise dominated data is calculated using 1-second bins in cleaned event files. If a bin has >2000 counts, and if more than 50% of those come from <1% of pixels, then it is considered to be noise-dominated and hence unusable.
| Quadrant | # 1 sec bins | Bins with >0 counts | Bins with >2000 counts | High rate bins dominated by noise | Noise dominated (total time) | Noise dominated (detector-on time) | Marked lightcurve |
|---|---|---|---|---|---|---|---|
| A | 7575 | 6255 | 17 | 17 | 0.22% | 0.27% | 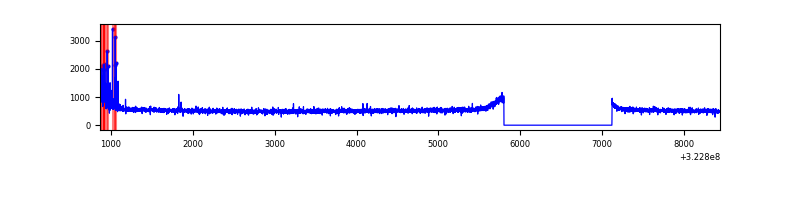 |
| B | 7575 | 6255 | 0 | 0 | 0.00% | 0.00% | 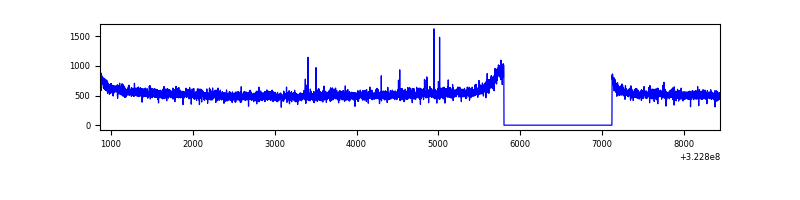 |
| C | 7575 | 6255 | 1 | 1 | 0.01% | 0.02% | 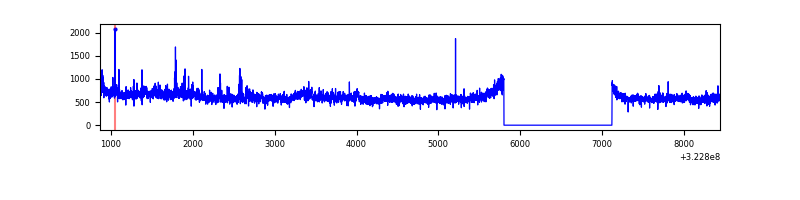 |
| D | 7574 | 6254 | 3008 | 3008 | 39.71% | 48.10% | 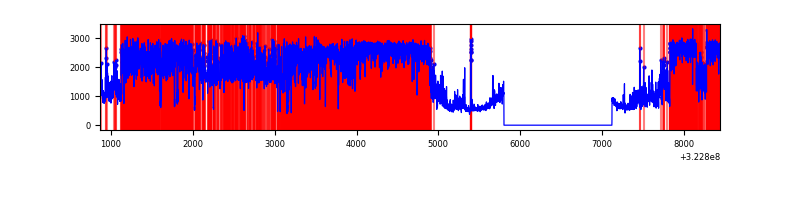 |
Top three noisy pixels from each quadrant. If the there are fewer than three noisy pixels in the level2.evt file, extra rows are filled as -1
| Pixel properties | Quadrant properties | ||||||
|---|---|---|---|---|---|---|---|
| Quadrant | DetID | PixID | Counts | Sigma | Mean | Median | Sigma |
| A | 6 | 16 | 86981 | 502.04 | 859 | 843 | 171.6 |
| A | 13 | 254 | 9331 | 49.47 | 859 | 843 | 171.6 |
| A | 0 | 226 | 7345 | 37.9 | 859 | 843 | 171.6 |
| B | 12 | 111 | 18633 | 110.83 | 851 | 832 | 160.6 |
| B | 11 | 111 | 16982 | 100.55 | 851 | 832 | 160.6 |
| B | 14 | 111 | 15085 | 88.74 | 851 | 832 | 160.6 |
| C | 7 | 247 | 368193 | 1900.77 | 830 | 840 | 193.3 |
| C | 14 | 238 | 131068 | 673.83 | 830 | 840 | 193.3 |
| C | 2 | 16 | 71660 | 366.44 | 830 | 840 | 193.3 |
| D | 1 | 52 | 6217876 | 37204.36 | 689 | 672 | 167.1 |
| D | 1 | 239 | 1212099 | 7249.3 | 689 | 672 | 167.1 |
| D | 8 | 195 | 1208810 | 7229.62 | 689 | 672 | 167.1 |
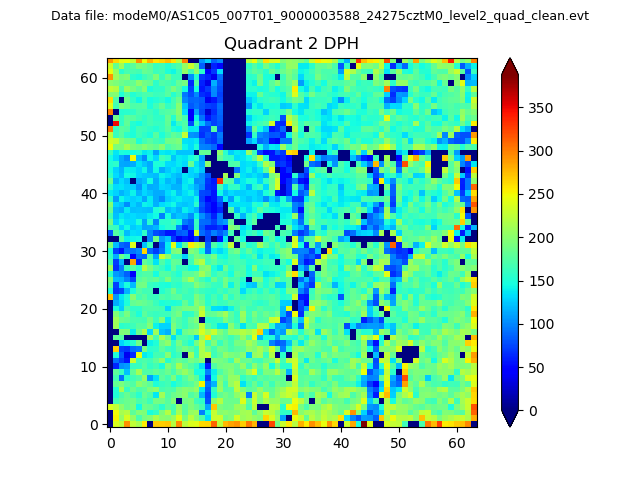
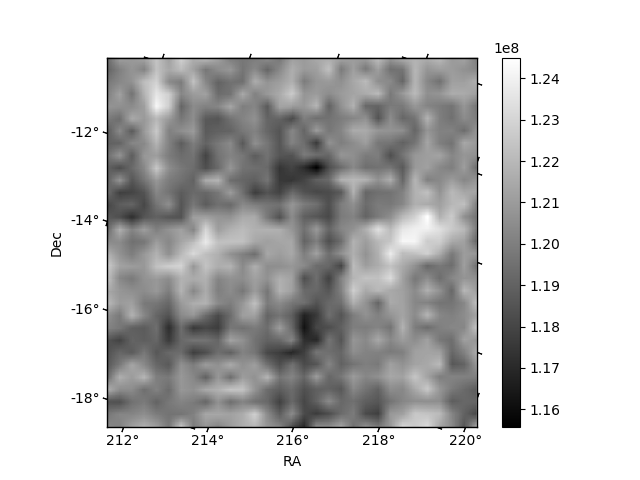
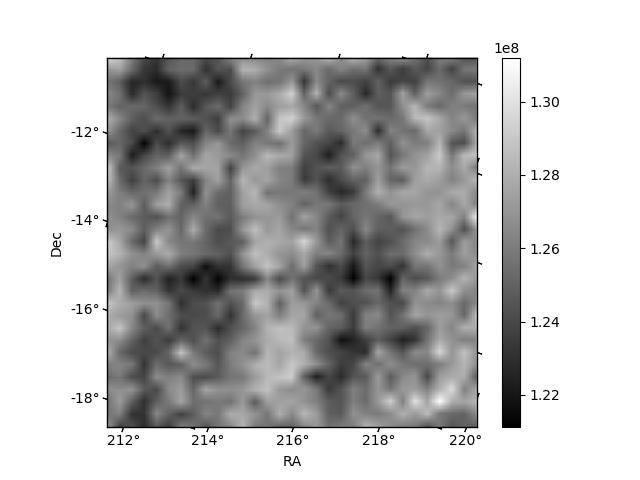
Histogram calculated using DETX and DETY for each event in the final _common_clean file
| Quadrant A | 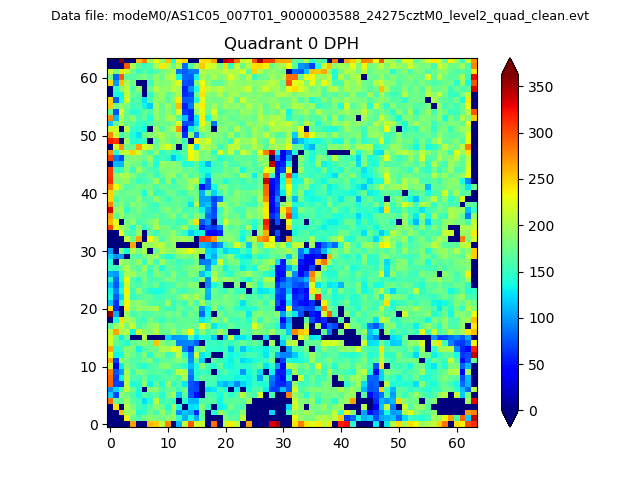 |
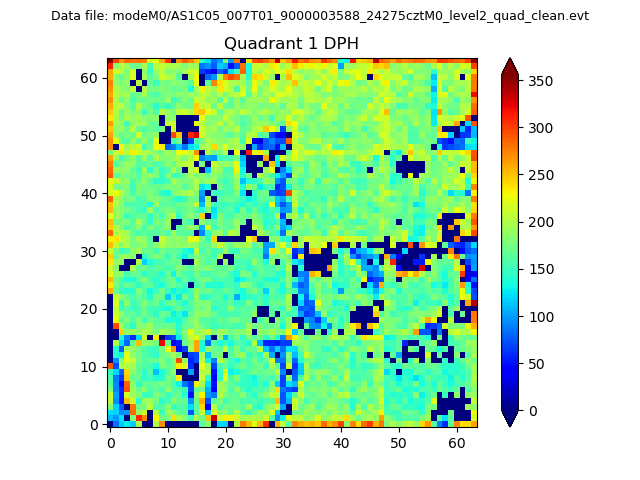 |
Quadrant B |
|---|---|---|---|
| Quadrant D | 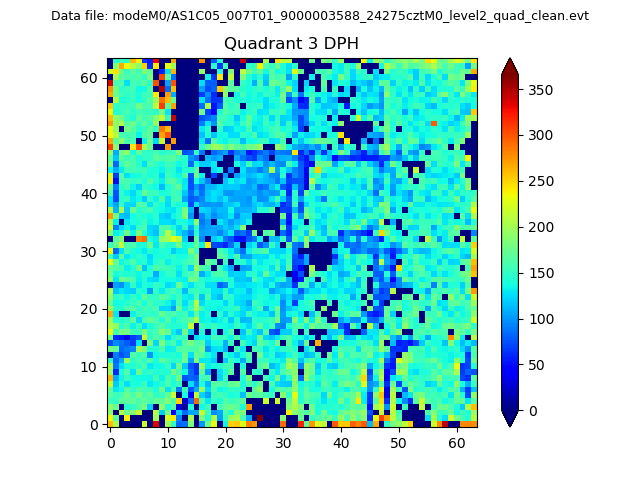 |
 |
Quadrant C |
| Plot type | Count rate plots | Images |
|---|---|---|
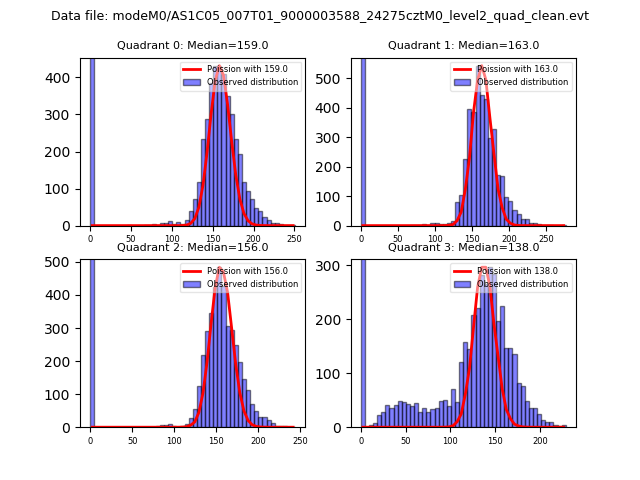
| Comparison with Poisson distribution Blue bars denote a histogram of data divided into 1 sec bins. Red curve is a Poisson curve with rate = median count rate of data. |
 |
 |
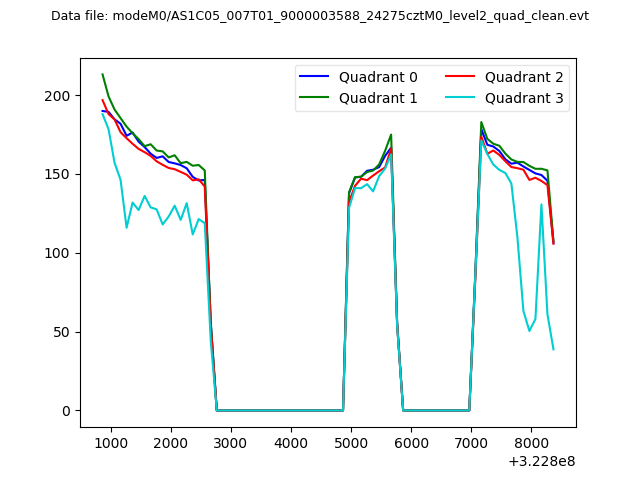
| Quadrant-wise count rates Data is divided into 100 sec bins |
 |
|
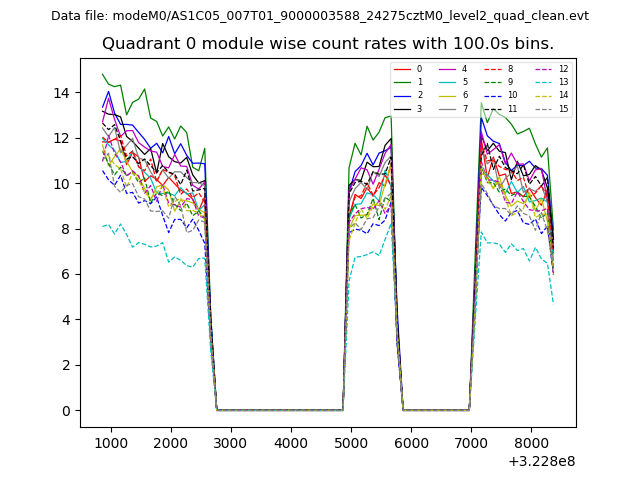
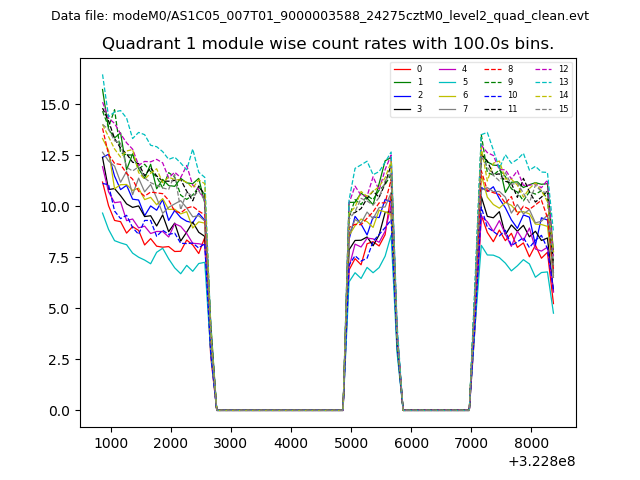
| Module-wise count rates for Quadrant A Data is divided into 100 sec bins |
 |
 |
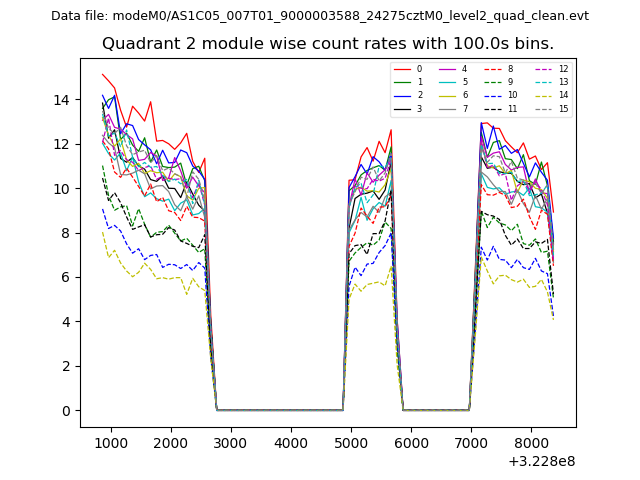
| Module-wise count rates for Quadrant B Data is divided into 100 sec bins |
 |
 |
| Module-wise count rates for Quadrant C Data is divided into 100 sec bins |
 |
 |
| Module-wise count rates for Quadrant D Data is divided into 100 sec bins |
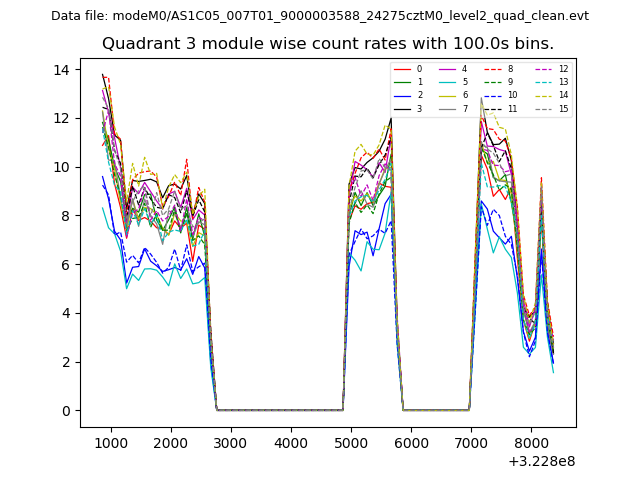 |
 |
| Parameter | Plot |
|---|---|
| CZT HV Monitor | 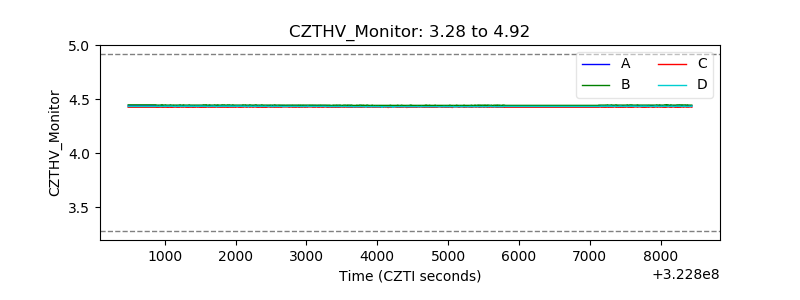 |
| D_VDD | 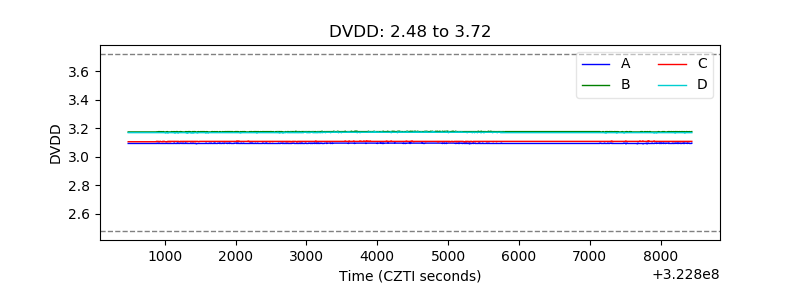 |
| Temperature 1 | 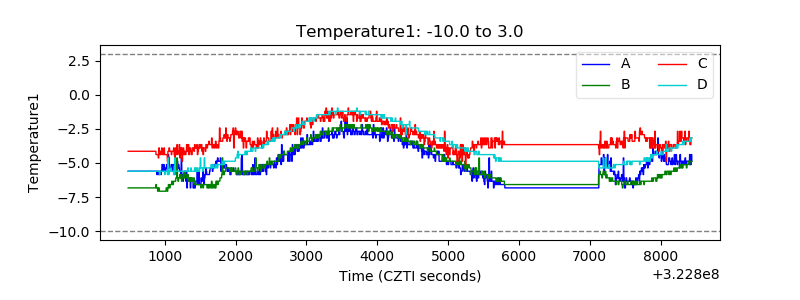 |
| Veto HV Monitor | 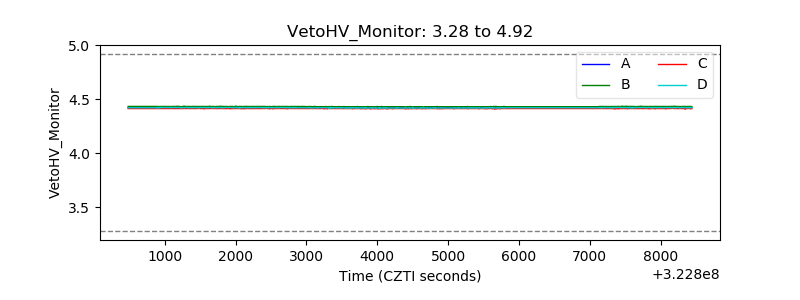 |
| Veto LLD |  |
| Alpha Counter | 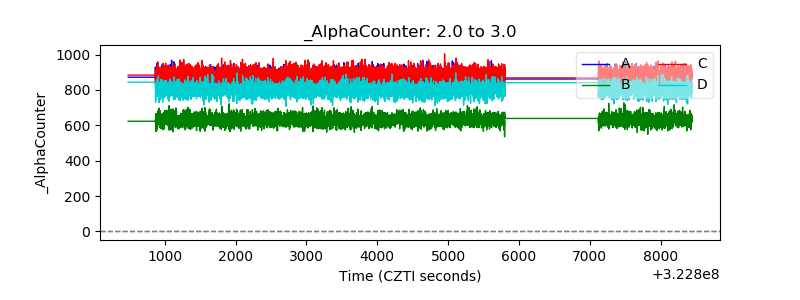 |
| _CPM_Rate |  |
| CZT Counter | 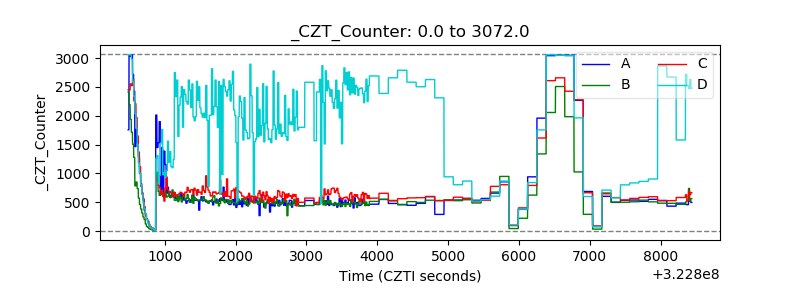 |
| +2.5 Volts monitor |  |
| +5 Volts monitor | 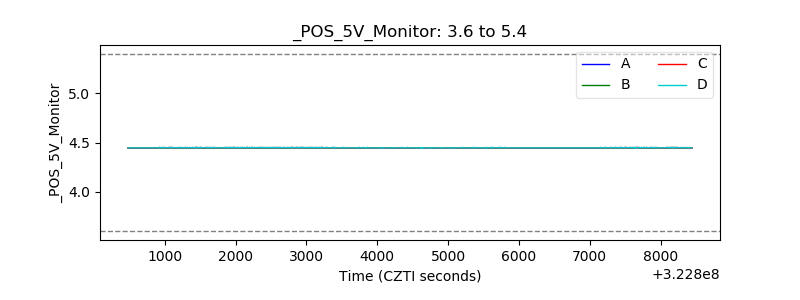 |
| _ROLL_ROT | 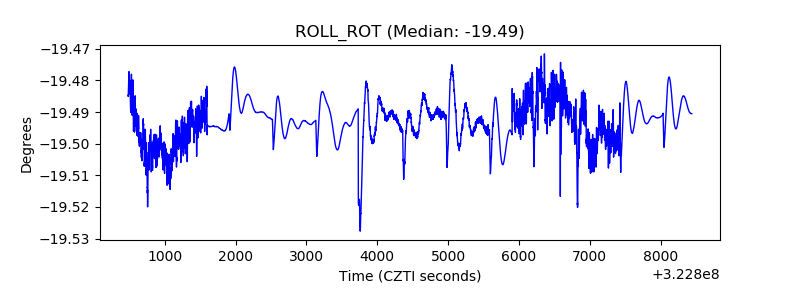 |
| _Roll_DEC | 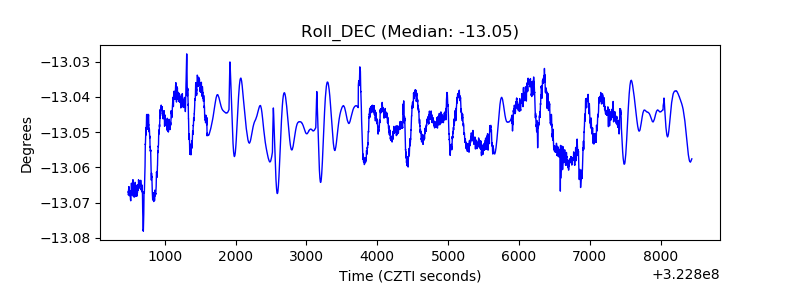 |
| _Roll_RA | 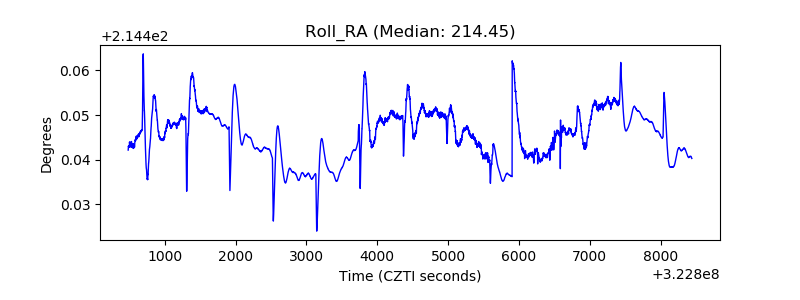 |
| Veto Counter | 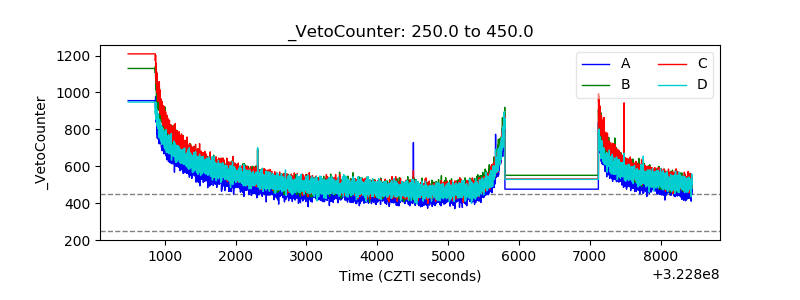 |