| Param | Original file | Final file |
|---|---|---|
| Filename | modeM0/AS1C05_007T01_9000003588_24276cztM0_level2.evt | modeM0/AS1C05_007T01_9000003588_24276cztM0_level2_quad_clean.evt |
| Size (bytes) | 583,113,600 | 73,981,440 |
| Size | 556.1 MB | 70.6 MB |
| Events in quadrant A | 2,987,743 | 480,833 |
| Events in quadrant B | 3,009,329 | 490,998 |
| Events in quadrant C | 3,604,086 | 466,209 |
| Events in quadrant D | 7,659,387 | 389,622 |
| Mode M0 | |||
|---|---|---|---|
| Quadrant | BADHDUFLAG | Total packets | Discarded packets |
| A | 0 | 12190 | 1 |
| B | 0 | 12286 | 1 |
| C | 0 | 14753 | 1 |
| D | 0 | 27045 | 2 |
| Mode M9 | |||
|---|---|---|---|
| Quadrant | BADHDUFLAG | Total packets | Discarded packets |
| A | 0 | 11 | 0 |
| B | 0 | 11 | 0 |
| C | 0 | 11 | 0 |
| D | 0 | 11 | 0 |
| Mode SS | |||
|---|---|---|---|
| Quadrant | BADHDUFLAG | Total packets | Discarded packets |
| A | 0 | 120 | 0 |
| B | 0 | 120 | 0 |
| C | 0 | 120 | 0 |
| D | 0 | 120 | 0 |
| Quadrant | Total seconds | Saturated seconds | Saturation percentage |
|---|---|---|---|
| A | 5898 | 92 | 1.559851% |
| B | 5898 | 95 | 1.610715% |
| C | 5899 | 148 | 2.508900% |
| D | 5898 | 1200 | 20.345880% |
Noise dominated data is calculated using 1-second bins in cleaned event files. If a bin has >2000 counts, and if more than 50% of those come from <1% of pixels, then it is considered to be noise-dominated and hence unusable.
| Quadrant | # 1 sec bins | Bins with >0 counts | Bins with >2000 counts | High rate bins dominated by noise | Noise dominated (total time) | Noise dominated (detector-on time) | Marked lightcurve |
|---|---|---|---|---|---|---|---|
| A | 6978 | 5898 | 0 | 0 | 0.00% | 0.00% | 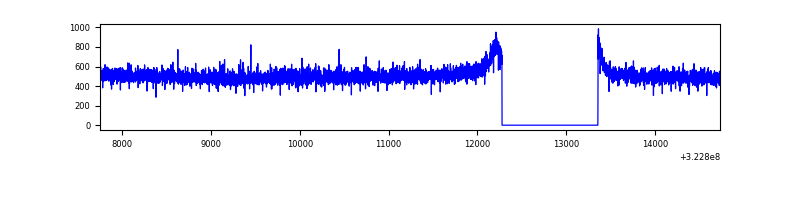 |
| B | 6978 | 5898 | 1 | 1 | 0.01% | 0.02% | 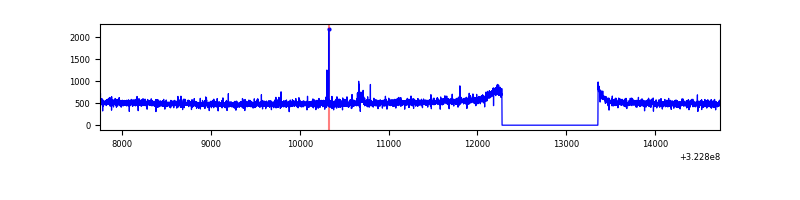 |
| C | 6979 | 5899 | 5 | 5 | 0.07% | 0.08% | 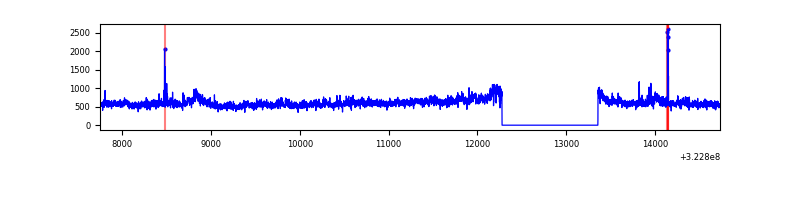 |
| D | 6978 | 5898 | 1141 | 1141 | 16.35% | 19.35% | 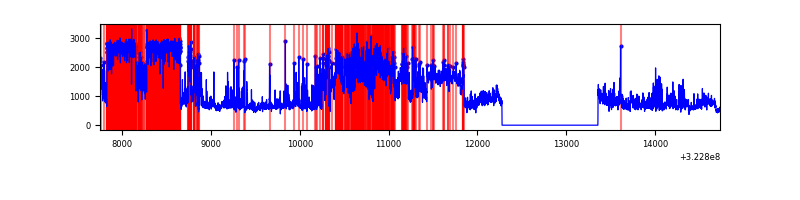 |
Top three noisy pixels from each quadrant. If the there are fewer than three noisy pixels in the level2.evt file, extra rows are filled as -1
| Pixel properties | Quadrant properties | ||||||
|---|---|---|---|---|---|---|---|
| Quadrant | DetID | PixID | Counts | Sigma | Mean | Median | Sigma |
| A | 13 | 254 | 8363 | 48.84 | 775 | 759 | 155.7 |
| A | 0 | 226 | 6791 | 38.74 | 775 | 759 | 155.7 |
| A | 3 | 137 | 6511 | 36.94 | 775 | 759 | 155.7 |
| B | 12 | 111 | 17825 | 116.31 | 764 | 745 | 146.9 |
| B | 11 | 111 | 15985 | 103.78 | 764 | 745 | 146.9 |
| B | 14 | 111 | 14118 | 91.07 | 764 | 745 | 146.9 |
| C | 7 | 247 | 484595 | 2783.43 | 745 | 753 | 173.8 |
| C | 14 | 238 | 119229 | 681.56 | 745 | 753 | 173.8 |
| C | 2 | 16 | 52844 | 299.67 | 745 | 753 | 173.8 |
| D | 1 | 52 | 2707465 | 15945.17 | 698 | 679 | 169.8 |
| D | 1 | 239 | 1676548 | 9872.23 | 698 | 679 | 169.8 |
| D | 8 | 195 | 596021 | 3507.05 | 698 | 679 | 169.8 |
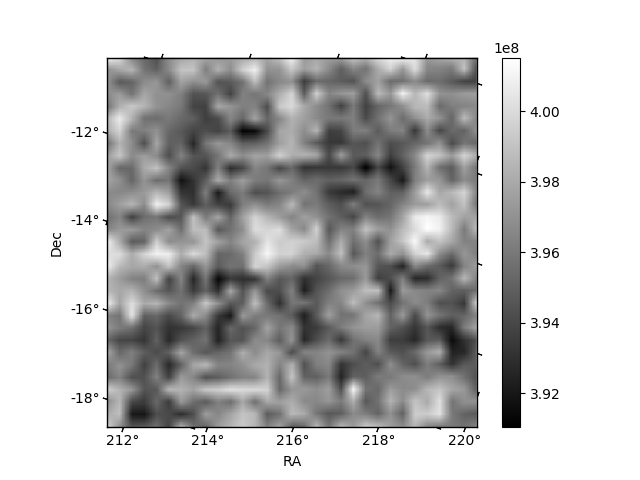
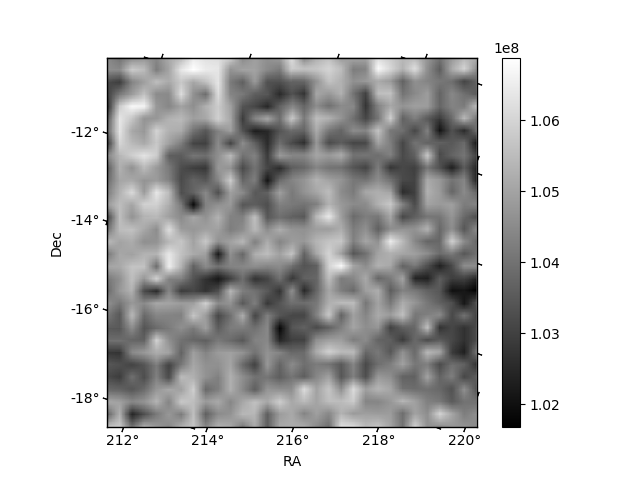
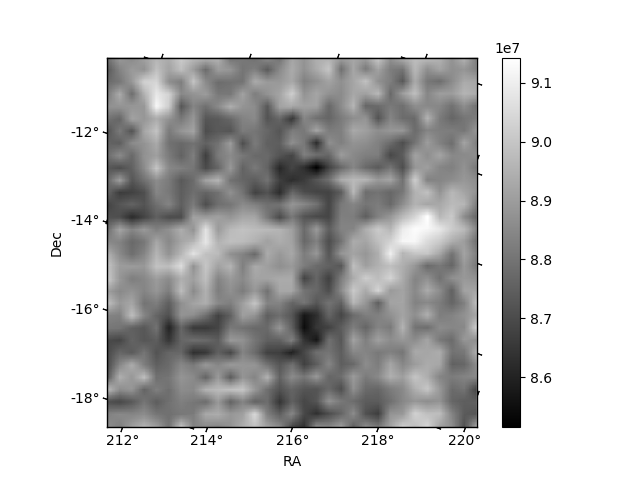
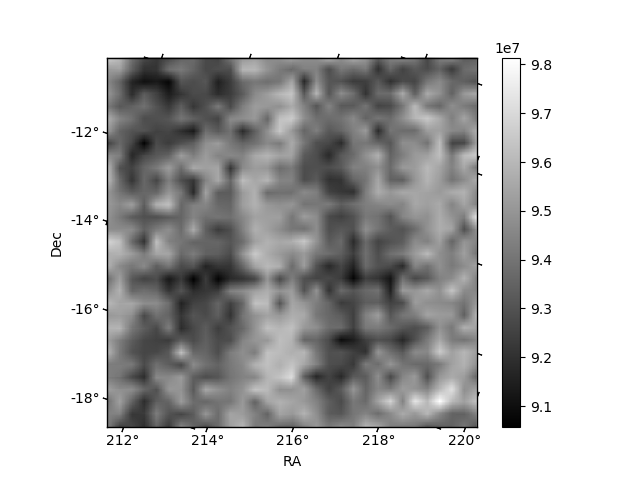
Histogram calculated using DETX and DETY for each event in the final _common_clean file
| Quadrant A | 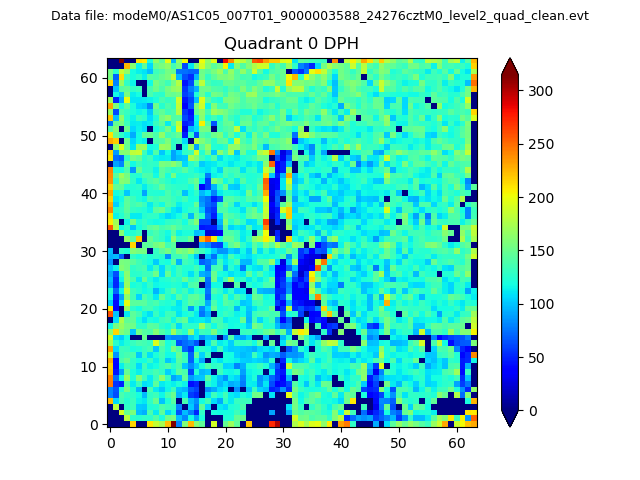 |
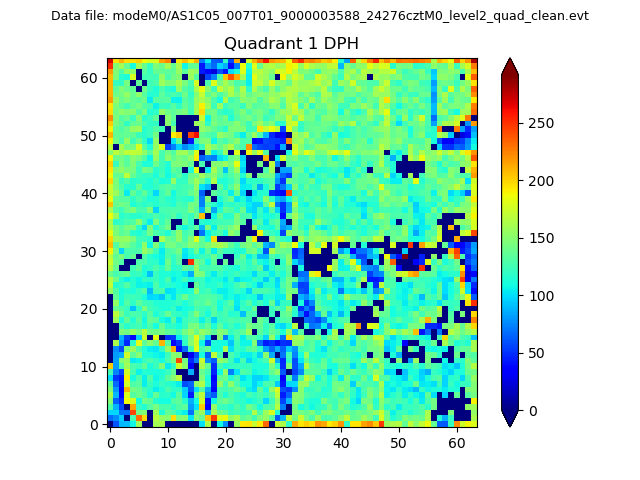 |
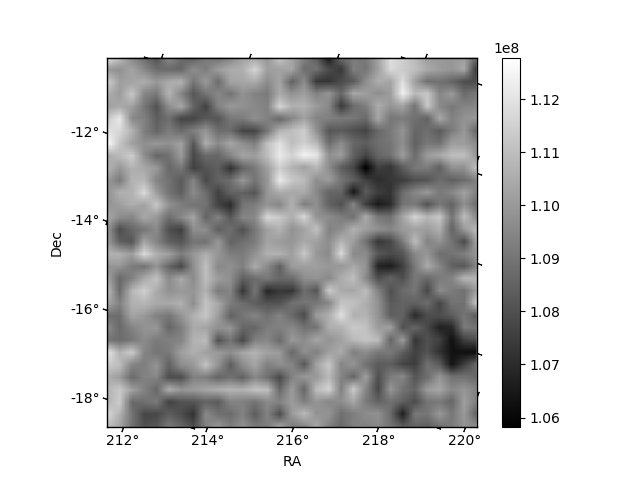
Quadrant B |
|---|---|---|---|
| Quadrant D | 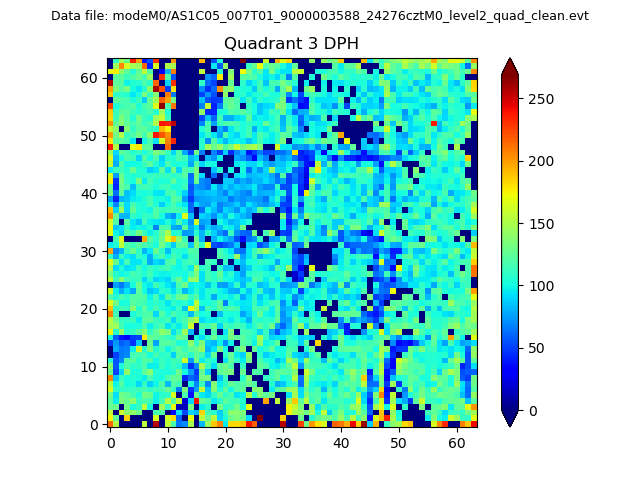 |
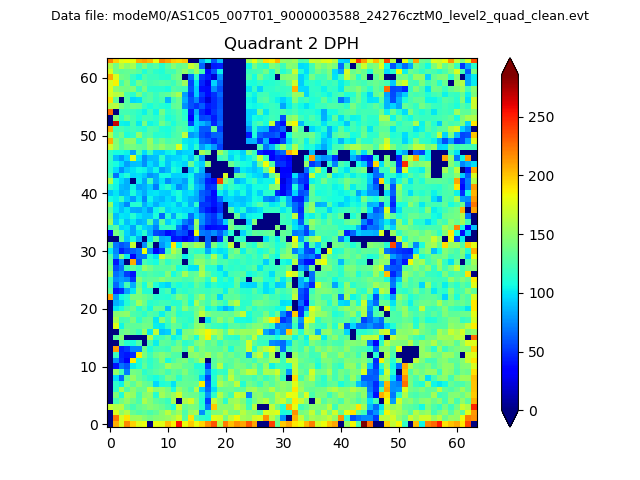 |
Quadrant C |
| Plot type | Count rate plots | Images |
|---|---|---|
| Comparison with Poisson distribution Blue bars denote a histogram of data divided into 1 sec bins. Red curve is a Poisson curve with rate = median count rate of data. |
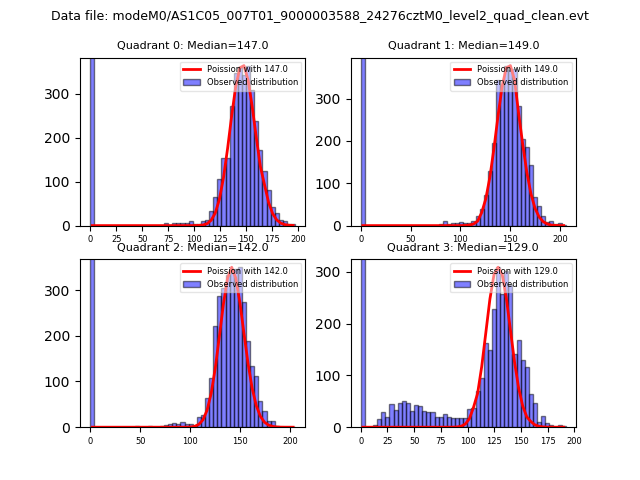 |
 |
| Quadrant-wise count rates Data is divided into 100 sec bins |
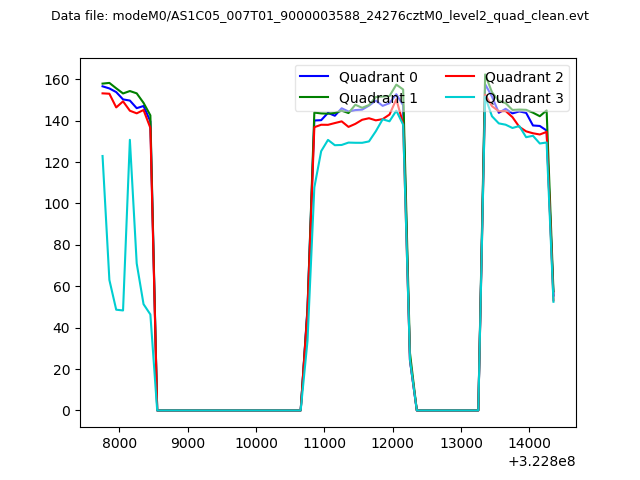 |
|
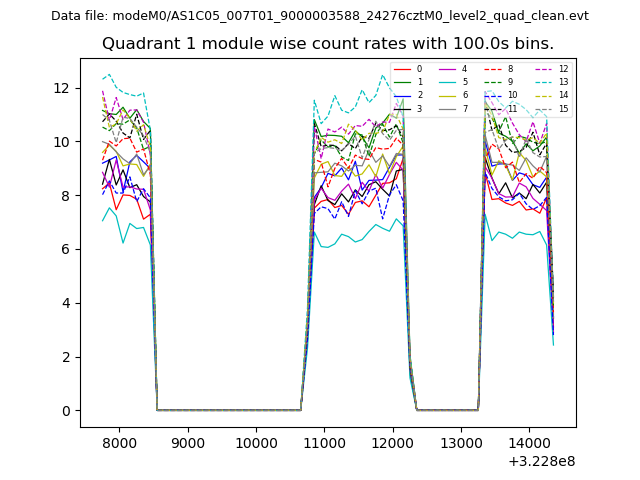
| Module-wise count rates for Quadrant A Data is divided into 100 sec bins |
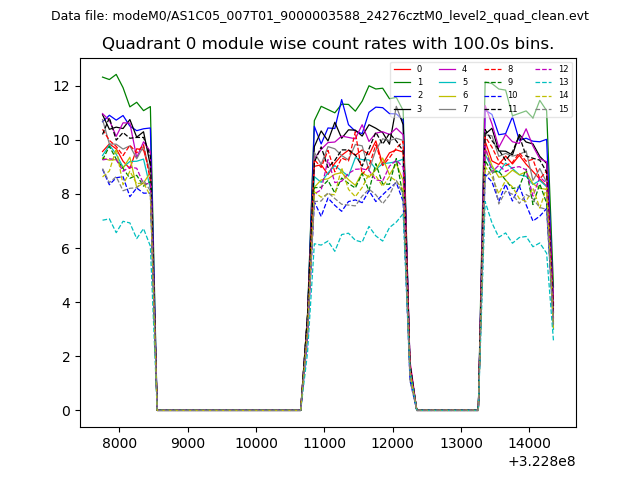 |
 |
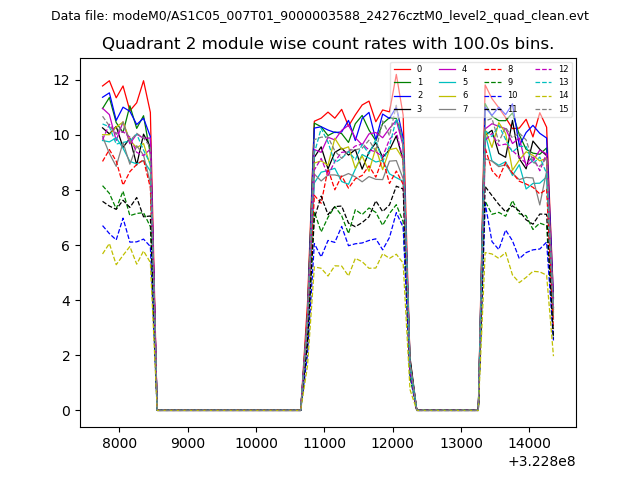
| Module-wise count rates for Quadrant B Data is divided into 100 sec bins |
 |
 |
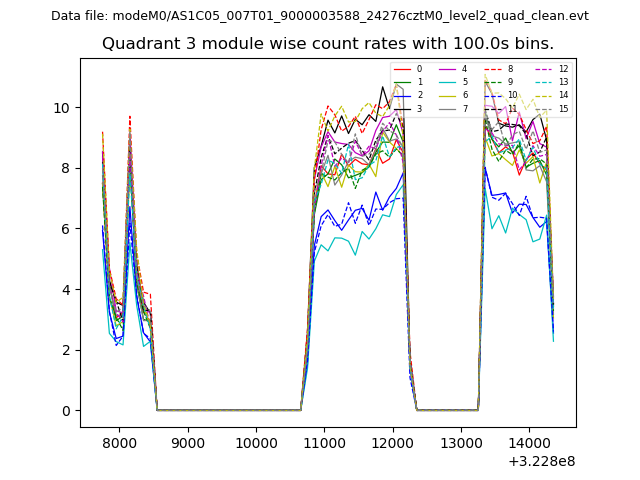
| Module-wise count rates for Quadrant C Data is divided into 100 sec bins |
 |
 |
| Module-wise count rates for Quadrant D Data is divided into 100 sec bins |
 |
 |
| Parameter | Plot |
|---|---|
| CZT HV Monitor | 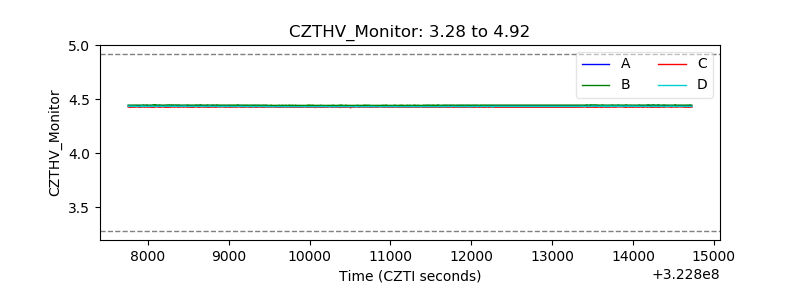 |
| D_VDD | 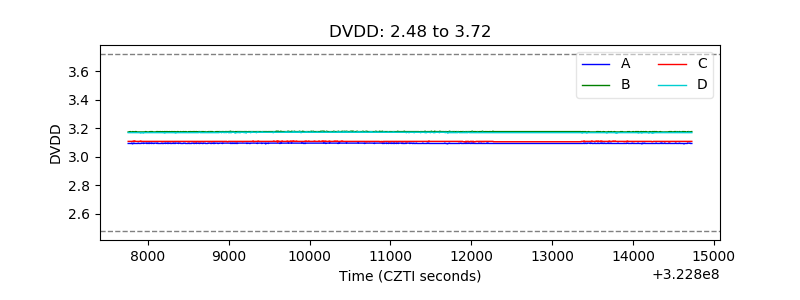 |
| Temperature 1 | 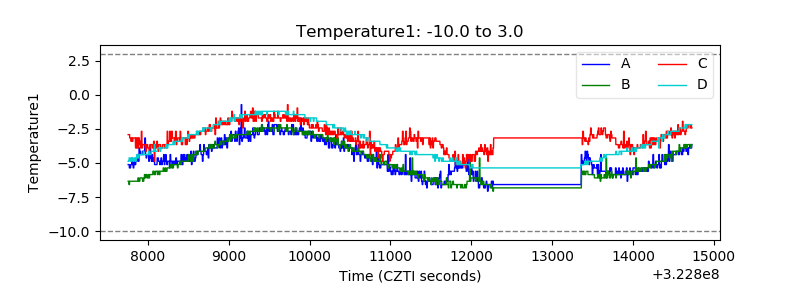 |
| Veto HV Monitor |  |
| Veto LLD | 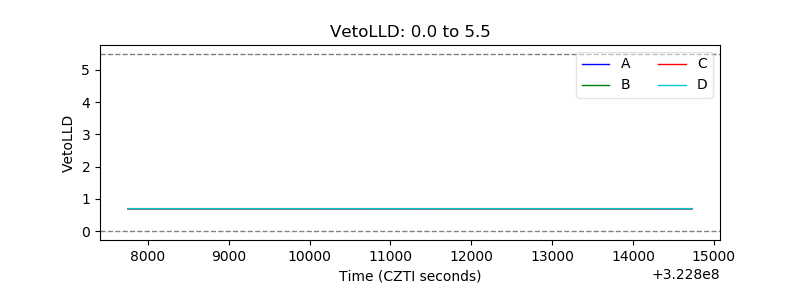 |
| Alpha Counter | 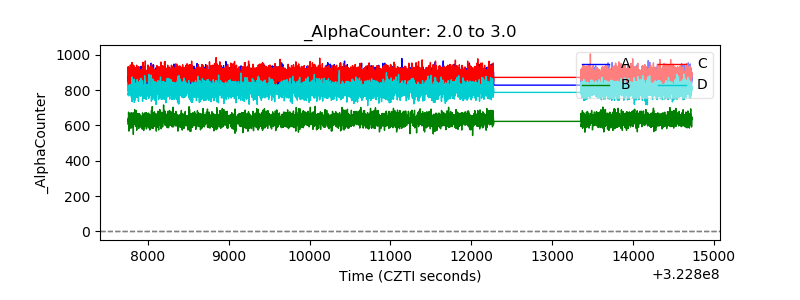 |
| _CPM_Rate | 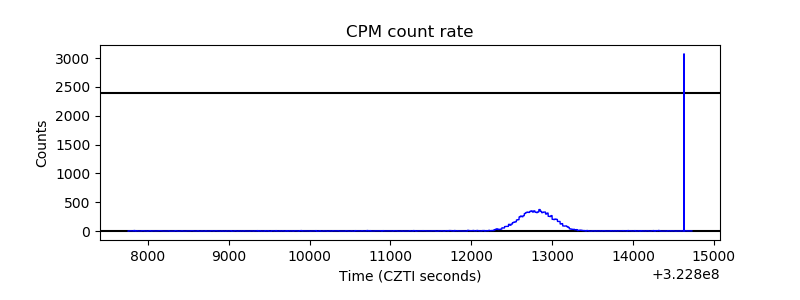 |
| CZT Counter | 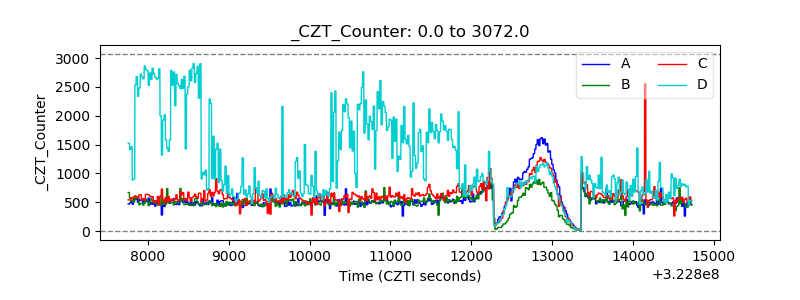 |
| +2.5 Volts monitor | 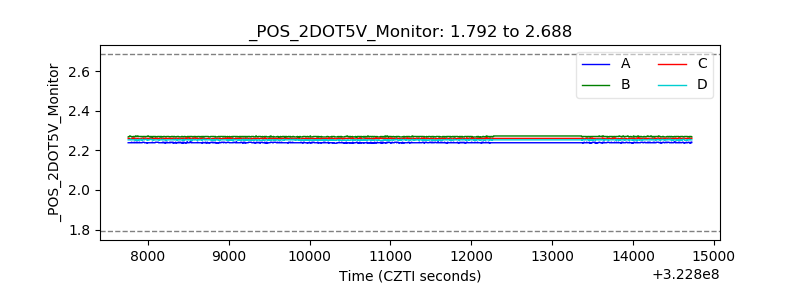 |
| +5 Volts monitor |  |
| _ROLL_ROT | 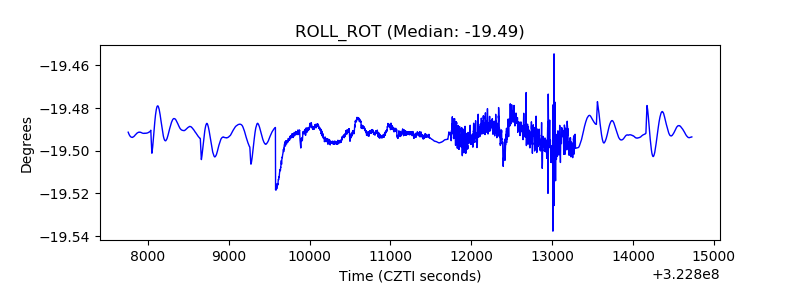 |
| _Roll_DEC | 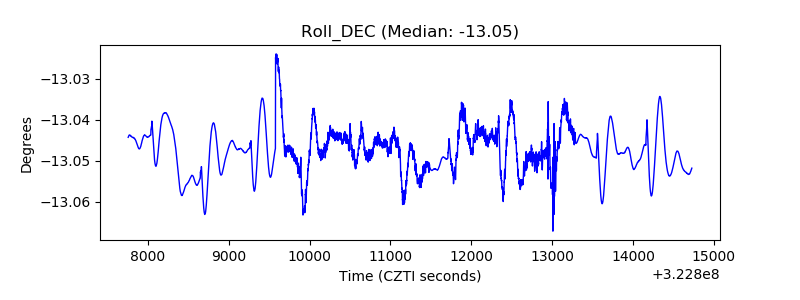 |
| _Roll_RA | 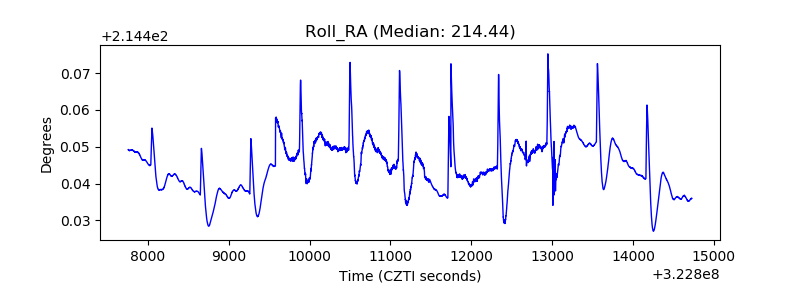 |
| Veto Counter | 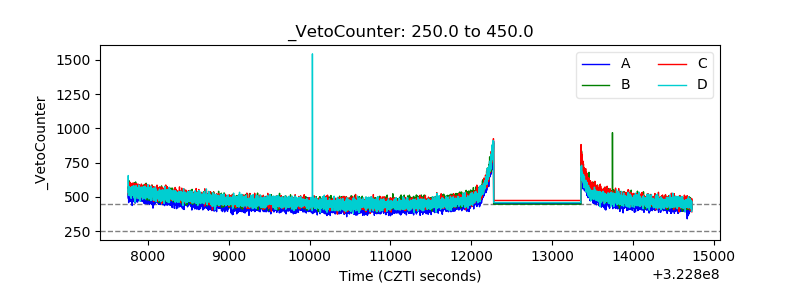 |