| Param | Original file | Final file |
|---|---|---|
| Filename | modeM0/AS1C05_007T01_9000003588_24277cztM0_level2.evt | modeM0/AS1C05_007T01_9000003588_24277cztM0_level2_quad_clean.evt |
| Size (bytes) | 597,113,280 | 86,535,360 |
| Size | 569.5 MB | 82.5 MB |
| Events in quadrant A | 3,454,364 | 543,571 |
| Events in quadrant B | 3,490,115 | 554,220 |
| Events in quadrant C | 4,984,027 | 522,046 |
| Events in quadrant D | 5,681,985 | 513,742 |
| Mode M0 | |||
|---|---|---|---|
| Quadrant | BADHDUFLAG | Total packets | Discarded packets |
| A | 0 | 14413 | 2 |
| B | 0 | 14505 | 3 |
| C | 0 | 19685 | 2 |
| D | 0 | 21705 | 2 |
| Mode M9 | |||
|---|---|---|---|
| Quadrant | BADHDUFLAG | Total packets | Discarded packets |
| A | 0 | 15 | 0 |
| B | 0 | 16 | 0 |
| C | 0 | 16 | 0 |
| D | 0 | 16 | 0 |
| Mode SS | |||
|---|---|---|---|
| Quadrant | BADHDUFLAG | Total packets | Discarded packets |
| A | 0 | 142 | 0 |
| B | 0 | 142 | 0 |
| C | 0 | 142 | 0 |
| D | 0 | 142 | 0 |
| Quadrant | Total seconds | Saturated seconds | Saturation percentage |
|---|---|---|---|
| A | 6988 | 114 | 1.631368% |
| B | 6987 | 126 | 1.803349% |
| C | 6987 | 331 | 4.737369% |
| D | 6987 | 282 | 4.036067% |
Noise dominated data is calculated using 1-second bins in cleaned event files. If a bin has >2000 counts, and if more than 50% of those come from <1% of pixels, then it is considered to be noise-dominated and hence unusable.
| Quadrant | # 1 sec bins | Bins with >0 counts | Bins with >2000 counts | High rate bins dominated by noise | Noise dominated (total time) | Noise dominated (detector-on time) | Marked lightcurve |
|---|---|---|---|---|---|---|---|
| A | 7673 | 6988 | 0 | 0 | 0.00% | 0.00% | 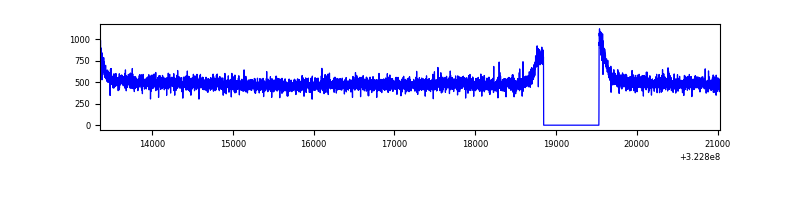 |
| B | 7672 | 6987 | 0 | 0 | 0.00% | 0.00% | 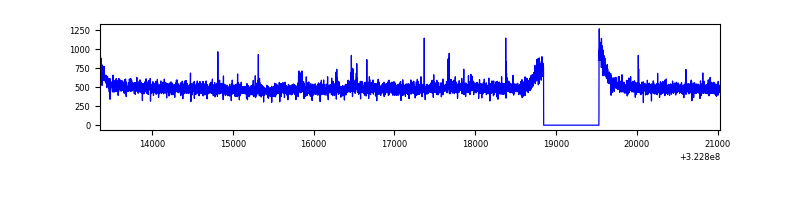 |
| C | 7672 | 6987 | 87 | 87 | 1.13% | 1.25% | 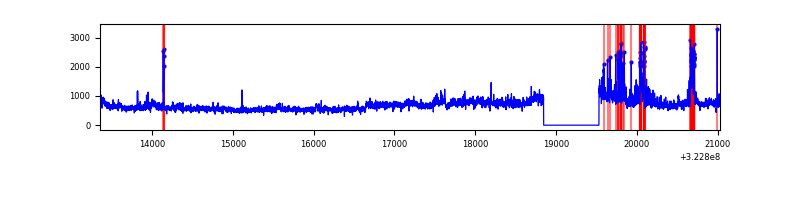 |
| D | 7672 | 6987 | 142 | 142 | 1.85% | 2.03% | 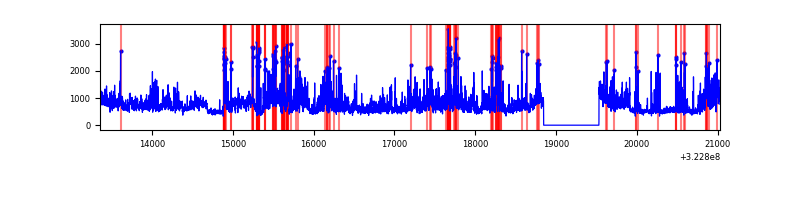 |
Top three noisy pixels from each quadrant. If the there are fewer than three noisy pixels in the level2.evt file, extra rows are filled as -1
| Pixel properties | Quadrant properties | ||||||
|---|---|---|---|---|---|---|---|
| Quadrant | DetID | PixID | Counts | Sigma | Mean | Median | Sigma |
| A | 13 | 254 | 9399 | 46.87 | 897 | 878 | 181.8 |
| A | 3 | 137 | 8029 | 39.33 | 897 | 878 | 181.8 |
| A | 0 | 226 | 7749 | 37.79 | 897 | 878 | 181.8 |
| B | 12 | 111 | 20770 | 117.31 | 884 | 862 | 169.7 |
| B | 11 | 111 | 18814 | 105.78 | 884 | 862 | 169.7 |
| B | 0 | 190 | 17166 | 96.07 | 884 | 862 | 169.7 |
| C | 7 | 247 | 1076374 | 5368.95 | 855 | 862 | 200.3 |
| C | 2 | 16 | 323032 | 1608.27 | 855 | 862 | 200.3 |
| C | 14 | 238 | 134326 | 666.25 | 855 | 862 | 200.3 |
| D | 1 | 52 | 1315797 | 6214.2 | 868 | 842 | 211.6 |
| D | 8 | 195 | 944182 | 4458.03 | 868 | 842 | 211.6 |
| D | 12 | 233 | 137519 | 645.91 | 868 | 842 | 211.6 |
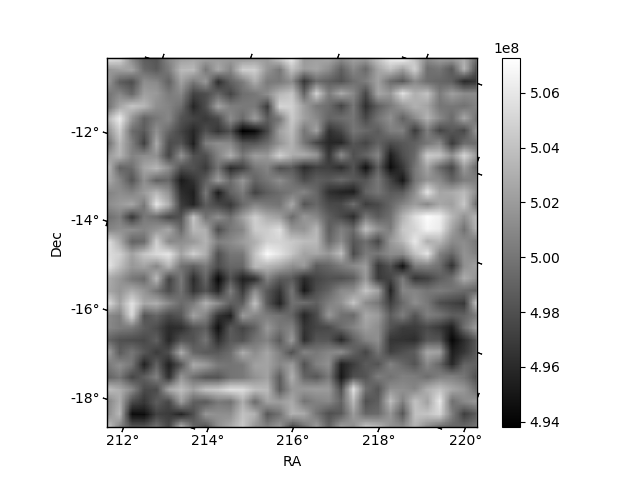
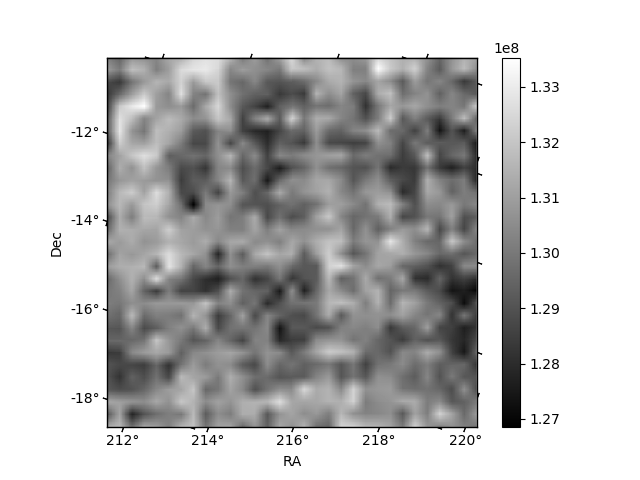
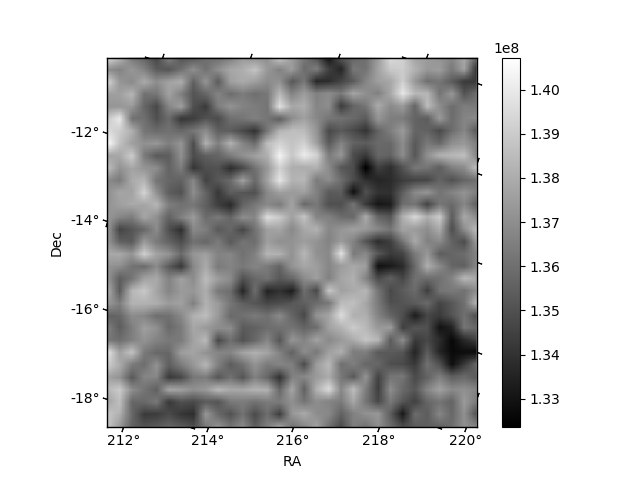
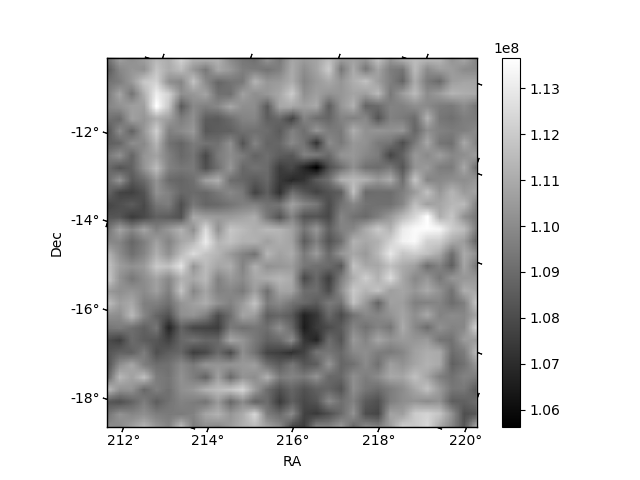
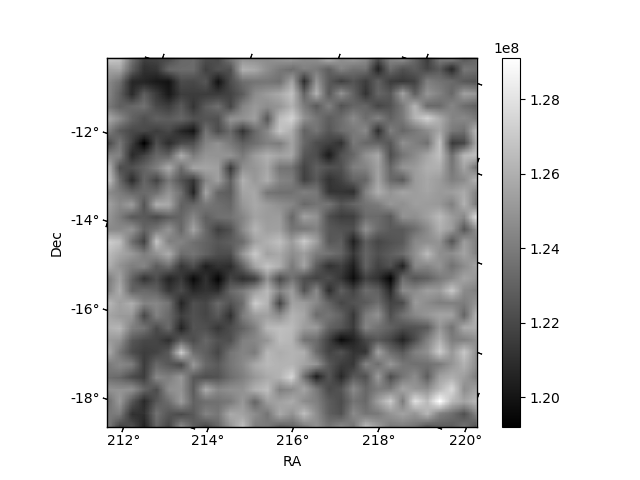
Histogram calculated using DETX and DETY for each event in the final _common_clean file
| Quadrant A | 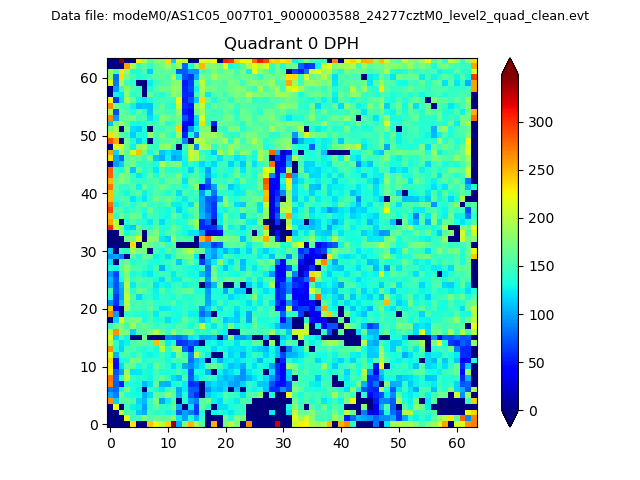 |
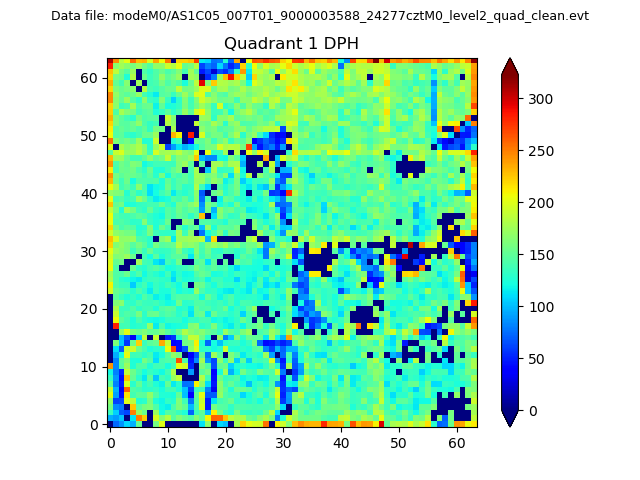 |
Quadrant B |
|---|---|---|---|
| Quadrant D | 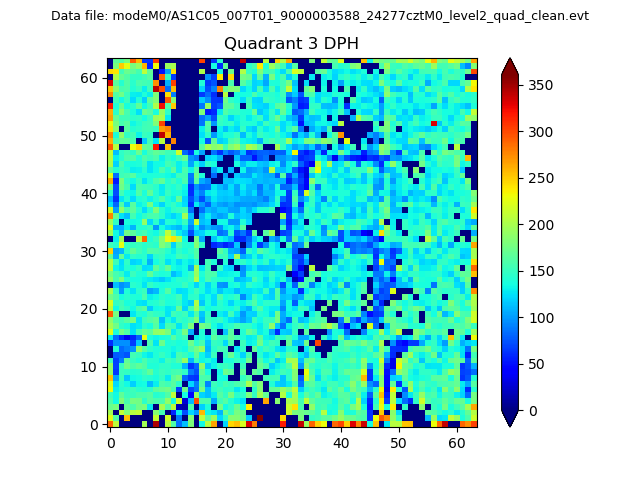 |
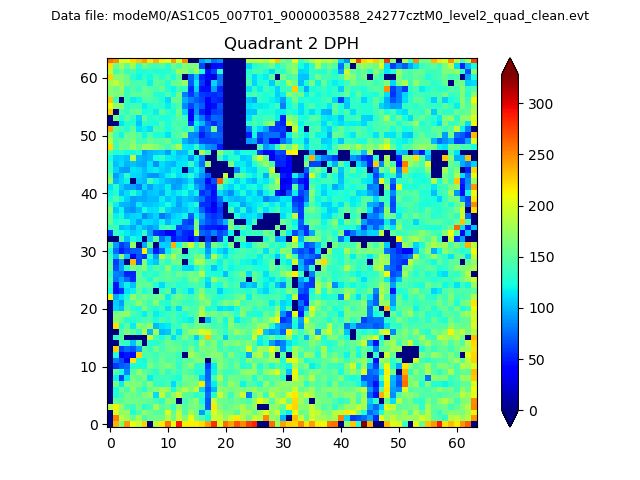 |
Quadrant C |
| Plot type | Count rate plots | Images |
|---|---|---|
| Comparison with Poisson distribution Blue bars denote a histogram of data divided into 1 sec bins. Red curve is a Poisson curve with rate = median count rate of data. |
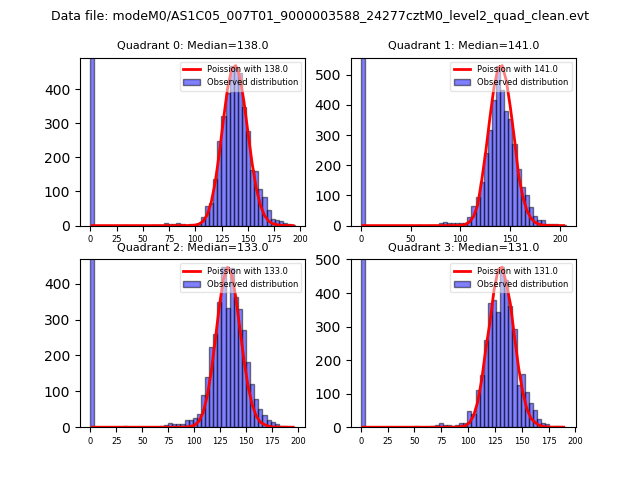 |
 |
| Quadrant-wise count rates Data is divided into 100 sec bins |
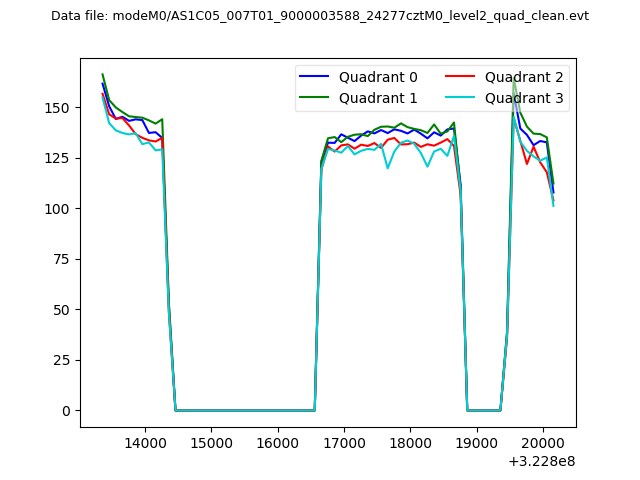 |
|
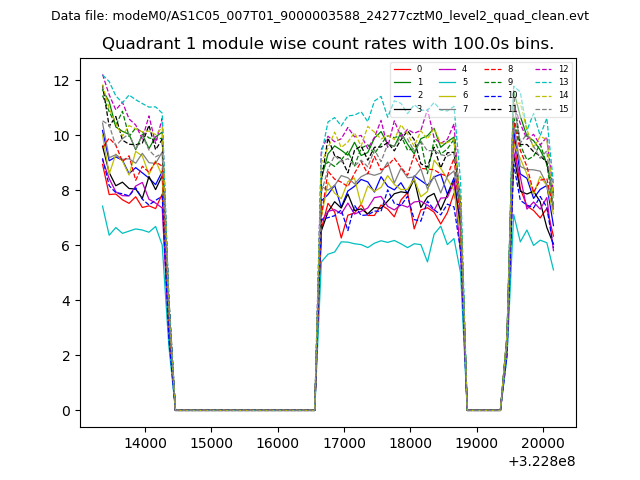
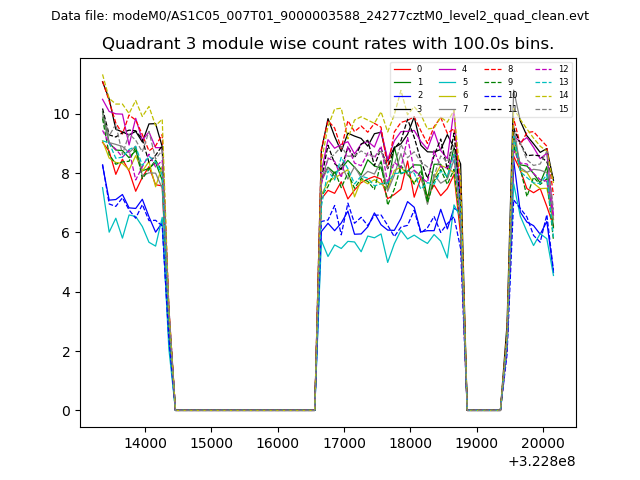
| Module-wise count rates for Quadrant A Data is divided into 100 sec bins |
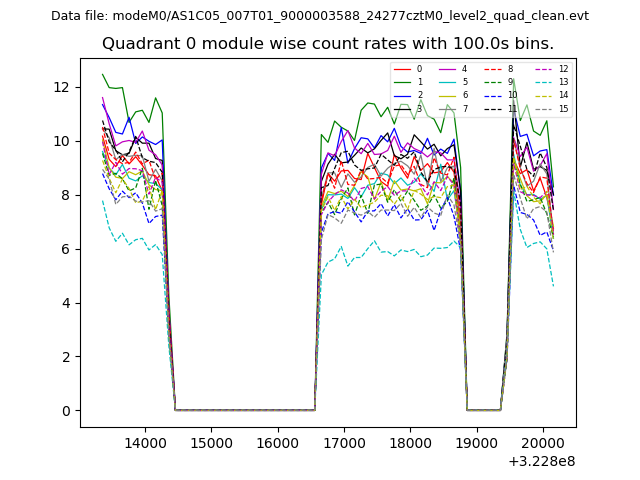 |
 |
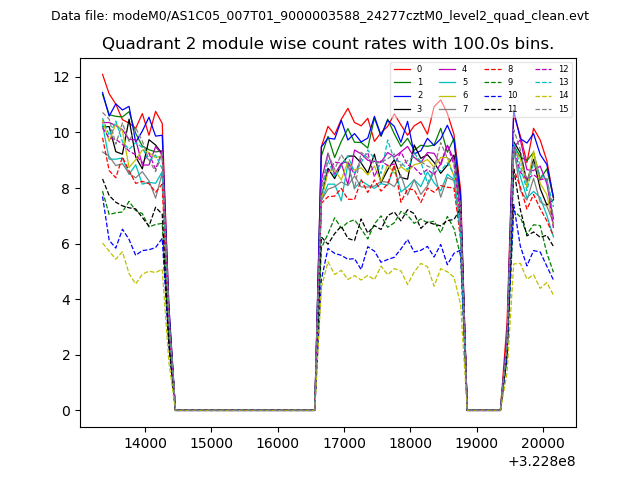
| Module-wise count rates for Quadrant B Data is divided into 100 sec bins |
 |
 |
| Module-wise count rates for Quadrant C Data is divided into 100 sec bins |
 |
 |
| Module-wise count rates for Quadrant D Data is divided into 100 sec bins |
 |
 |
| Parameter | Plot |
|---|---|
| CZT HV Monitor | 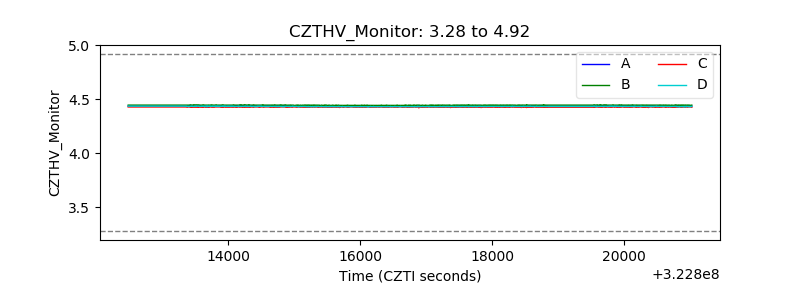 |
| D_VDD | 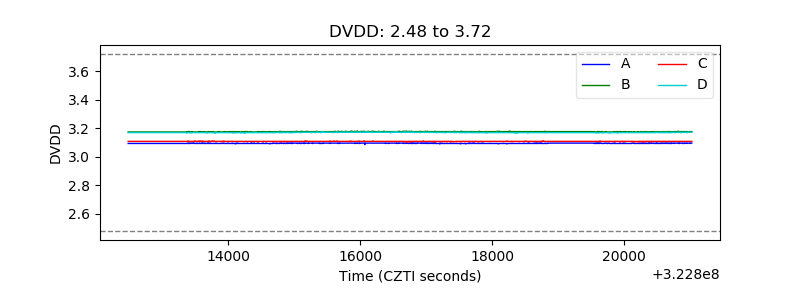 |
| Temperature 1 | 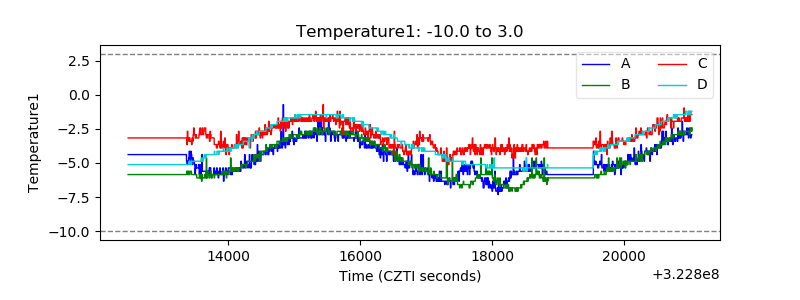 |
| Veto HV Monitor |  |
| Veto LLD | 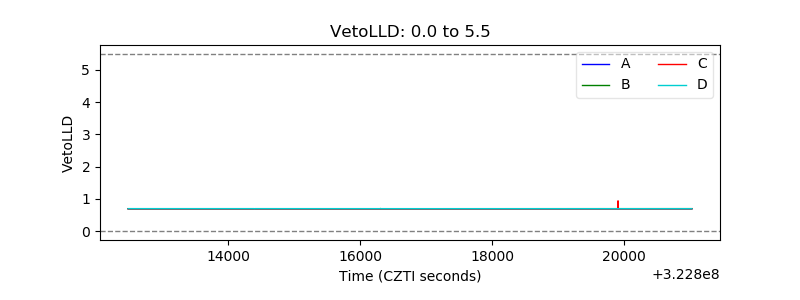 |
| Alpha Counter | 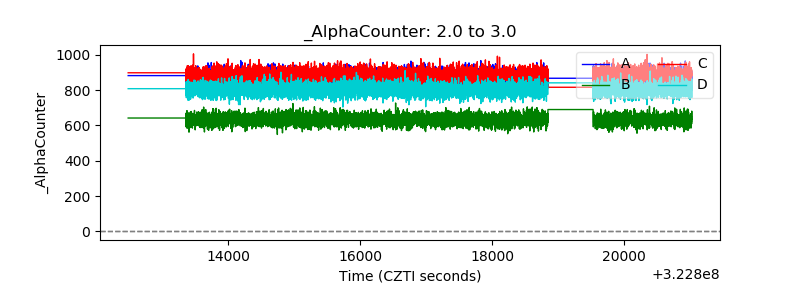 |
| _CPM_Rate | 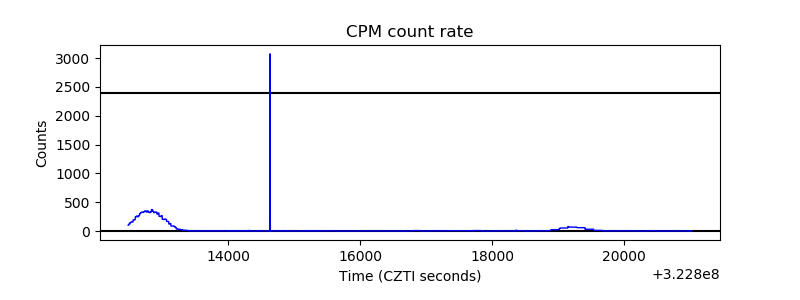 |
| CZT Counter | 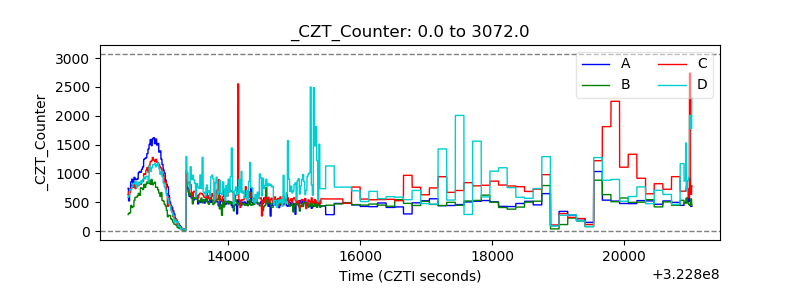 |
| +2.5 Volts monitor | 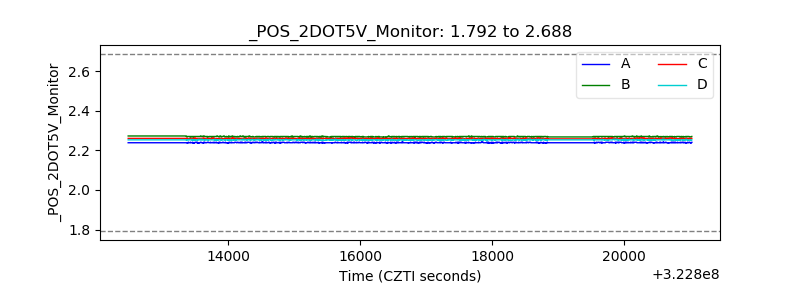 |
| +5 Volts monitor |  |
| _ROLL_ROT | 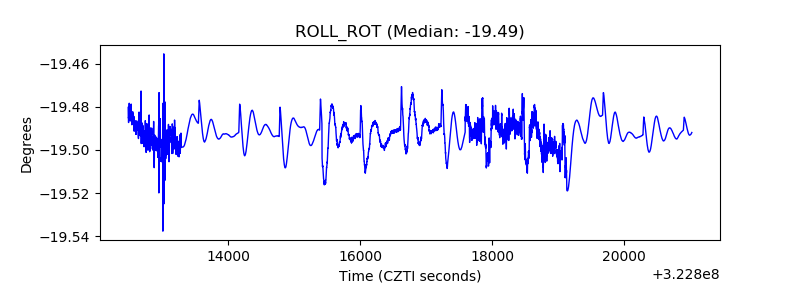 |
| _Roll_DEC | 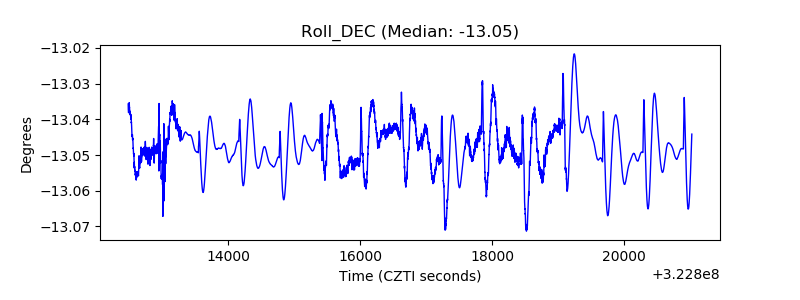 |
| _Roll_RA | 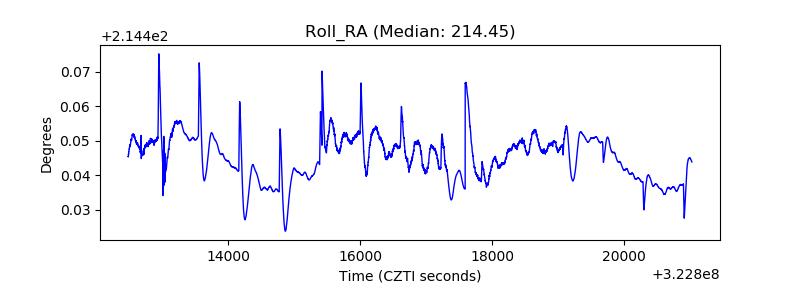 |
| Veto Counter | 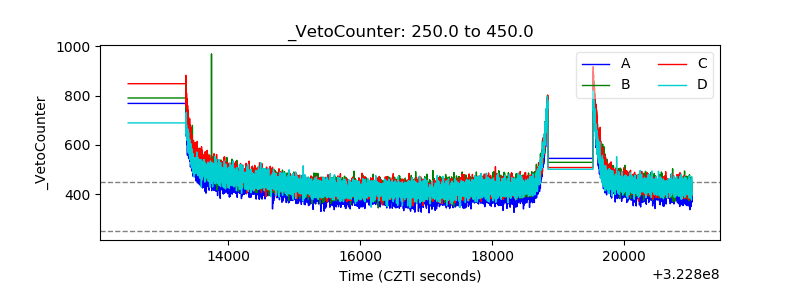 |