| Param | Original file | Final file |
|---|---|---|
| Filename | modeM0/AS1C05_007T01_9000003588_24278cztM0_level2.evt | modeM0/AS1C05_007T01_9000003588_24278cztM0_level2_quad_clean.evt |
| Size (bytes) | 715,504,320 | 87,609,600 |
| Size | 682.4 MB | 83.6 MB |
| Events in quadrant A | 3,864,763 | 539,513 |
| Events in quadrant B | 3,913,287 | 550,331 |
| Events in quadrant C | 7,088,418 | 510,022 |
| Events in quadrant D | 6,273,883 | 508,627 |
| Mode M0 | |||
|---|---|---|---|
| Quadrant | BADHDUFLAG | Total packets | Discarded packets |
| A | 0 | 16423 | 2 |
| B | 0 | 16439 | 2 |
| C | 0 | 26902 | 2 |
| D | 0 | 23836 | 2 |
| Mode M9 | |||
|---|---|---|---|
| Quadrant | BADHDUFLAG | Total packets | Discarded packets |
| A | 0 | 3 | 0 |
| B | 0 | 4 | 0 |
| C | 0 | 4 | 0 |
| D | 0 | 4 | 0 |
| Mode SS | |||
|---|---|---|---|
| Quadrant | BADHDUFLAG | Total packets | Discarded packets |
| A | 0 | 158 | 0 |
| B | 0 | 158 | 0 |
| C | 0 | 158 | 0 |
| D | 0 | 158 | 0 |
| Quadrant | Total seconds | Saturated seconds | Saturation percentage |
|---|---|---|---|
| A | 7825 | 203 | 2.594249% |
| B | 7825 | 218 | 2.785942% |
| C | 7825 | 636 | 8.127796% |
| D | 7825 | 524 | 6.696486% |
Noise dominated data is calculated using 1-second bins in cleaned event files. If a bin has >2000 counts, and if more than 50% of those come from <1% of pixels, then it is considered to be noise-dominated and hence unusable.
| Quadrant | # 1 sec bins | Bins with >0 counts | Bins with >2000 counts | High rate bins dominated by noise | Noise dominated (total time) | Noise dominated (detector-on time) | Marked lightcurve |
|---|---|---|---|---|---|---|---|
| A | 8065 | 7825 | 0 | 0 | 0.00% | 0.00% | 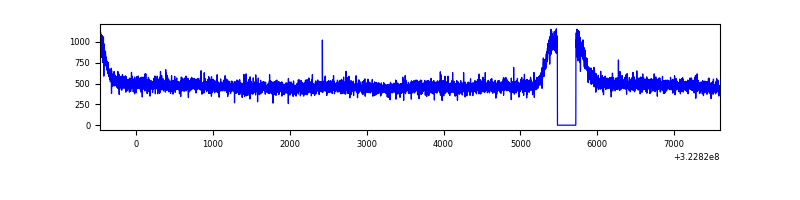 |
| B | 8065 | 7825 | 0 | 0 | 0.00% | 0.00% | 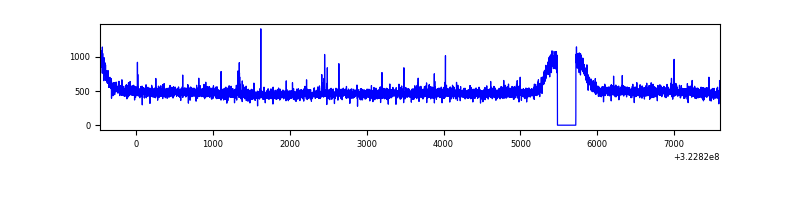 |
| C | 8065 | 7825 | 199 | 199 | 2.47% | 2.54% | 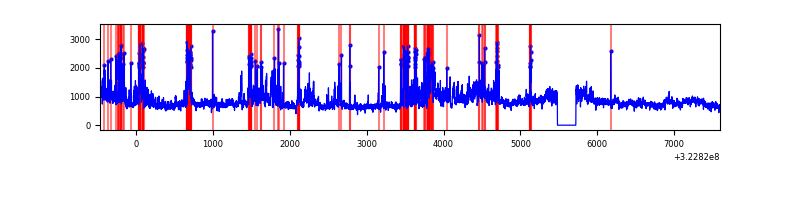 |
| D | 8065 | 7825 | 308 | 308 | 3.82% | 3.94% | 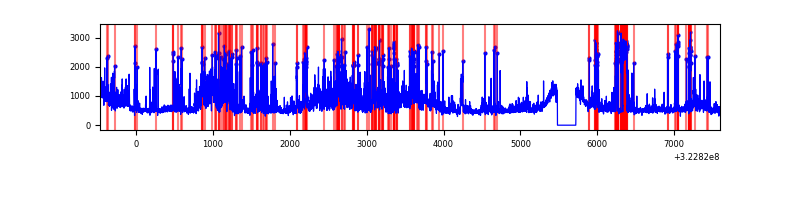 |
Top three noisy pixels from each quadrant. If the there are fewer than three noisy pixels in the level2.evt file, extra rows are filled as -1
| Pixel properties | Quadrant properties | ||||||
|---|---|---|---|---|---|---|---|
| Quadrant | DetID | PixID | Counts | Sigma | Mean | Median | Sigma |
| A | 13 | 254 | 11305 | 50.92 | 1003 | 981 | 202.7 |
| A | 3 | 137 | 9248 | 40.78 | 1003 | 981 | 202.7 |
| A | 0 | 226 | 8730 | 38.22 | 1003 | 981 | 202.7 |
| B | 12 | 111 | 24099 | 118.61 | 993 | 966 | 195.0 |
| B | 11 | 111 | 21590 | 105.75 | 993 | 966 | 195.0 |
| B | 14 | 111 | 19392 | 94.48 | 993 | 966 | 195.0 |
| C | 7 | 247 | 1880175 | 8355.91 | 949 | 956 | 224.9 |
| C | 2 | 16 | 1243641 | 5525.58 | 949 | 956 | 224.9 |
| C | 14 | 238 | 145673 | 643.48 | 949 | 956 | 224.9 |
| D | 1 | 52 | 1452953 | 6116.01 | 965 | 938 | 237.4 |
| D | 8 | 195 | 1062331 | 4470.68 | 965 | 938 | 237.4 |
| D | 12 | 233 | 62265 | 258.31 | 965 | 938 | 237.4 |
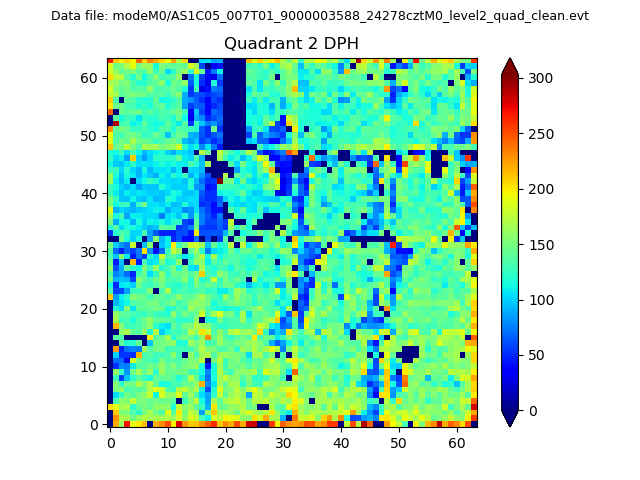
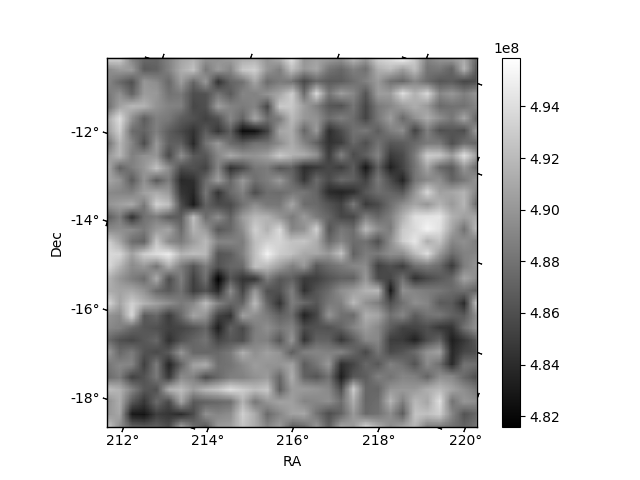
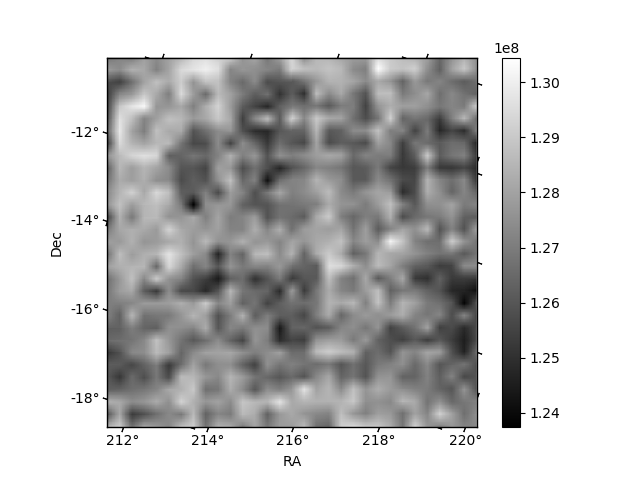
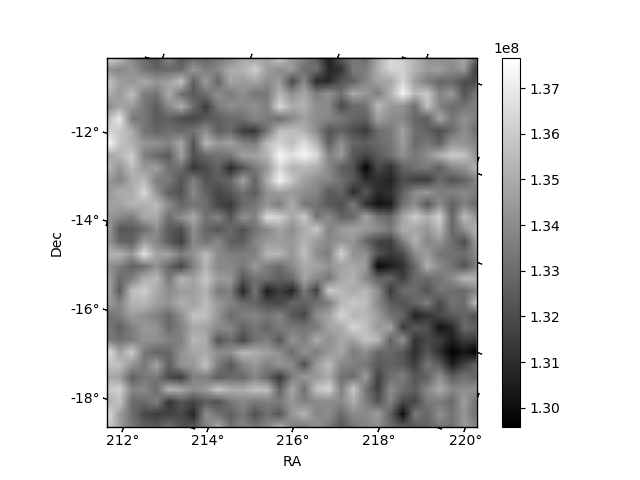
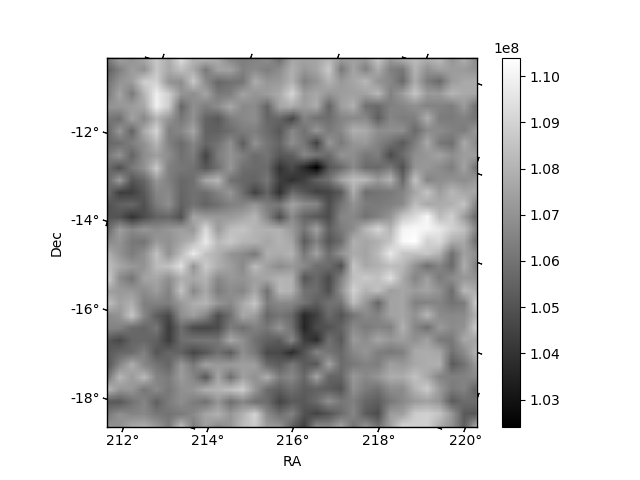
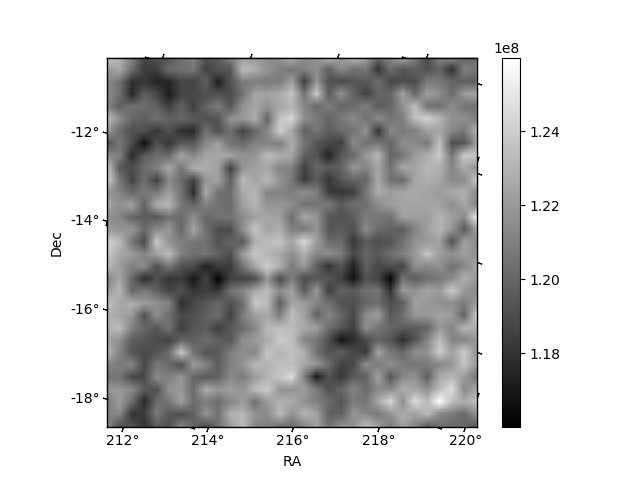
Histogram calculated using DETX and DETY for each event in the final _common_clean file
| Quadrant A | 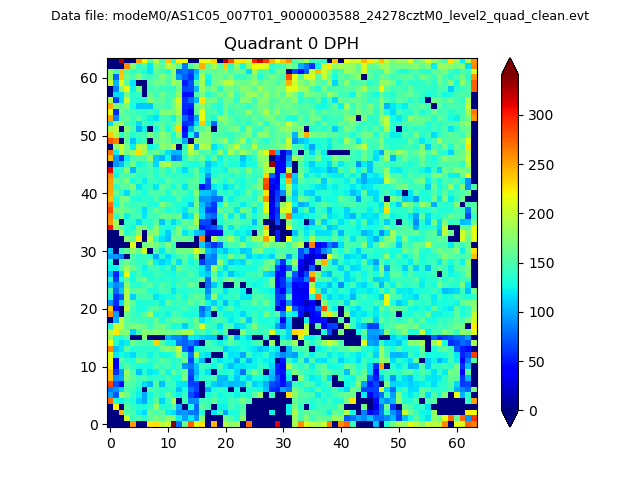 |
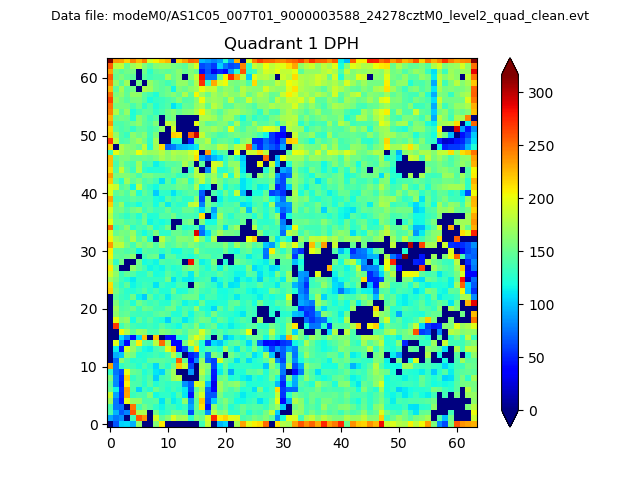 |
Quadrant B |
|---|---|---|---|
| Quadrant D | 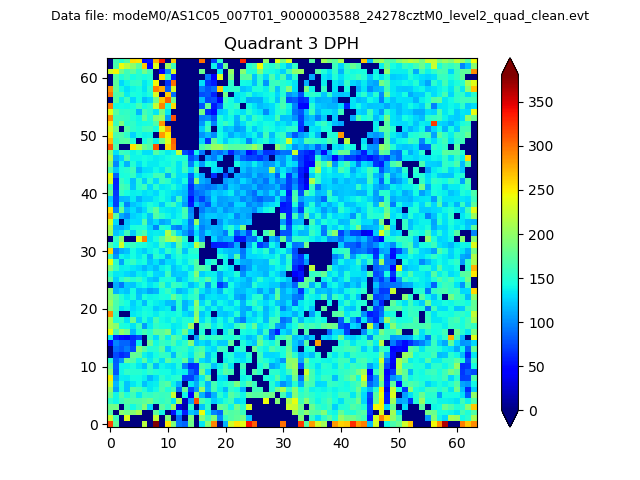 |
 |
Quadrant C |
| Plot type | Count rate plots | Images |
|---|---|---|
| Comparison with Poisson distribution Blue bars denote a histogram of data divided into 1 sec bins. Red curve is a Poisson curve with rate = median count rate of data. |
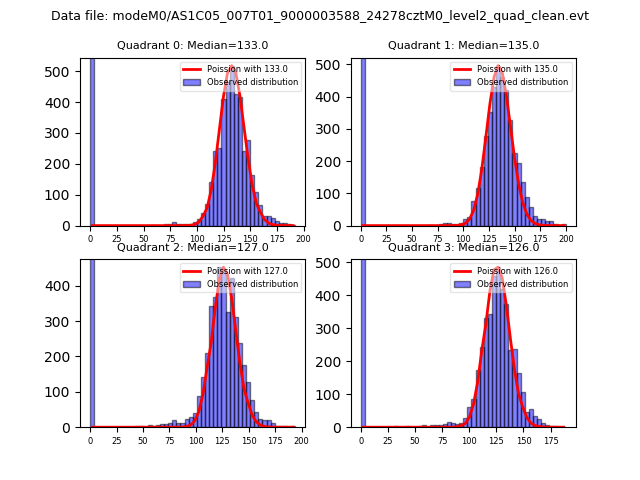 |
 |
| Quadrant-wise count rates Data is divided into 100 sec bins |
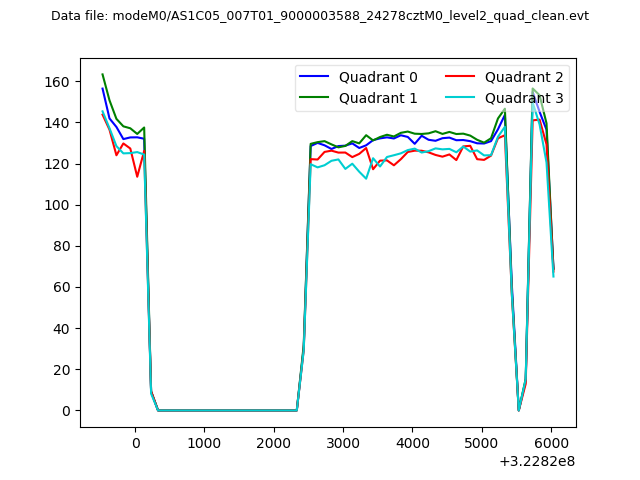 |
|
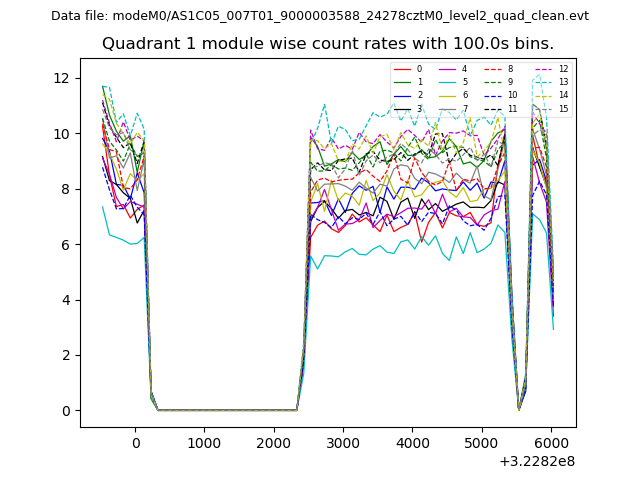
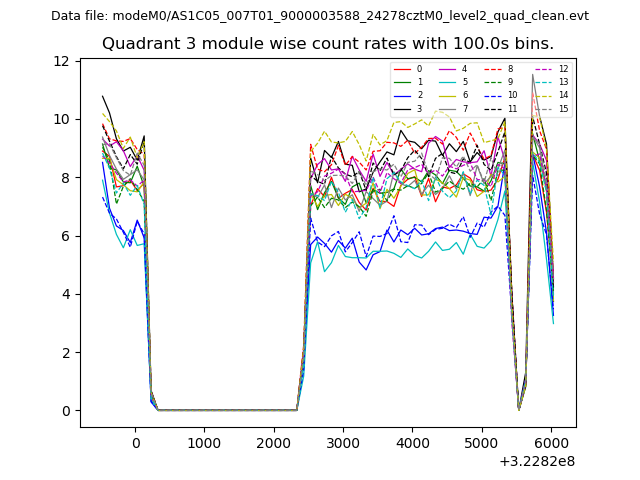
| Module-wise count rates for Quadrant A Data is divided into 100 sec bins |
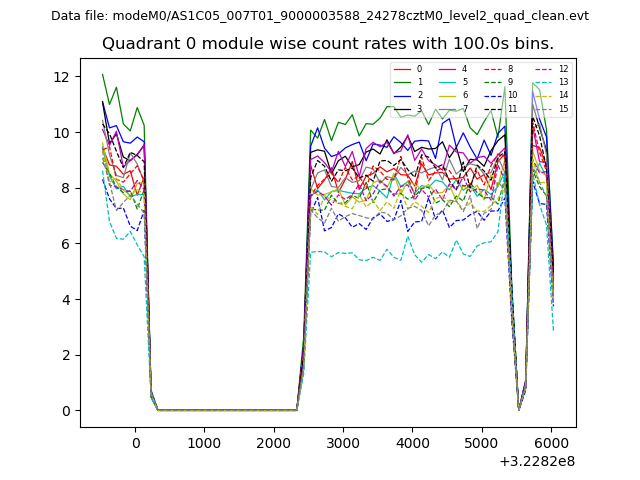 |
 |
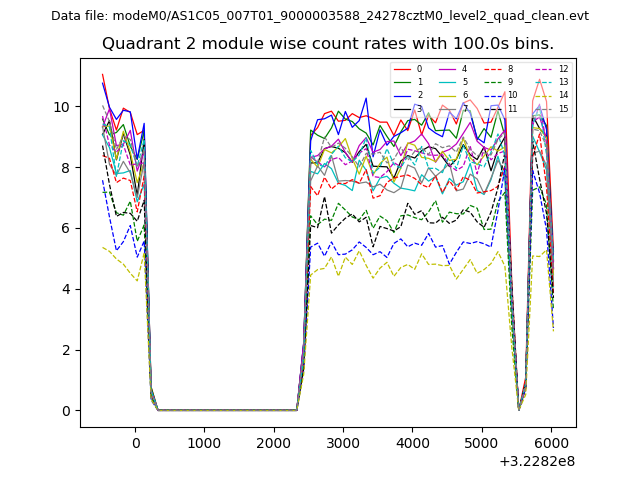
| Module-wise count rates for Quadrant B Data is divided into 100 sec bins |
 |
 |
| Module-wise count rates for Quadrant C Data is divided into 100 sec bins |
 |
 |
| Module-wise count rates for Quadrant D Data is divided into 100 sec bins |
 |
 |
| Parameter | Plot |
|---|---|
| CZT HV Monitor | 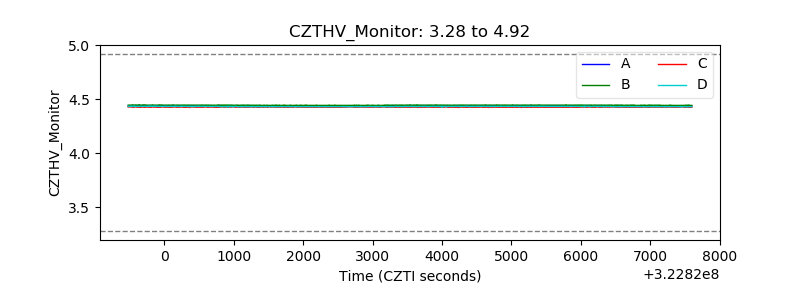 |
| D_VDD | 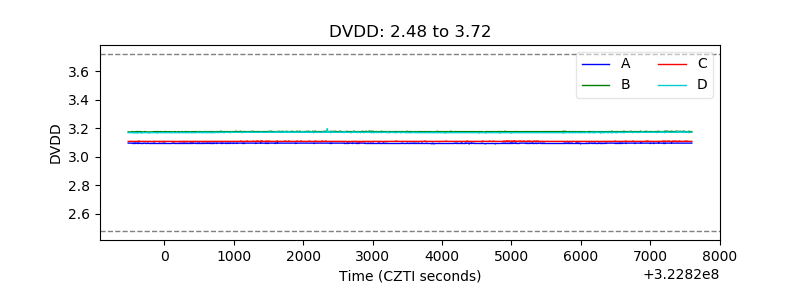 |
| Temperature 1 | 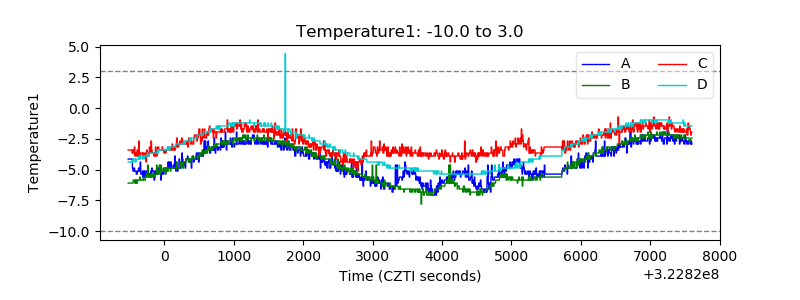 |
| Veto HV Monitor |  |
| Veto LLD | 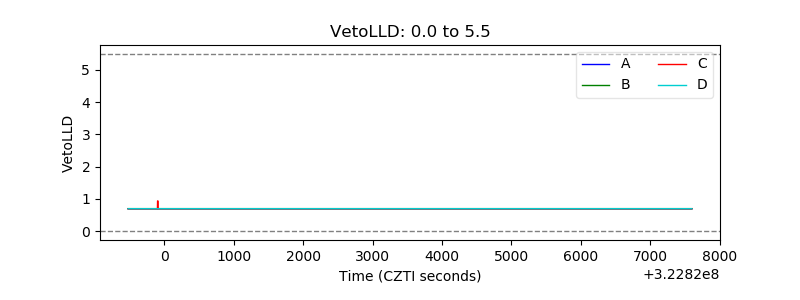 |
| Alpha Counter | 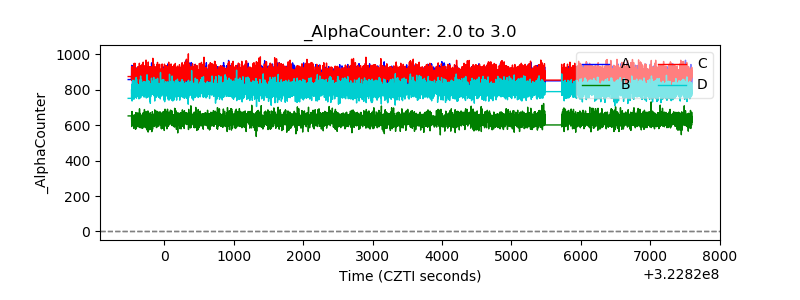 |
| _CPM_Rate | 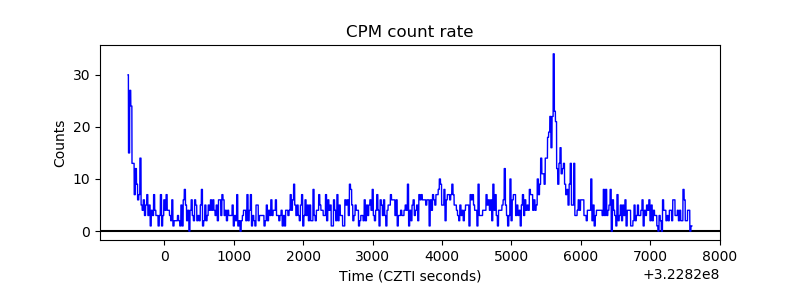 |
| CZT Counter | 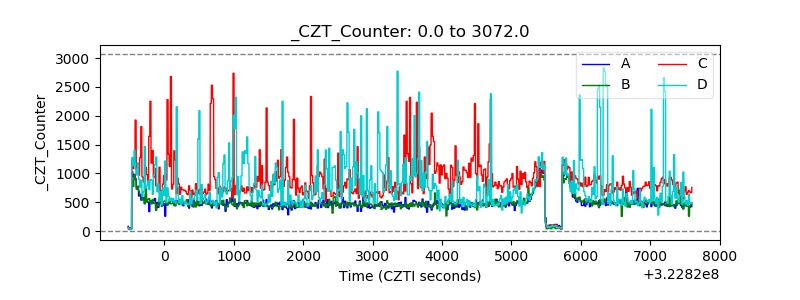 |
| +2.5 Volts monitor |  |
| +5 Volts monitor |  |
| _ROLL_ROT | 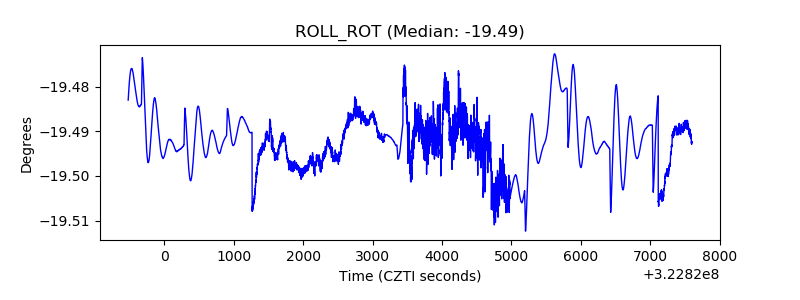 |
| _Roll_DEC | 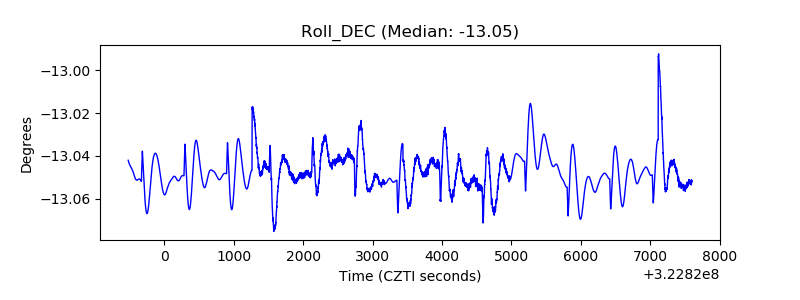 |
| _Roll_RA | 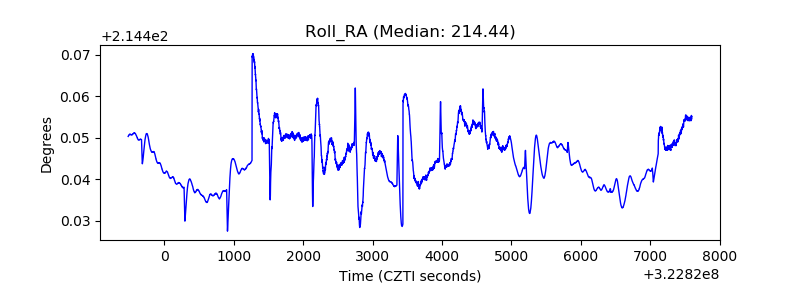 |
| Veto Counter | 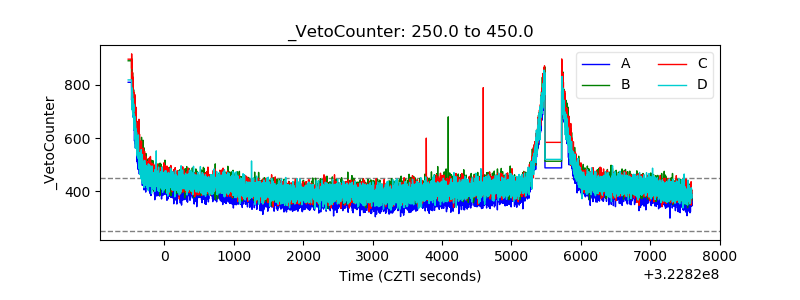 |