| Param | Original file | Final file |
|---|---|---|
| Filename | modeM0/AS1C05_007T01_9000003588_24279cztM0_level2.evt | modeM0/AS1C05_007T01_9000003588_24279cztM0_level2_quad_clean.evt |
| Size (bytes) | 685,117,440 | 81,702,720 |
| Size | 653.4 MB | 77.9 MB |
| Events in quadrant A | 3,700,734 | 497,787 |
| Events in quadrant B | 3,731,120 | 504,918 |
| Events in quadrant C | 6,627,022 | 477,067 |
| Events in quadrant D | 6,179,327 | 468,826 |
| Mode M0 | |||
|---|---|---|---|
| Quadrant | BADHDUFLAG | Total packets | Discarded packets |
| A | 0 | 15797 | 7 |
| B | 0 | 15757 | 2 |
| C | 0 | 25270 | 2 |
| D | 0 | 23500 | 2 |
| Mode M9 | |||
|---|---|---|---|
| Quadrant | BADHDUFLAG | Total packets | Discarded packets |
| A | 0 | 3 | 0 |
| B | 0 | 4 | 0 |
| C | 0 | 4 | 0 |
| D | 0 | 4 | 0 |
| Mode SS | |||
|---|---|---|---|
| Quadrant | BADHDUFLAG | Total packets | Discarded packets |
| A | 0 | 154 | 0 |
| B | 0 | 154 | 0 |
| C | 0 | 154 | 0 |
| D | 0 | 154 | 0 |
| Quadrant | Total seconds | Saturated seconds | Saturation percentage |
|---|---|---|---|
| A | 7547 | 128 | 1.696038% |
| B | 7547 | 168 | 2.226050% |
| C | 7547 | 664 | 8.798198% |
| D | 7547 | 461 | 6.108387% |
Noise dominated data is calculated using 1-second bins in cleaned event files. If a bin has >2000 counts, and if more than 50% of those come from <1% of pixels, then it is considered to be noise-dominated and hence unusable.
| Quadrant | # 1 sec bins | Bins with >0 counts | Bins with >2000 counts | High rate bins dominated by noise | Noise dominated (total time) | Noise dominated (detector-on time) | Marked lightcurve |
|---|---|---|---|---|---|---|---|
| A | 7801 | 7547 | 1 | 1 | 0.01% | 0.01% | 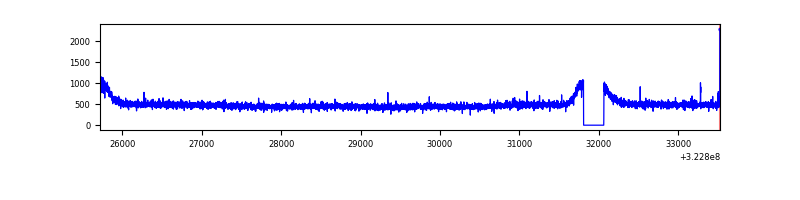 |
| B | 7802 | 7547 | 0 | 0 | 0.00% | 0.00% | 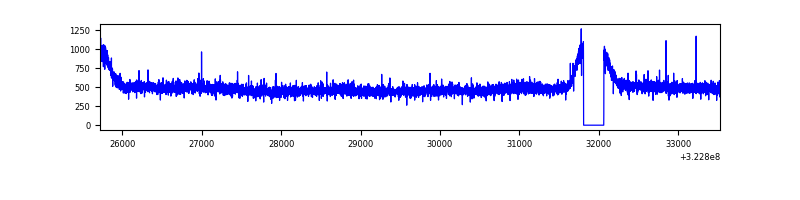 |
| C | 7802 | 7547 | 323 | 323 | 4.14% | 4.28% | 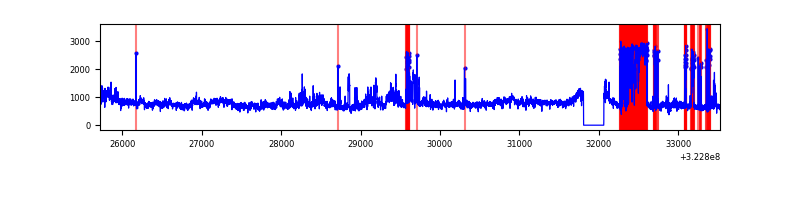 |
| D | 7802 | 7547 | 300 | 300 | 3.85% | 3.98% | 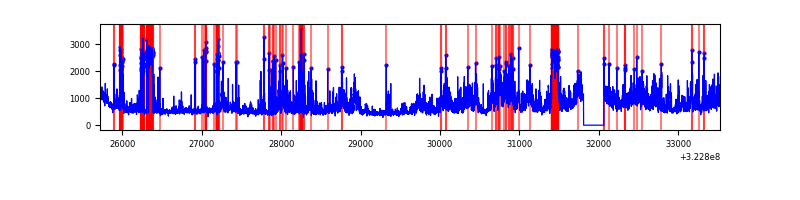 |
Top three noisy pixels from each quadrant. If the there are fewer than three noisy pixels in the level2.evt file, extra rows are filled as -1
| Pixel properties | Quadrant properties | ||||||
|---|---|---|---|---|---|---|---|
| Quadrant | DetID | PixID | Counts | Sigma | Mean | Median | Sigma |
| A | 13 | 254 | 10838 | 50.91 | 957 | 936 | 194.5 |
| A | 6 | 16 | 8955 | 41.23 | 957 | 936 | 194.5 |
| A | 3 | 137 | 8748 | 40.17 | 957 | 936 | 194.5 |
| B | 12 | 111 | 22798 | 117.97 | 949 | 925 | 185.4 |
| B | 11 | 111 | 20525 | 105.72 | 949 | 925 | 185.4 |
| B | 14 | 111 | 18452 | 94.53 | 949 | 925 | 185.4 |
| C | 7 | 247 | 1837438 | 8705.58 | 890 | 897 | 211.0 |
| C | 2 | 16 | 1178045 | 5579.93 | 890 | 897 | 211.0 |
| C | 14 | 238 | 138209 | 650.89 | 890 | 897 | 211.0 |
| D | 8 | 195 | 1608930 | 7062.22 | 919 | 893 | 227.7 |
| D | 1 | 52 | 768666 | 3371.92 | 919 | 893 | 227.7 |
| D | 1 | 239 | 177129 | 774.0 | 919 | 893 | 227.7 |
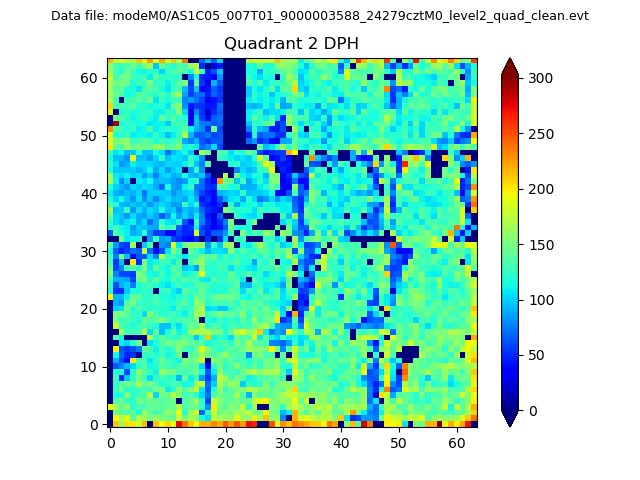
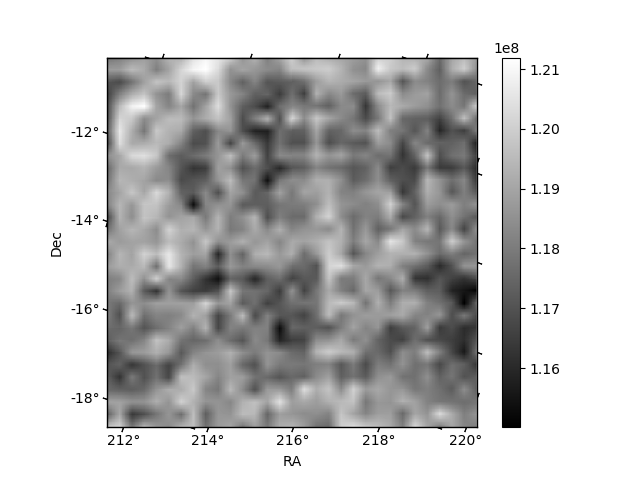
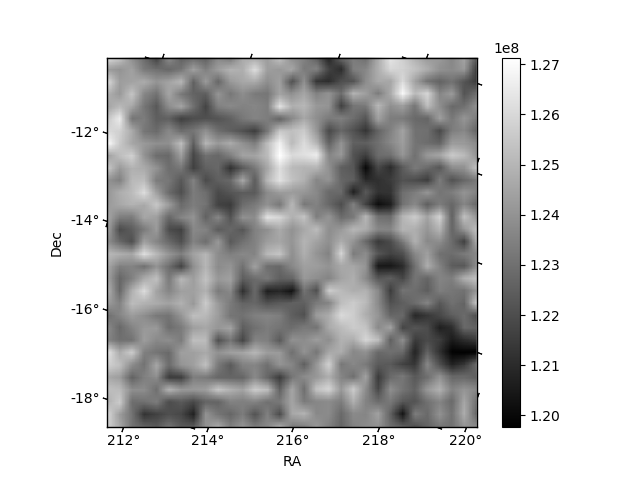
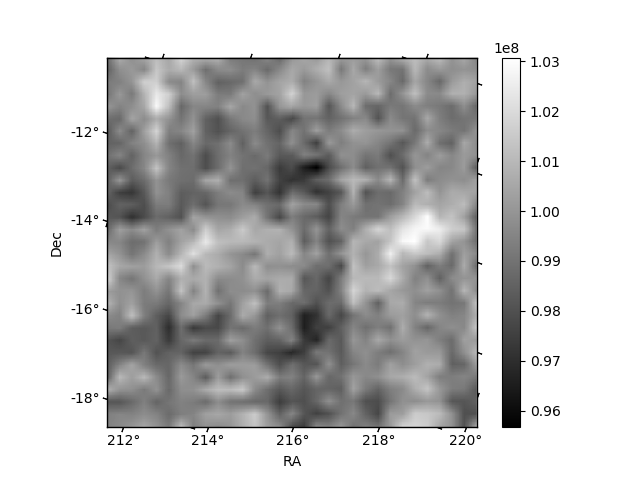
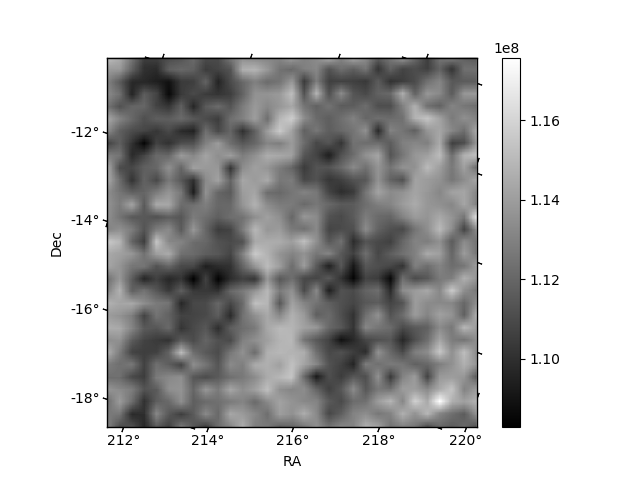
Histogram calculated using DETX and DETY for each event in the final _common_clean file
| Quadrant A | 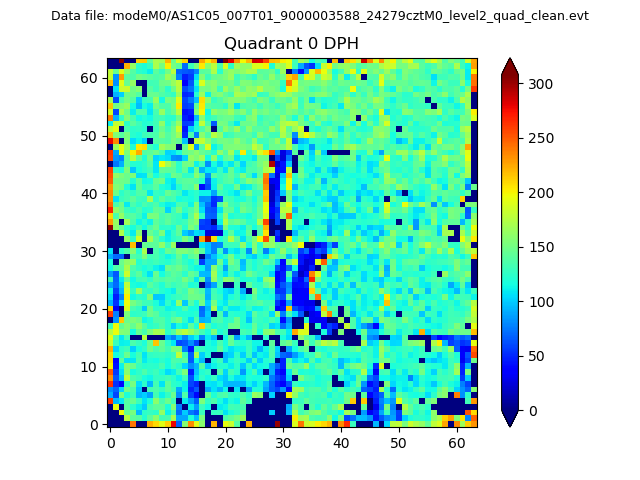 |
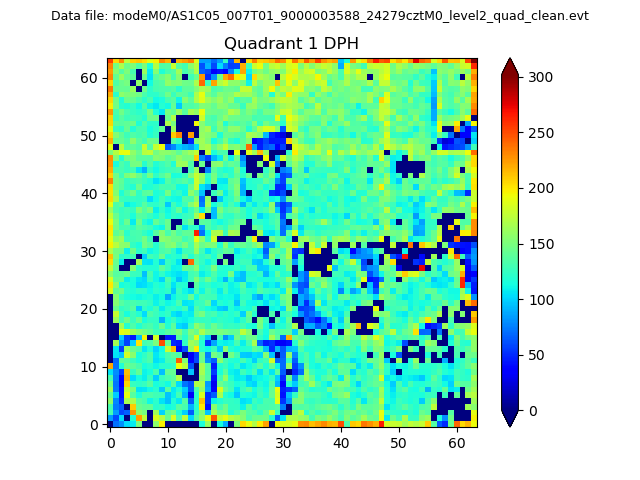 |
Quadrant B |
|---|---|---|---|
| Quadrant D | 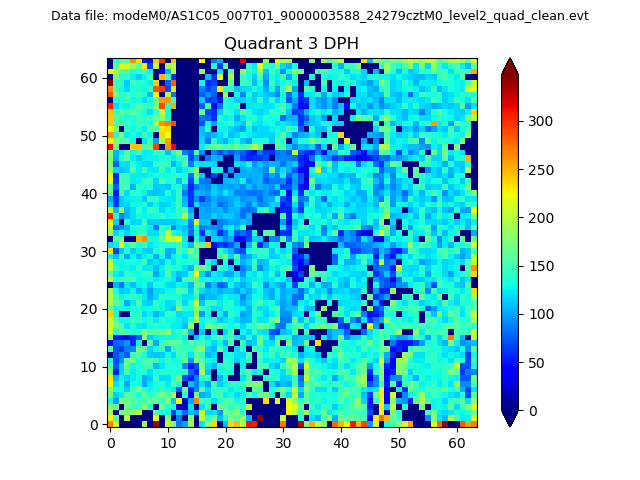 |
 |
Quadrant C |
| Plot type | Count rate plots | Images |
|---|---|---|
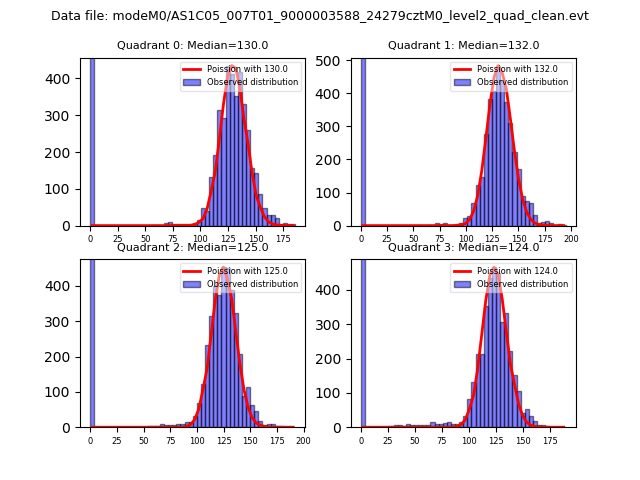
| Comparison with Poisson distribution Blue bars denote a histogram of data divided into 1 sec bins. Red curve is a Poisson curve with rate = median count rate of data. |
 |
 |
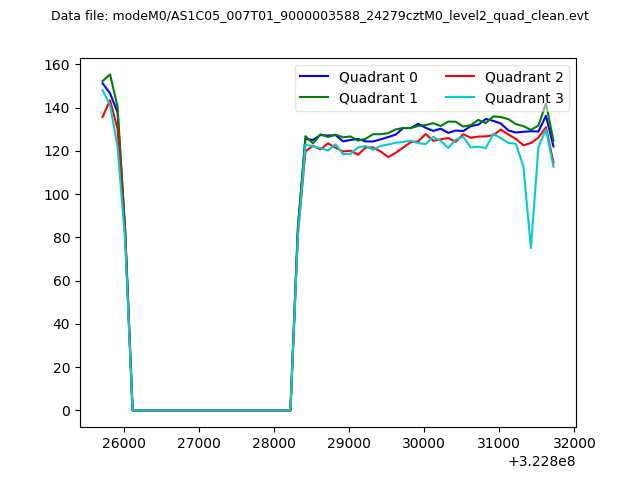
| Quadrant-wise count rates Data is divided into 100 sec bins |
 |
|
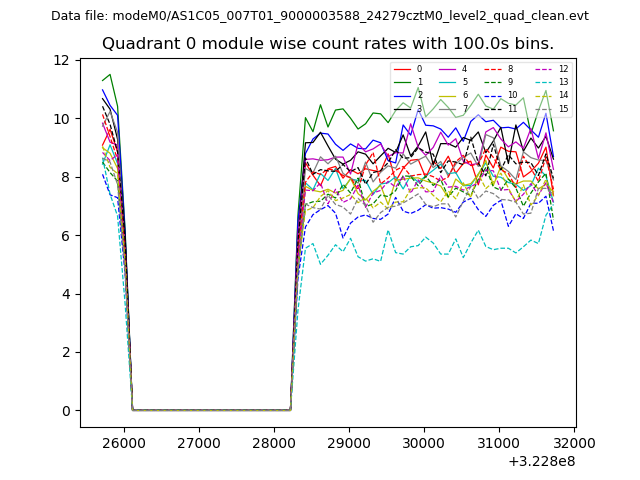
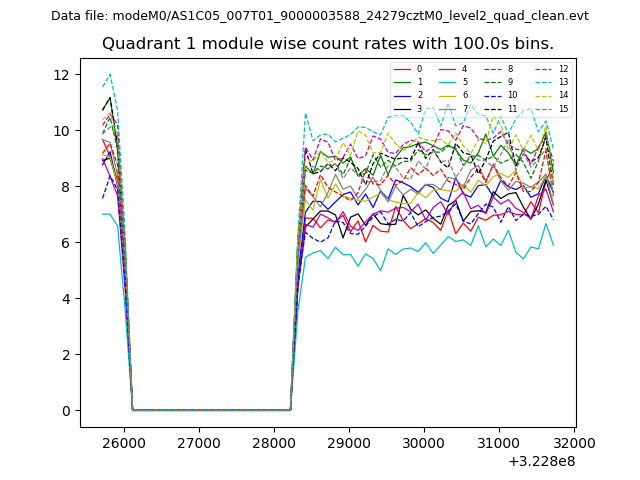
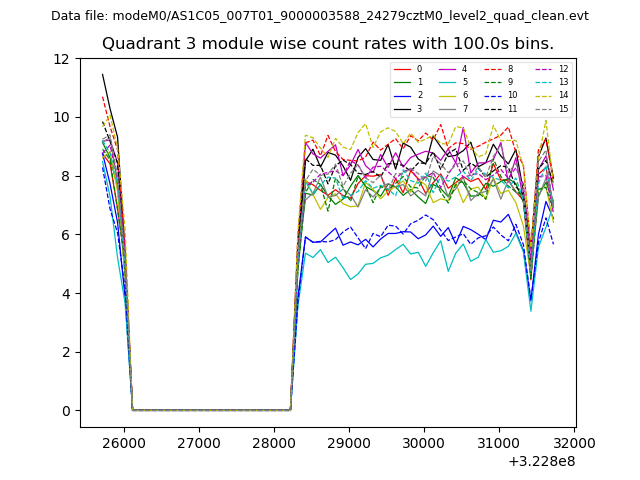
| Module-wise count rates for Quadrant A Data is divided into 100 sec bins |
 |
 |
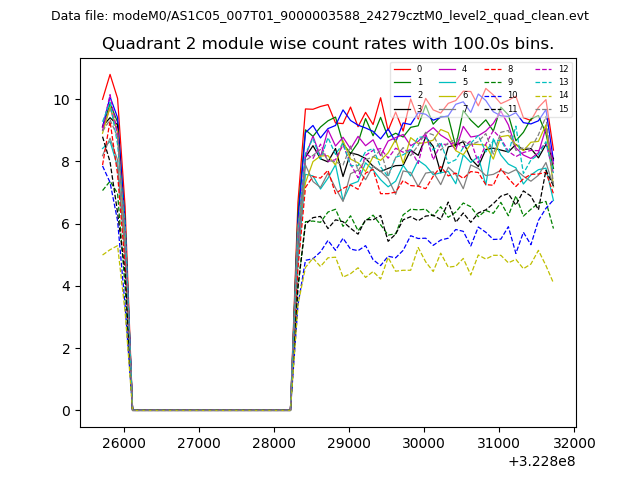
| Module-wise count rates for Quadrant B Data is divided into 100 sec bins |
 |
 |
| Module-wise count rates for Quadrant C Data is divided into 100 sec bins |
 |
 |
| Module-wise count rates for Quadrant D Data is divided into 100 sec bins |
 |
 |
| Parameter | Plot |
|---|---|
| CZT HV Monitor | 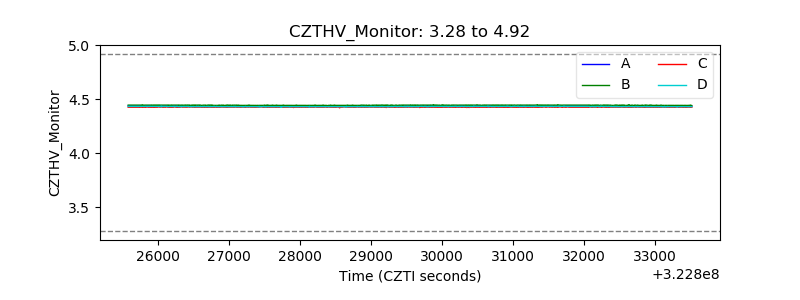 |
| D_VDD | 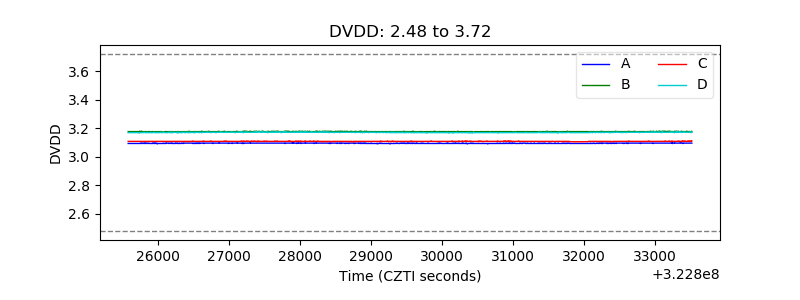 |
| Temperature 1 | 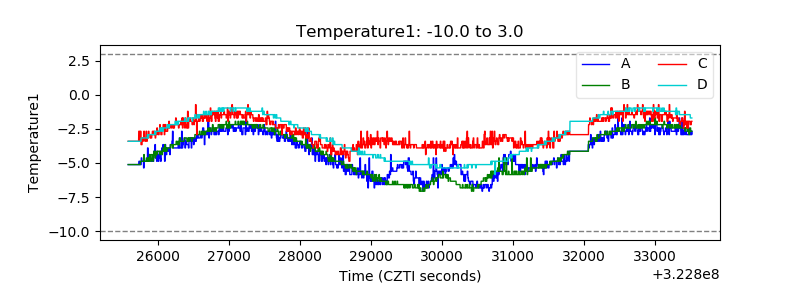 |
| Veto HV Monitor | 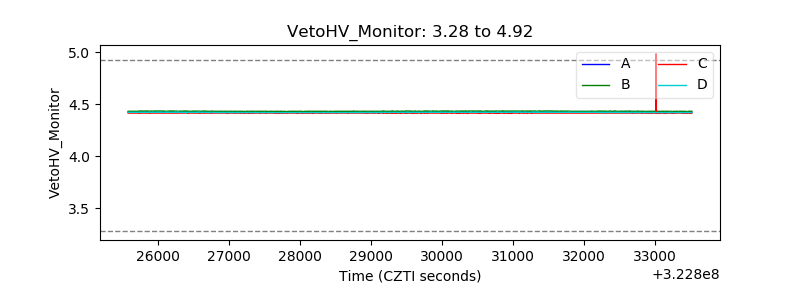 |
| Veto LLD | 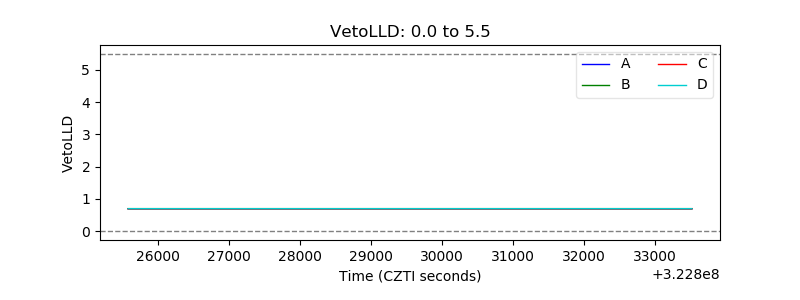 |
| Alpha Counter | 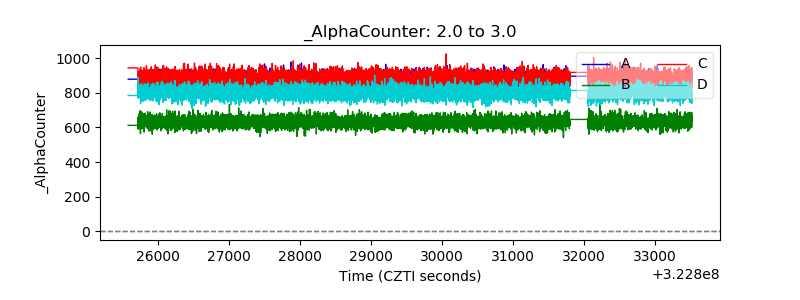 |
| _CPM_Rate | 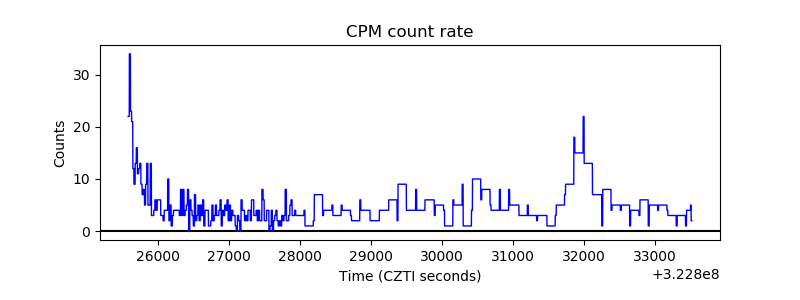 |
| CZT Counter | 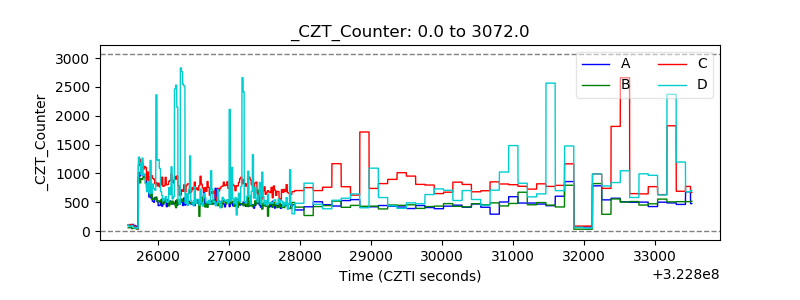 |
| +2.5 Volts monitor |  |
| +5 Volts monitor | 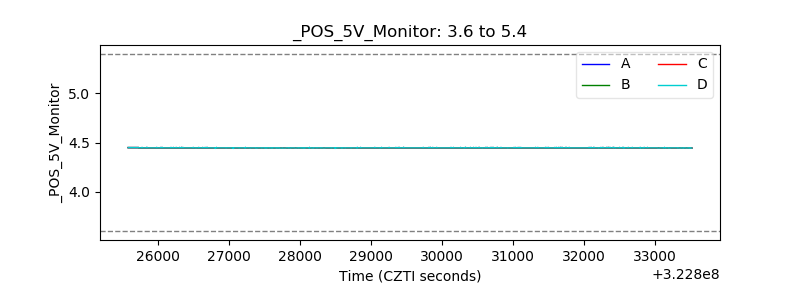 |
| _ROLL_ROT | 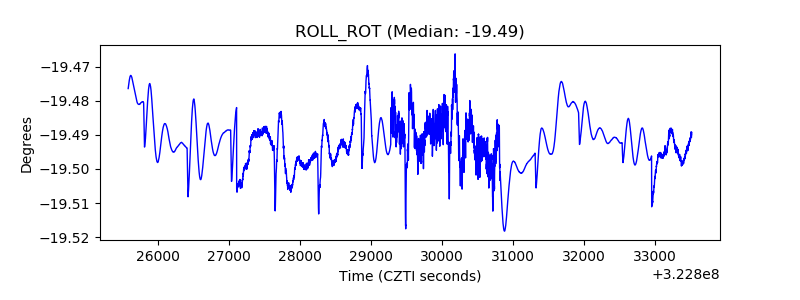 |
| _Roll_DEC | 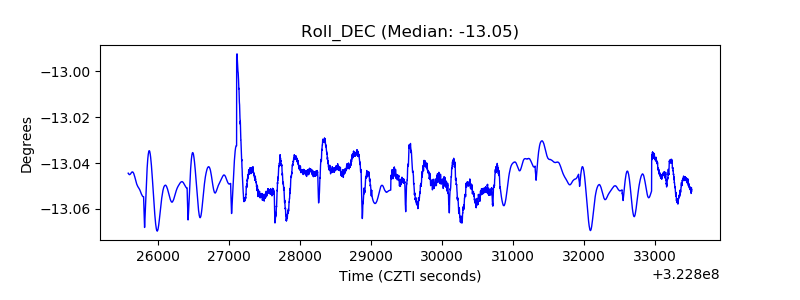 |
| _Roll_RA | 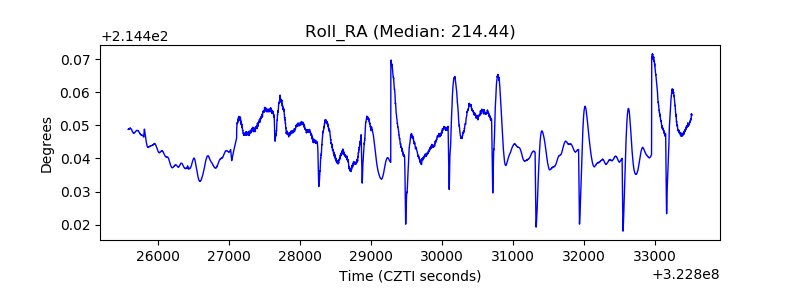 |
| Veto Counter | 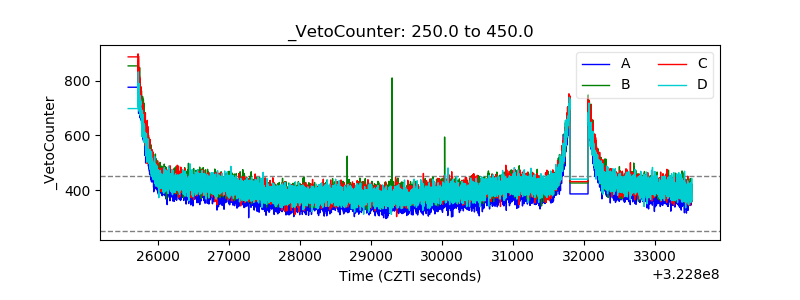 |