| Param | Original file | Final file |
|---|---|---|
| Filename | modeM0/AS1C05_007T01_9000003588_24282cztM0_level2.evt | modeM0/AS1C05_007T01_9000003588_24282cztM0_level2_quad_clean.evt |
| Size (bytes) | 1,358,683,200 | 184,988,160 |
| Size | 1.3 GB | 176.4 MB |
| Events in quadrant A | 7,786,885 | 1,160,126 |
| Events in quadrant B | 7,346,316 | 1,180,838 |
| Events in quadrant C | 12,819,271 | 1,121,289 |
| Events in quadrant D | 12,184,581 | 1,104,766 |
| Mode M0 | |||
|---|---|---|---|
| Quadrant | BADHDUFLAG | Total packets | Discarded packets |
| A | 0 | 33008 | 3 |
| B | 0 | 31441 | 3 |
| C | 0 | 49200 | 3 |
| D | 0 | 46300 | 3 |
| Mode M9 | |||
|---|---|---|---|
| Quadrant | BADHDUFLAG | Total packets | Discarded packets |
| A | 0 | 12 | 0 |
| B | 0 | 12 | 0 |
| C | 0 | 12 | 0 |
| D | 0 | 12 | 0 |
| Mode SS | |||
|---|---|---|---|
| Quadrant | BADHDUFLAG | Total packets | Discarded packets |
| A | 0 | 306 | 0 |
| B | 0 | 306 | 0 |
| C | 0 | 306 | 0 |
| D | 0 | 306 | 0 |
| Quadrant | Total seconds | Saturated seconds | Saturation percentage |
|---|---|---|---|
| A | 15004 | 384 | 2.559318% |
| B | 15004 | 253 | 1.686217% |
| C | 15005 | 1116 | 7.437521% |
| D | 15005 | 843 | 5.618127% |
Noise dominated data is calculated using 1-second bins in cleaned event files. If a bin has >2000 counts, and if more than 50% of those come from <1% of pixels, then it is considered to be noise-dominated and hence unusable.
| Quadrant | # 1 sec bins | Bins with >0 counts | Bins with >2000 counts | High rate bins dominated by noise | Noise dominated (total time) | Noise dominated (detector-on time) | Marked lightcurve |
|---|---|---|---|---|---|---|---|
| A | 16219 | 15005 | 186 | 186 | 1.15% | 1.24% | 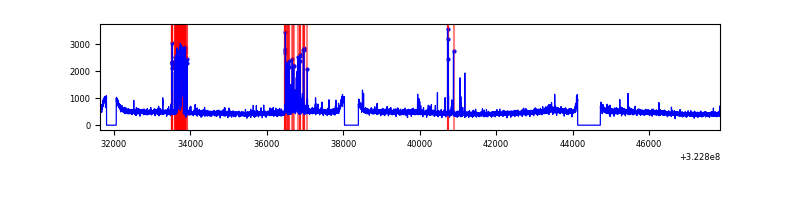 |
| B | 16219 | 15004 | 12 | 12 | 0.07% | 0.08% |  |
| C | 16220 | 15005 | 571 | 571 | 3.52% | 3.81% | 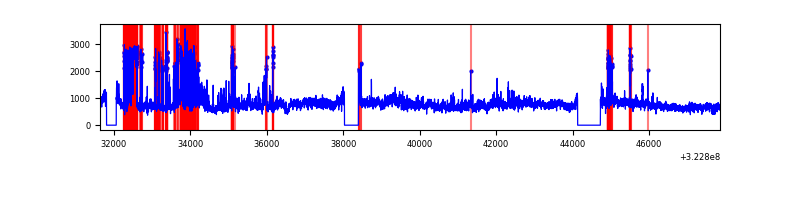 |
| D | 16220 | 15006 | 641 | 641 | 3.95% | 4.27% | 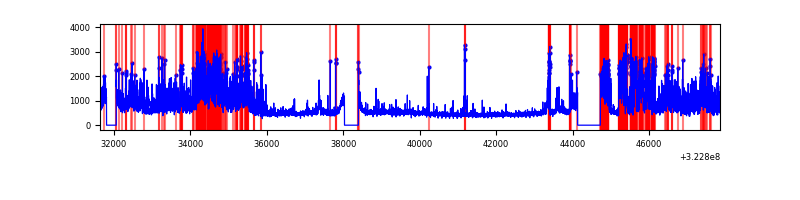 |
Top three noisy pixels from each quadrant. If the there are fewer than three noisy pixels in the level2.evt file, extra rows are filled as -1
| Pixel properties | Quadrant properties | ||||||
|---|---|---|---|---|---|---|---|
| Quadrant | DetID | PixID | Counts | Sigma | Mean | Median | Sigma |
| A | 6 | 16 | 704558 | 1911.15 | 1827 | 1788 | 367.7 |
| A | 3 | 1 | 44950 | 117.38 | 1827 | 1788 | 367.7 |
| A | 13 | 254 | 22380 | 56.0 | 1827 | 1788 | 367.7 |
| B | 12 | 17 | 127888 | 358.2 | 1828 | 1780 | 352.1 |
| B | 12 | 111 | 43776 | 119.28 | 1828 | 1780 | 352.1 |
| B | 11 | 111 | 39046 | 105.85 | 1828 | 1780 | 352.1 |
| C | 7 | 247 | 3808905 | 9462.08 | 1718 | 1728 | 402.4 |
| C | 2 | 16 | 2039449 | 5064.4 | 1718 | 1728 | 402.4 |
| C | 14 | 238 | 268450 | 662.89 | 1718 | 1728 | 402.4 |
| D | 8 | 195 | 3937565 | 9116.54 | 1770 | 1715 | 431.7 |
| D | 1 | 52 | 1188405 | 2748.71 | 1770 | 1715 | 431.7 |
| D | 12 | 218 | 165654 | 379.73 | 1770 | 1715 | 431.7 |
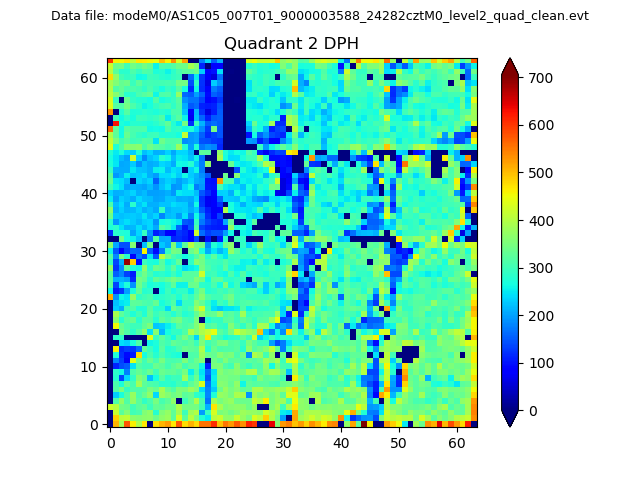
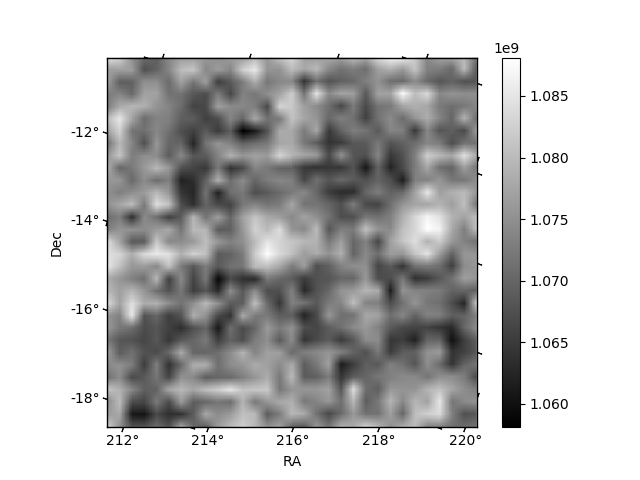
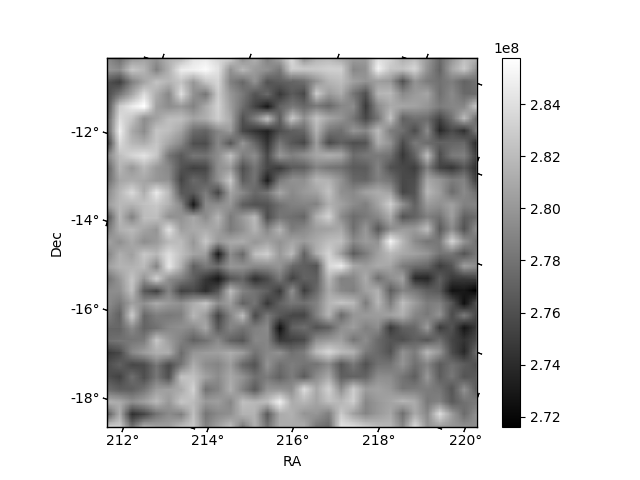
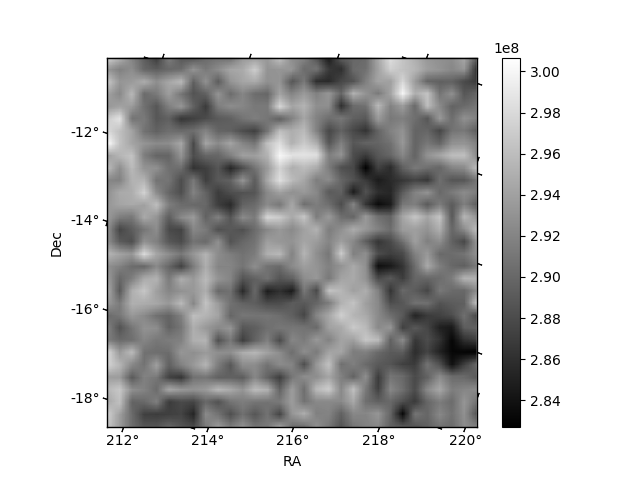
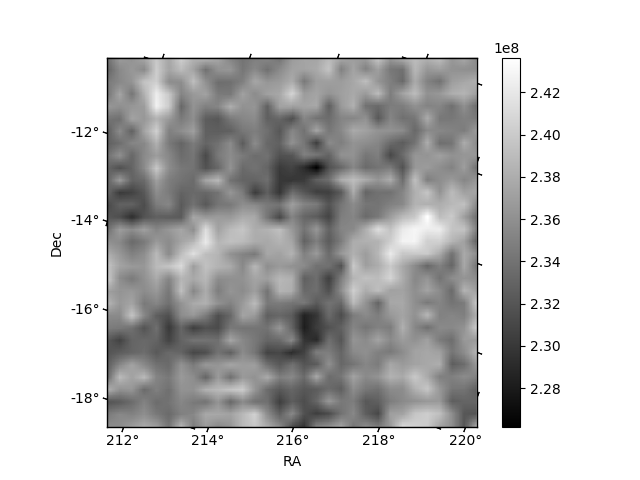
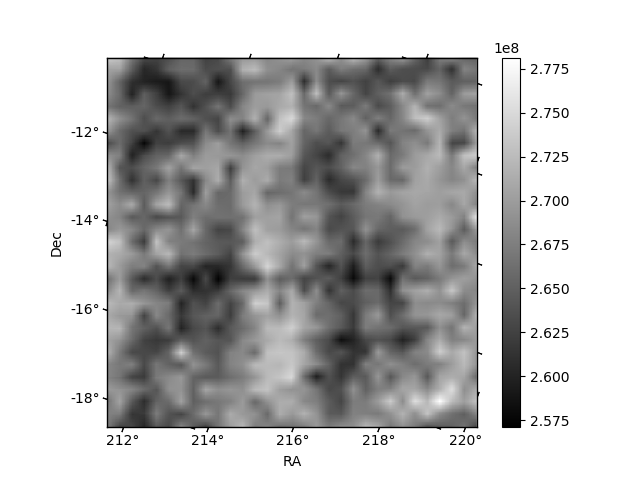
Histogram calculated using DETX and DETY for each event in the final _common_clean file
| Quadrant A | 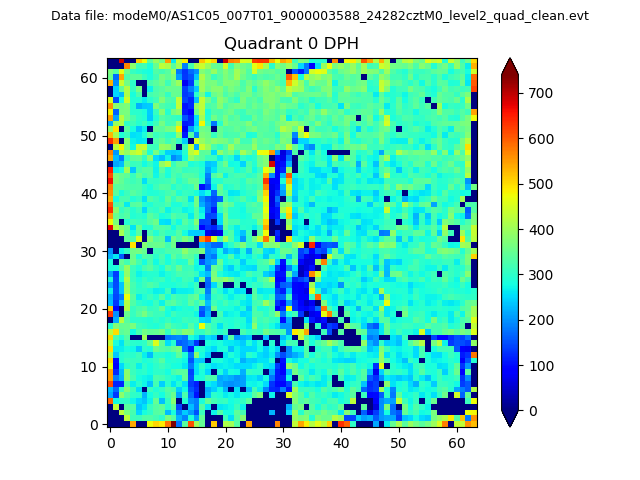 |
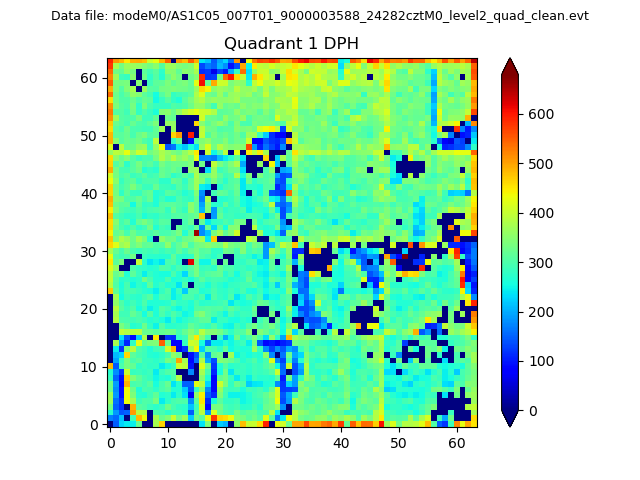 |
Quadrant B |
|---|---|---|---|
| Quadrant D | 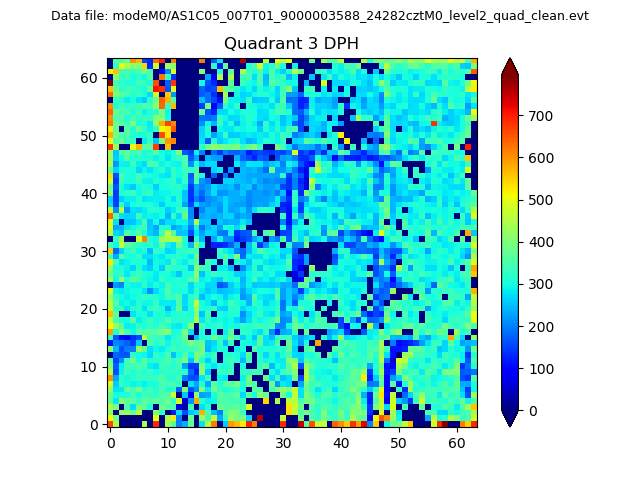 |
 |
Quadrant C |
| Plot type | Count rate plots | Images |
|---|---|---|
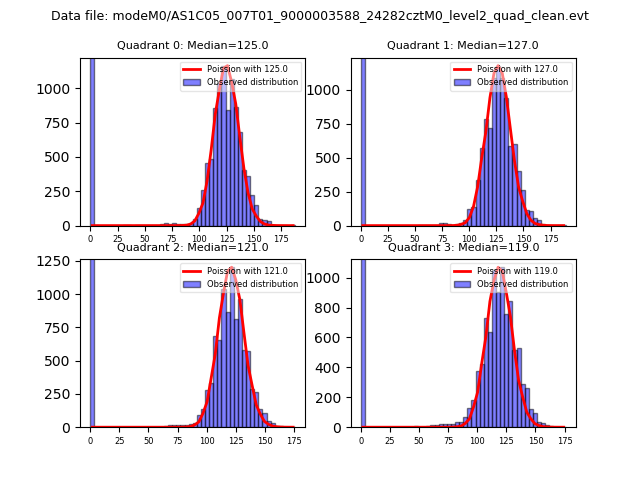
| Comparison with Poisson distribution Blue bars denote a histogram of data divided into 1 sec bins. Red curve is a Poisson curve with rate = median count rate of data. |
 |
 |
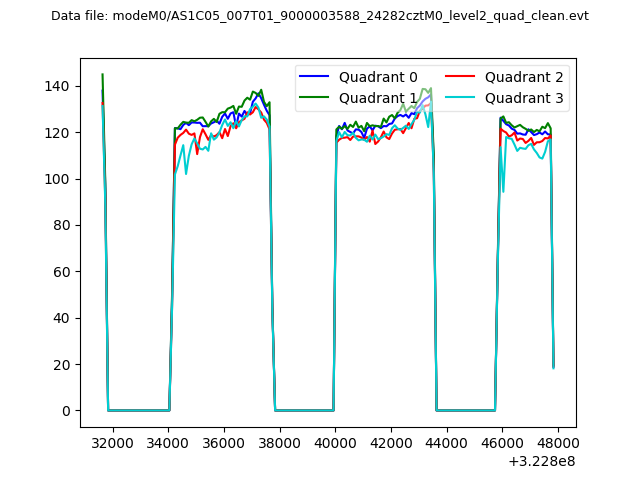
| Quadrant-wise count rates Data is divided into 100 sec bins |
 |
|
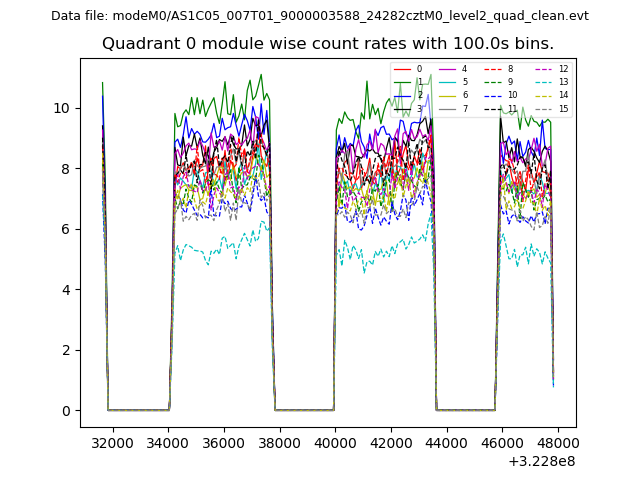
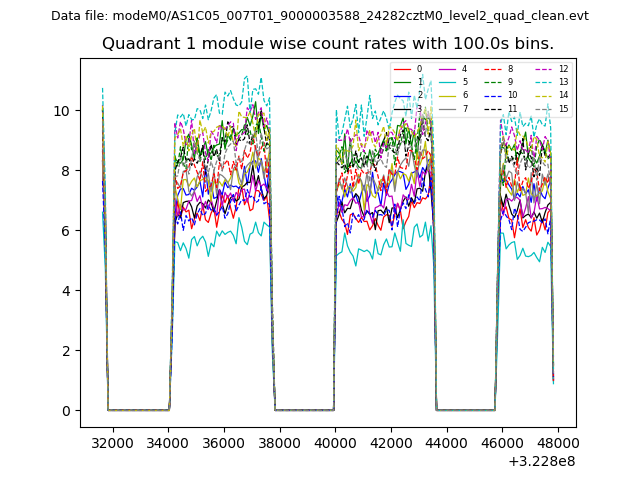
| Module-wise count rates for Quadrant A Data is divided into 100 sec bins |
 |
 |
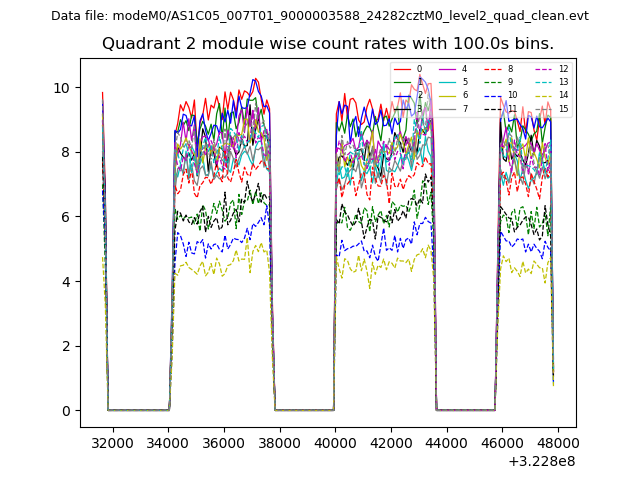
| Module-wise count rates for Quadrant B Data is divided into 100 sec bins |
 |
 |
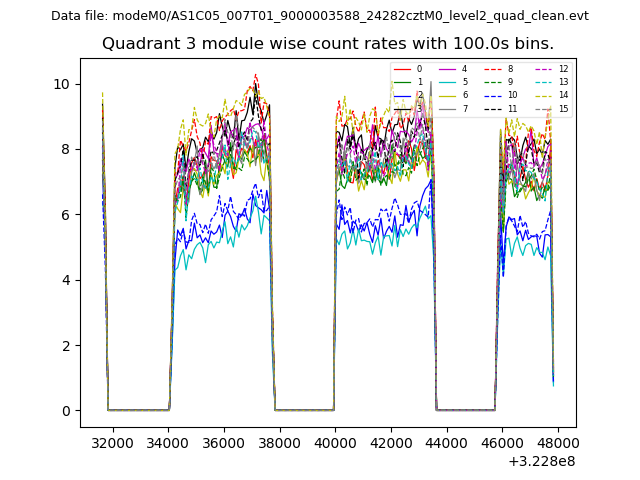
| Module-wise count rates for Quadrant C Data is divided into 100 sec bins |
 |
 |
| Module-wise count rates for Quadrant D Data is divided into 100 sec bins |
 |
 |
| Parameter | Plot |
|---|---|
| CZT HV Monitor | 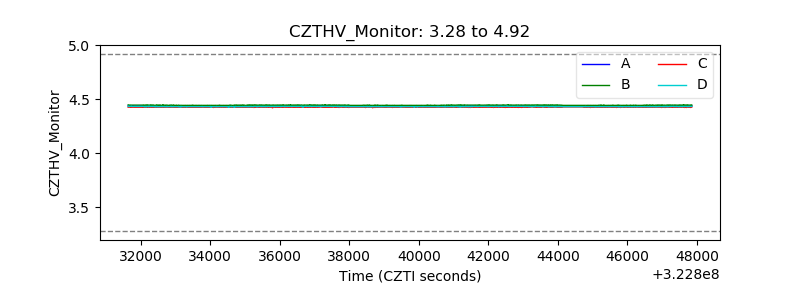 |
| D_VDD | 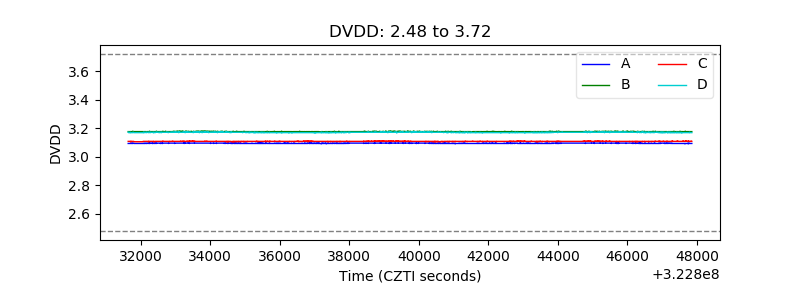 |
| Temperature 1 | 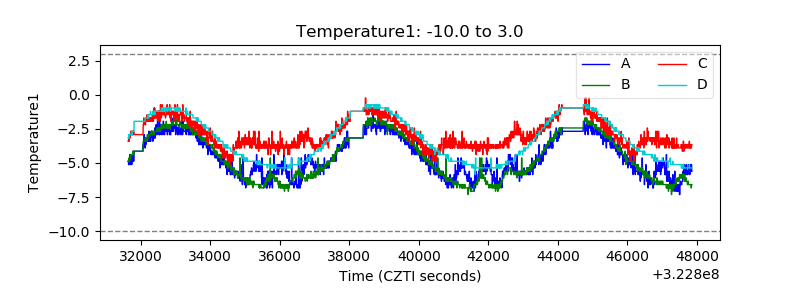 |
| Veto HV Monitor | 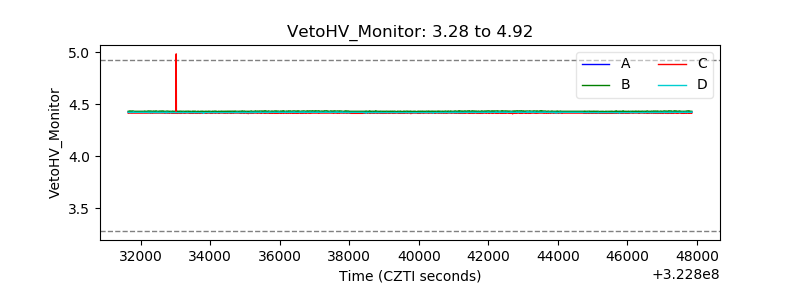 |
| Veto LLD | 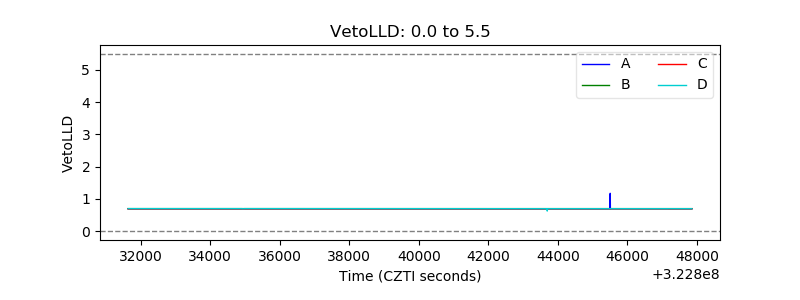 |
| Alpha Counter | 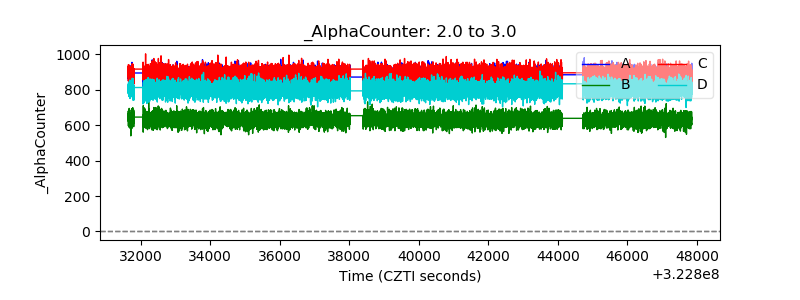 |
| _CPM_Rate | 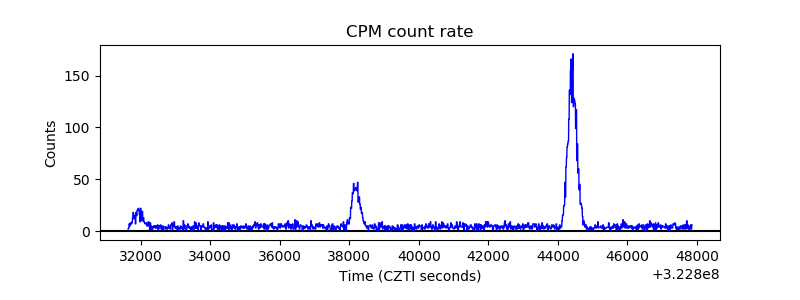 |
| CZT Counter | 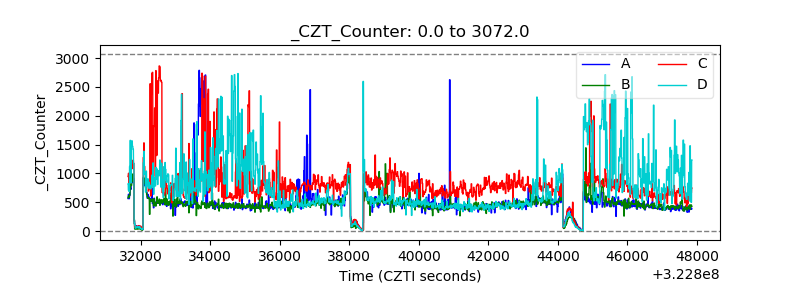 |
| +2.5 Volts monitor | 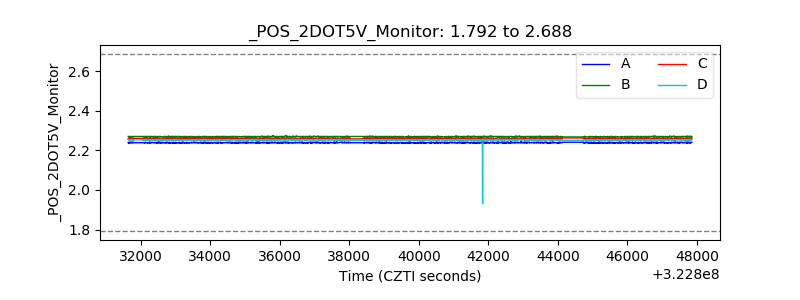 |
| +5 Volts monitor | 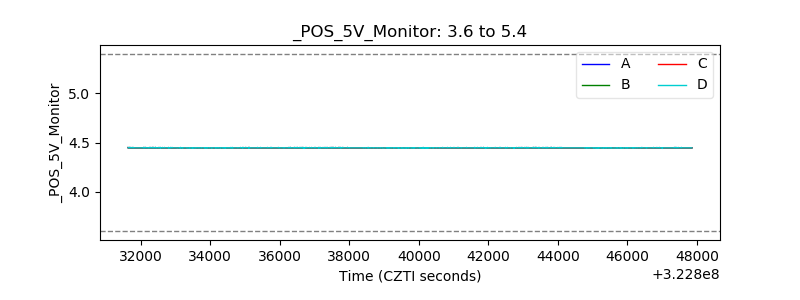 |
| _ROLL_ROT | 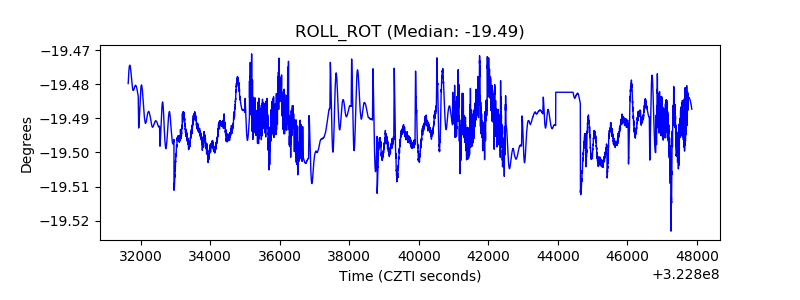 |
| _Roll_DEC |  |
| _Roll_RA | 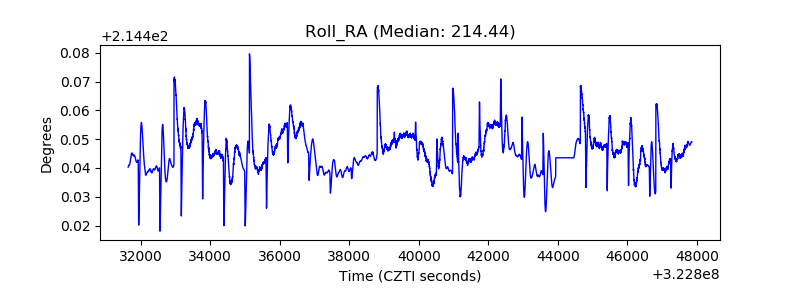 |
| Veto Counter | 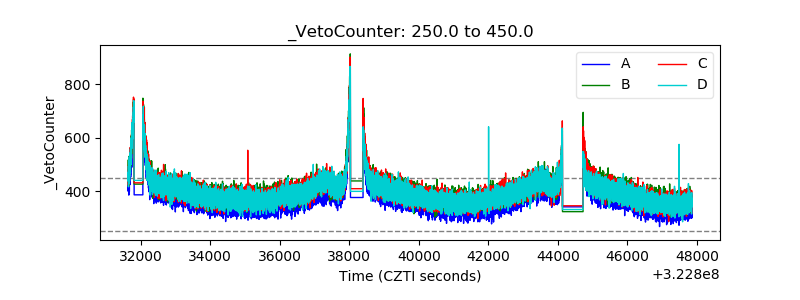 |