| Param | Original file | Final file |
|---|---|---|
| Filename | modeM0/AS1A07_047T08_9000003590cztM0_level2.fits | modeM0/AS1A07_047T08_9000003590cztM0_level2_quad_clean.evt |
| Size (bytes) | 475,338,240 | 502,539,840 |
| Size | 453.3 MB | 479.3 MB |
| Events in quadrant A | 2,991,592 | 3,197,926 |
| Events in quadrant B | 2,864,148 | 3,208,986 |
| Events in quadrant C | 2,900,242 | 3,002,497 |
| Events in quadrant D | 2,471,760 | 2,641,823 |
| Mode SS | |||
|---|---|---|---|
| Quadrant | BADHDUFLAG | Total packets | Discarded packets |
| A | 0 | 938 | 0 |
| B | 0 | 938 | 0 |
| C | 0 | 938 | 0 |
| D | 0 | 938 | 0 |
| Mode M9 | |||
|---|---|---|---|
| Quadrant | BADHDUFLAG | Total packets | Discarded packets |
| A | 0 | 101 | 0 |
| B | 0 | 101 | 0 |
| C | 0 | 101 | 0 |
| D | 0 | 101 | 0 |
| Mode M0 | |||
|---|---|---|---|
| Quadrant | BADHDUFLAG | Total packets | Discarded packets |
| A | 0 | 95342 | 0 |
| B | 0 | 98038 | 0 |
| C | 0 | 119166 | 0 |
| D | 0 | 158893 | 0 |
| Quadrant | Total seconds | Saturated seconds | Saturation percentage |
|---|---|---|---|
| A | 46153 | 319 | 0.691179% |
| B | 46153 | 554 | 1.200355% |
| C | 46153 | 920 | 1.993370% |
| D | 46153 | 3097 | 6.710290% |
Noise dominated data is calculated using 1-second bins in cleaned event files. If a bin has >2000 counts, and if more than 50% of those come from <1% of pixels, then it is considered to be noise-dominated and hence unusable.
| Quadrant | # 1 sec bins | Bins with >0 counts | Bins with >2000 counts | High rate bins dominated by noise | Noise dominated (total time) | Noise dominated (detector-on time) | Marked lightcurve |
|---|---|---|---|---|---|---|---|
| A | 56227 | 46145 | 0 | 0 | 0.00% | 0.00% |  |
| B | 56228 | 46146 | 0 | 0 | 0.00% | 0.00% |  |
| C | 56228 | 46145 | 0 | 0 | 0.00% | 0.00% | 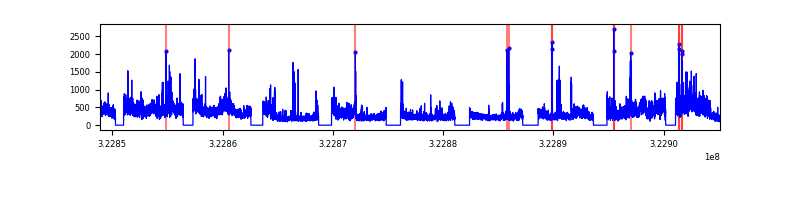 |
| D | 56228 | 46132 | 0 | 0 | 0.00% | 0.00% |  |
Top three noisy pixels from each quadrant. If the there are fewer than three noisy pixels in the level2.evt file, extra rows are filled as -1
| Pixel properties | Quadrant properties | ||||||
|---|---|---|---|---|---|---|---|
| Quadrant | DetID | PixID | Counts | Sigma | Mean | Median | Sigma |
| A | 0 | 29 | 2771 | 10.78 | 779 | 741 | 188.4 |
| A | 7 | 110 | 2395 | 8.78 | 779 | 741 | 188.4 |
| A | 0 | 30 | 2217 | 7.84 | 779 | 741 | 188.4 |
| B | 2 | 9 | 2321 | 10.92 | 758 | 730 | 145.7 |
| B | 2 | 8 | 1924 | 8.19 | 758 | 730 | 145.7 |
| B | 3 | 80 | 1877 | 7.87 | 758 | 730 | 145.7 |
| C | 1 | 80 | 2261 | 8.0 | 766 | 726 | 191.8 |
| C | 1 | 81 | 2253 | 7.96 | 766 | 726 | 191.8 |
| C | 12 | 241 | 1975 | 6.51 | 766 | 726 | 191.8 |
| D | 3 | 14 | 1812 | 6.23 | 706 | 646 | 187.2 |
| D | 7 | 3 | 1790 | 6.11 | 706 | 646 | 187.2 |
| D | 10 | 189 | 1773 | 6.02 | 706 | 646 | 187.2 |
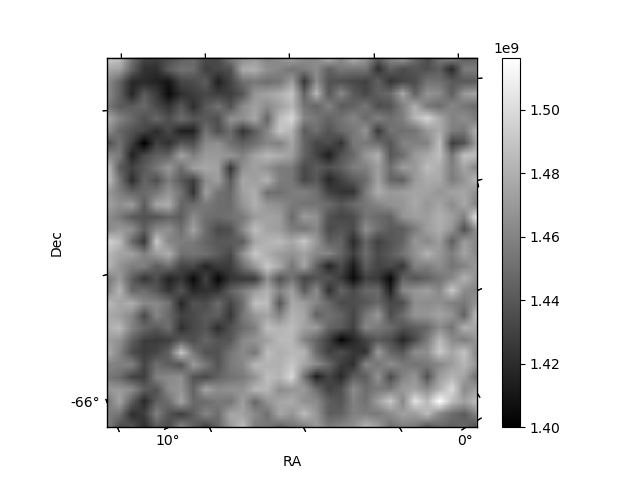
Histogram calculated using DETX and DETY for each event in the final _common_clean file
| Quadrant A |  |
 |
Quadrant B |
|---|---|---|---|
| Quadrant D | 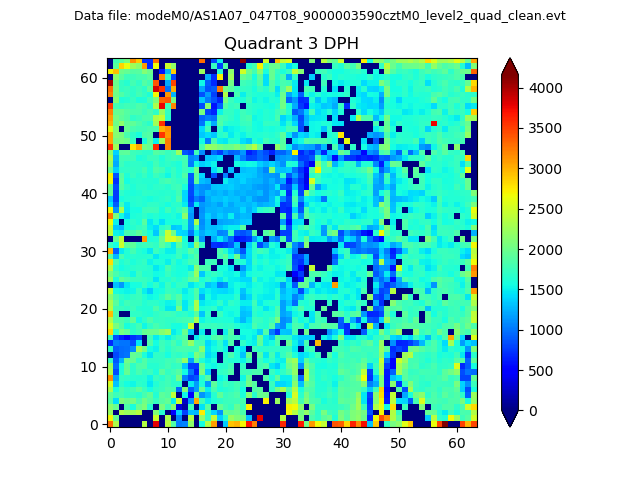 |
 |
Quadrant C |
| Plot type | Count rate plots | Images |
|---|---|---|
| Comparison with Poisson distribution Blue bars denote a histogram of data divided into 1 sec bins. Red curve is a Poisson curve with rate = median count rate of data. |
 |
 |
| Quadrant-wise count rates Data is divided into 100 sec bins |
 |
|
| Module-wise count rates for Quadrant A Data is divided into 100 sec bins |
 |
 |
| Module-wise count rates for Quadrant B Data is divided into 100 sec bins |
 |
 |
| Module-wise count rates for Quadrant C Data is divided into 100 sec bins |
 |
 |
| Module-wise count rates for Quadrant D Data is divided into 100 sec bins |
 |
 |
| Parameter | Plot |
|---|---|
| CZT HV Monitor |  |
| D_VDD |  |
| Temperature 1 | 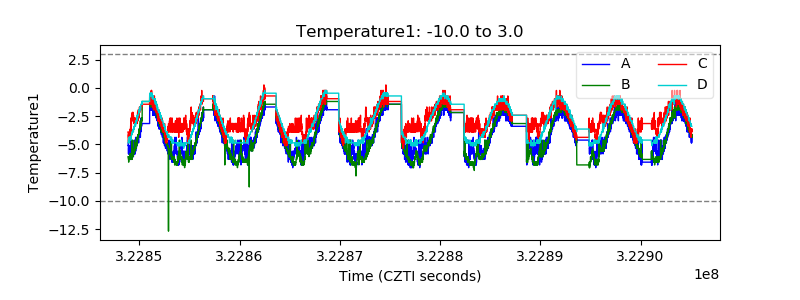 |
| Veto HV Monitor |  |
| Veto LLD |  |
| Alpha Counter |  |
| _CPM_Rate |  |
| CZT Counter |  |
| +2.5 Volts monitor |  |
| +5 Volts monitor |  |
| _ROLL_ROT |  |
| _Roll_DEC | 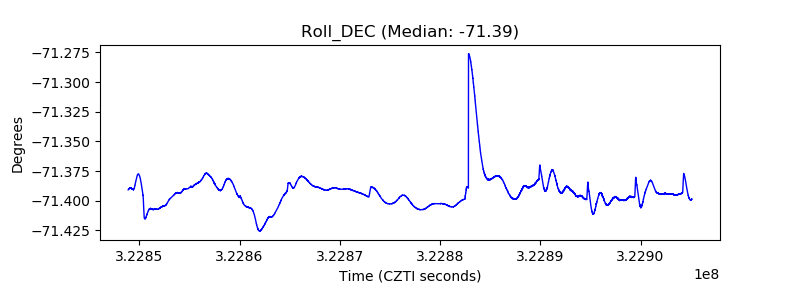 |
| _Roll_RA |  |
| Veto Counter |  |