| Param | Original file | Final file |
|---|---|---|
| Filename | modeM0/AS1A07_047T08_9000003590_24283cztM0_level2.evt | modeM0/AS1A07_047T08_9000003590_24283cztM0_level2_quad_clean.evt |
| Size (bytes) | 583,001,280 | 128,136,960 |
| Size | 556.0 MB | 122.2 MB |
| Events in quadrant A | 3,146,017 | 882,960 |
| Events in quadrant B | 3,310,518 | 892,970 |
| Events in quadrant C | 5,058,977 | 829,249 |
| Events in quadrant D | 5,680,538 | 802,108 |
| Mode SS | |||
|---|---|---|---|
| Quadrant | BADHDUFLAG | Total packets | Discarded packets |
| A | 0 | 138 | 0 |
| B | 0 | 138 | 0 |
| C | 0 | 138 | 0 |
| D | 0 | 138 | 0 |
| Mode M9 | |||
|---|---|---|---|
| Quadrant | BADHDUFLAG | Total packets | Discarded packets |
| A | 0 | 9 | 0 |
| B | 0 | 9 | 0 |
| C | 0 | 9 | 0 |
| D | 0 | 9 | 0 |
| Mode M0 | |||
|---|---|---|---|
| Quadrant | BADHDUFLAG | Total packets | Discarded packets |
| A | 0 | 13812 | 1 |
| B | 0 | 14325 | 1 |
| C | 0 | 20258 | 1 |
| D | 0 | 21593 | 1 |
| Quadrant | Total seconds | Saturated seconds | Saturation percentage |
|---|---|---|---|
| A | 6796 | 34 | 0.500294% |
| B | 6797 | 42 | 0.617920% |
| C | 6797 | 122 | 1.794910% |
| D | 6797 | 380 | 5.590702% |
Noise dominated data is calculated using 1-second bins in cleaned event files. If a bin has >2000 counts, and if more than 50% of those come from <1% of pixels, then it is considered to be noise-dominated and hence unusable.
| Quadrant | # 1 sec bins | Bins with >0 counts | Bins with >2000 counts | High rate bins dominated by noise | Noise dominated (total time) | Noise dominated (detector-on time) | Marked lightcurve |
|---|---|---|---|---|---|---|---|
| A | 7691 | 6796 | 0 | 0 | 0.00% | 0.00% | 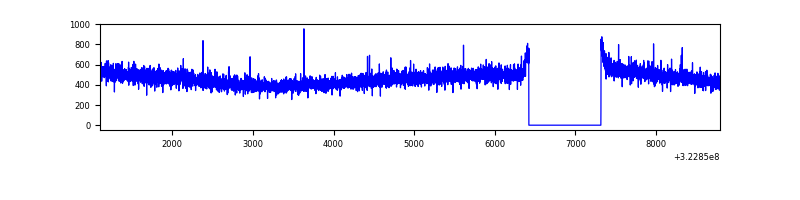 |
| B | 7692 | 6797 | 2 | 2 | 0.03% | 0.03% | 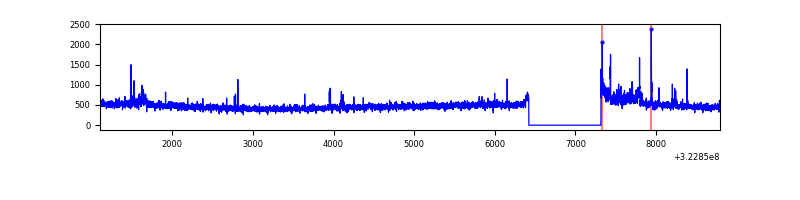 |
| C | 7692 | 6797 | 7 | 7 | 0.09% | 0.10% | 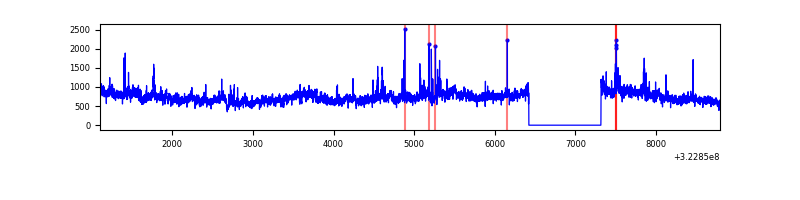 |
| D | 7692 | 6797 | 345 | 345 | 4.49% | 5.08% | 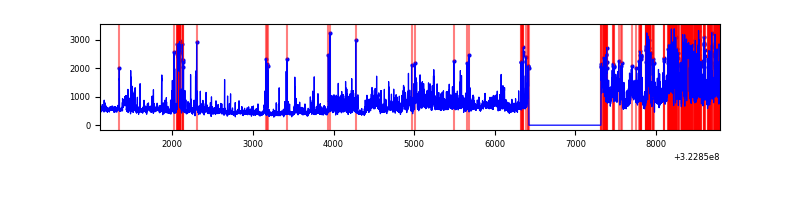 |
Top three noisy pixels from each quadrant. If the there are fewer than three noisy pixels in the level2.evt file, extra rows are filled as -1
| Pixel properties | Quadrant properties | ||||||
|---|---|---|---|---|---|---|---|
| Quadrant | DetID | PixID | Counts | Sigma | Mean | Median | Sigma |
| A | 13 | 254 | 10914 | 61.91 | 815 | 797 | 163.4 |
| A | 3 | 137 | 7315 | 39.89 | 815 | 797 | 163.4 |
| A | 0 | 226 | 7092 | 38.52 | 815 | 797 | 163.4 |
| B | 15 | 33 | 92216 | 595.44 | 811 | 790 | 153.5 |
| B | 12 | 111 | 18565 | 115.76 | 811 | 790 | 153.5 |
| B | 11 | 111 | 16230 | 100.56 | 811 | 790 | 153.5 |
| C | 7 | 247 | 1765397 | 9872.77 | 767 | 771 | 178.7 |
| C | 2 | 16 | 154171 | 858.25 | 767 | 771 | 178.7 |
| C | 14 | 238 | 124110 | 690.06 | 767 | 771 | 178.7 |
| D | 8 | 195 | 1463041 | 7920.87 | 766 | 744 | 184.6 |
| D | 1 | 52 | 1007498 | 5453.32 | 766 | 744 | 184.6 |
| D | 12 | 233 | 160272 | 864.12 | 766 | 744 | 184.6 |
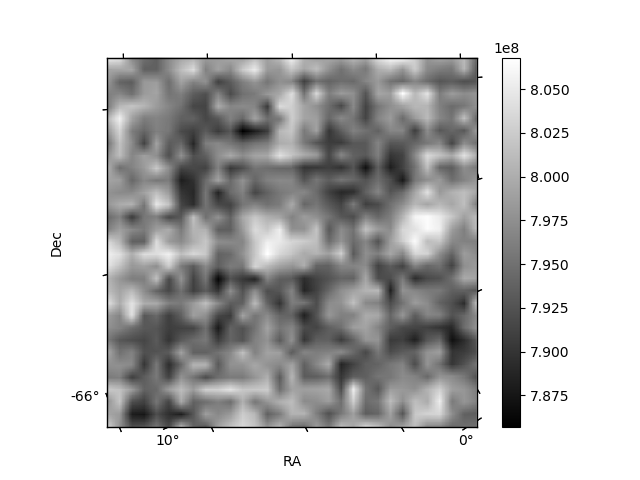
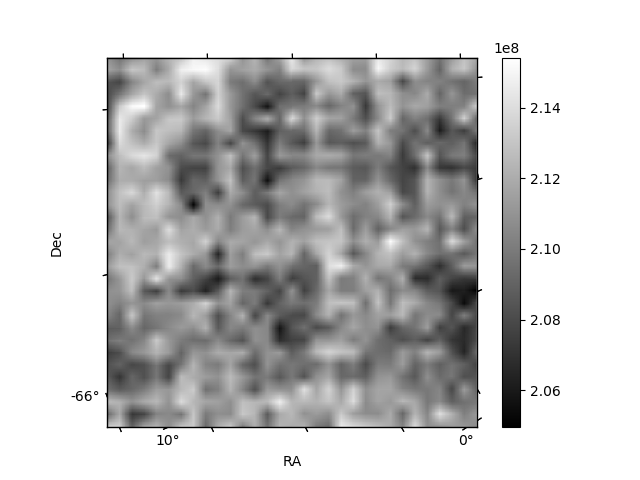
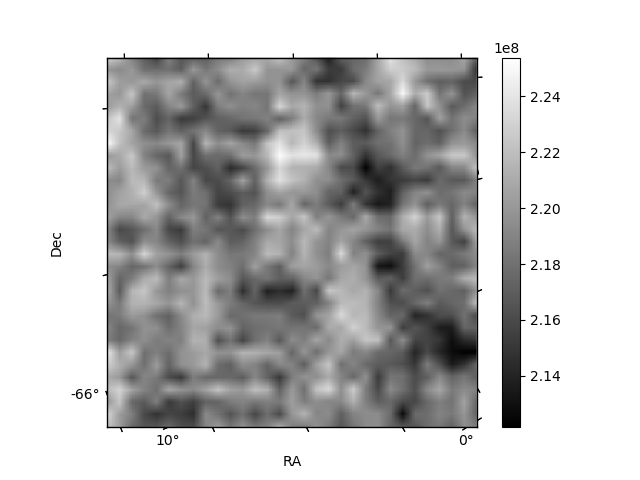
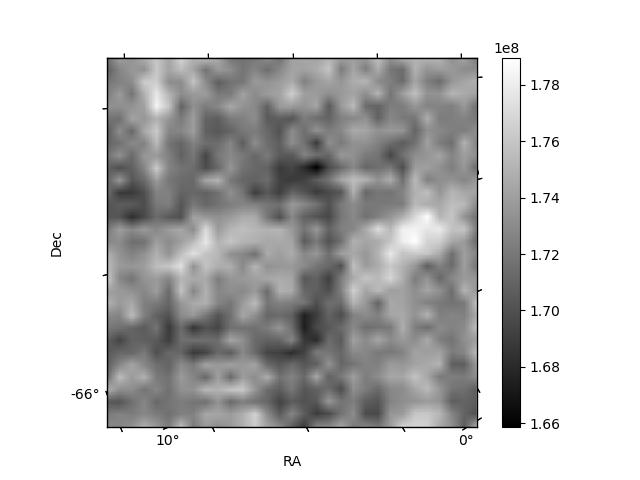
Histogram calculated using DETX and DETY for each event in the final _common_clean file
| Quadrant A | 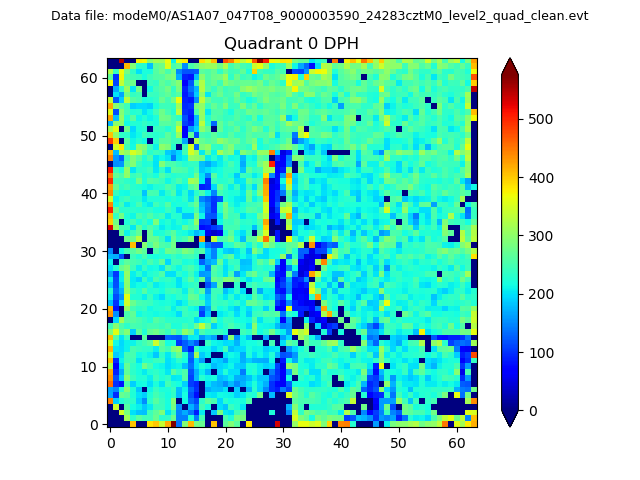 |
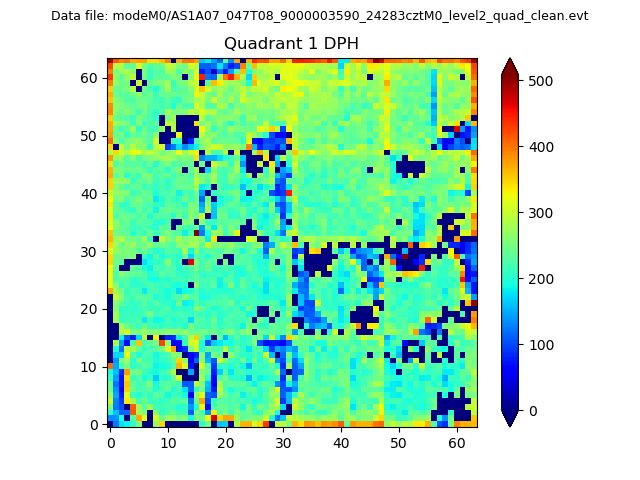 |
Quadrant B |
|---|---|---|---|
| Quadrant D | 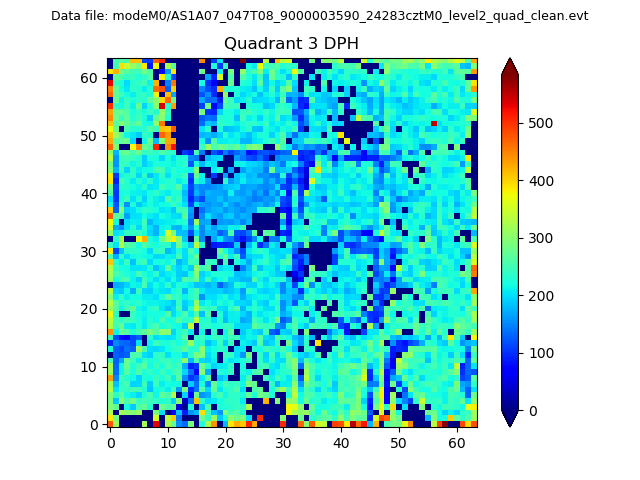 |
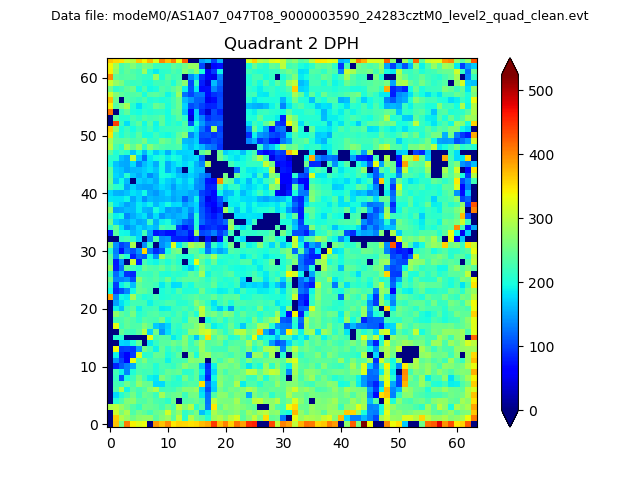 |
Quadrant C |
| Plot type | Count rate plots | Images |
|---|---|---|
| Comparison with Poisson distribution Blue bars denote a histogram of data divided into 1 sec bins. Red curve is a Poisson curve with rate = median count rate of data. |
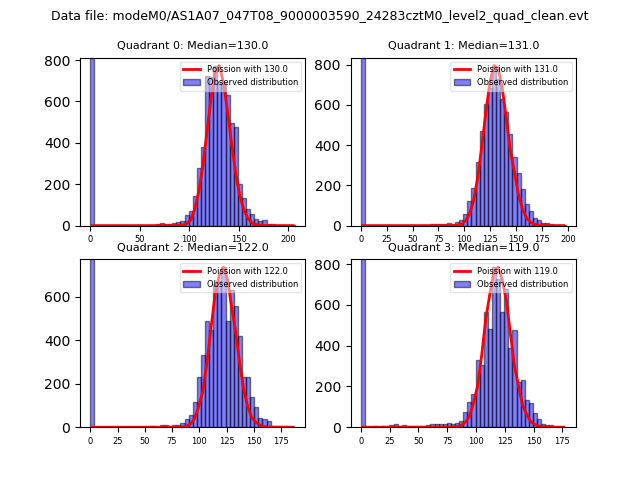 |
 |
| Quadrant-wise count rates Data is divided into 100 sec bins |
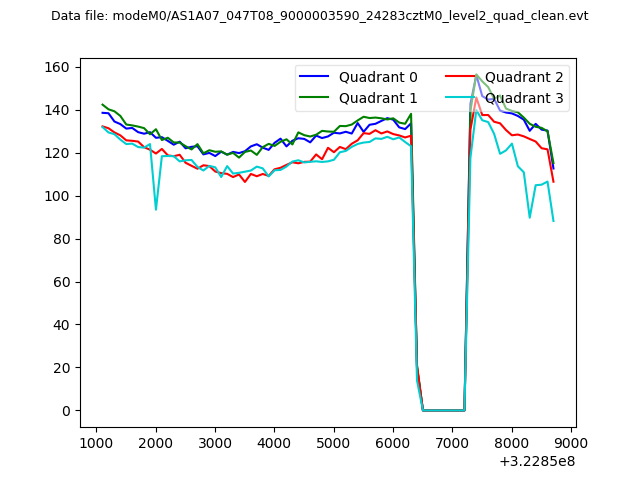 |
|
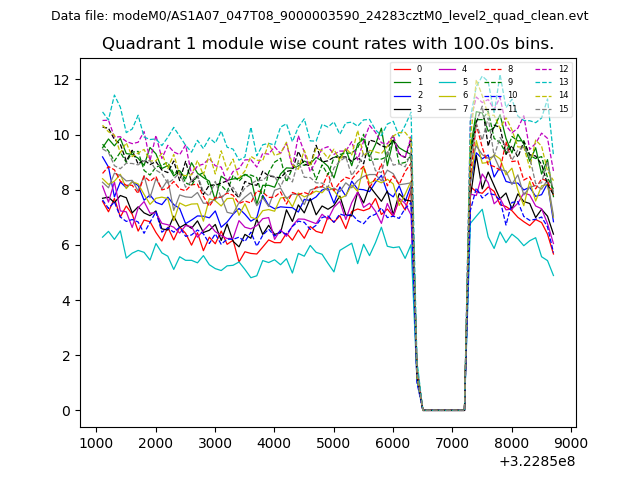
| Module-wise count rates for Quadrant A Data is divided into 100 sec bins |
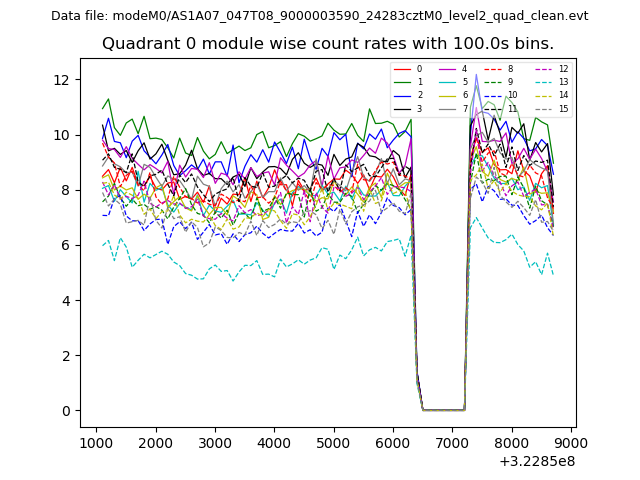 |
 |
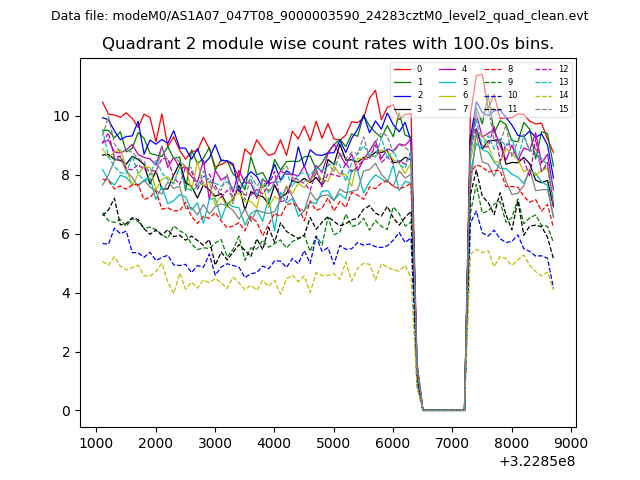
| Module-wise count rates for Quadrant B Data is divided into 100 sec bins |
 |
 |
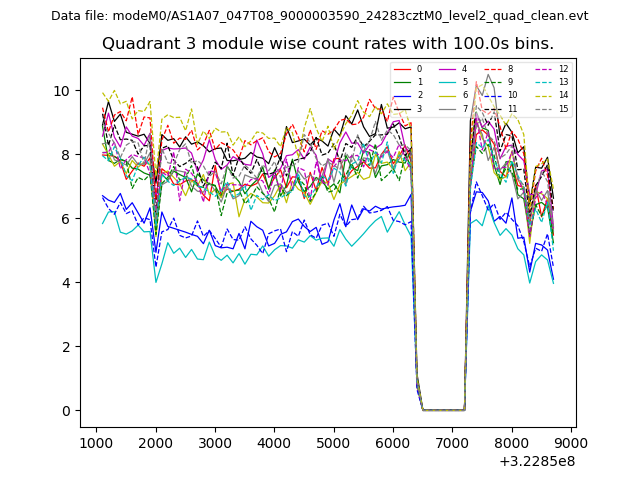
| Module-wise count rates for Quadrant C Data is divided into 100 sec bins |
 |
 |
| Module-wise count rates for Quadrant D Data is divided into 100 sec bins |
 |
 |
| Parameter | Plot |
|---|---|
| CZT HV Monitor | 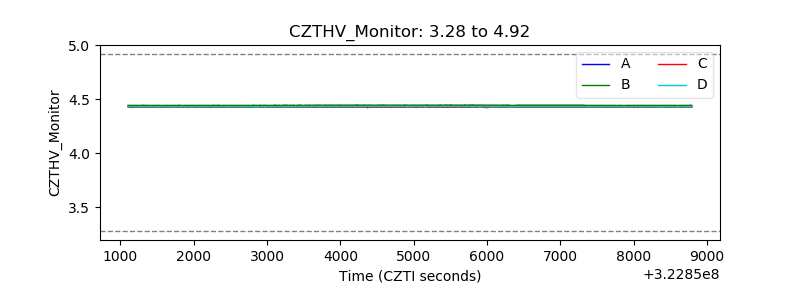 |
| D_VDD | 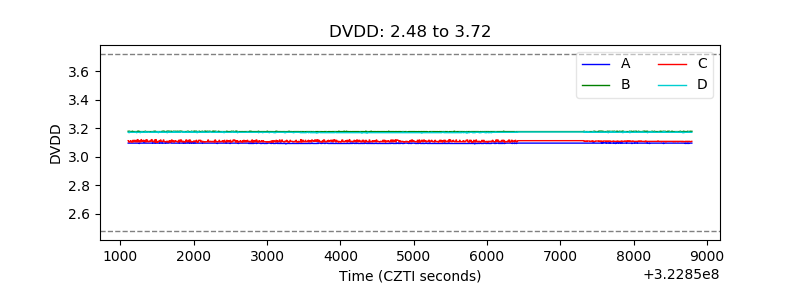 |
| Temperature 1 | 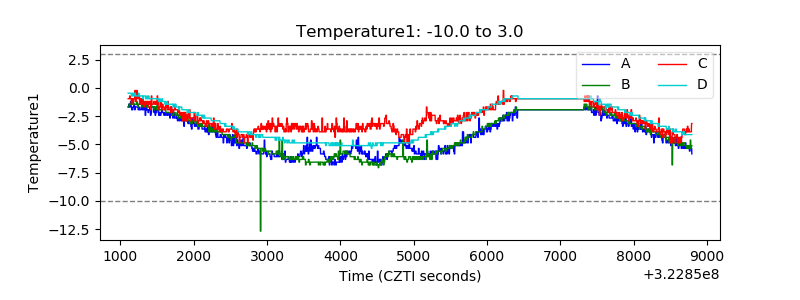 |
| Veto HV Monitor | 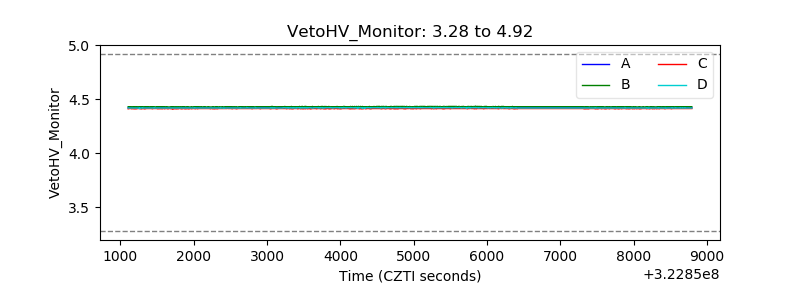 |
| Veto LLD | 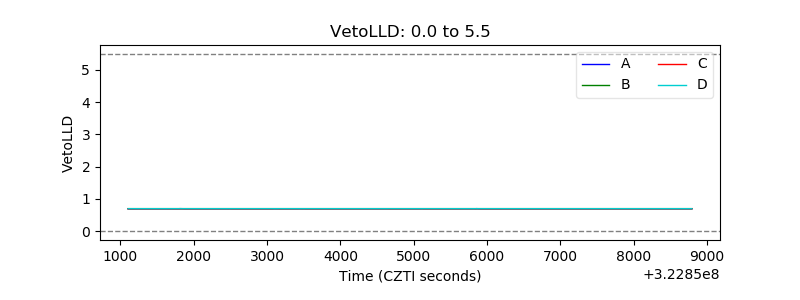 |
| Alpha Counter | 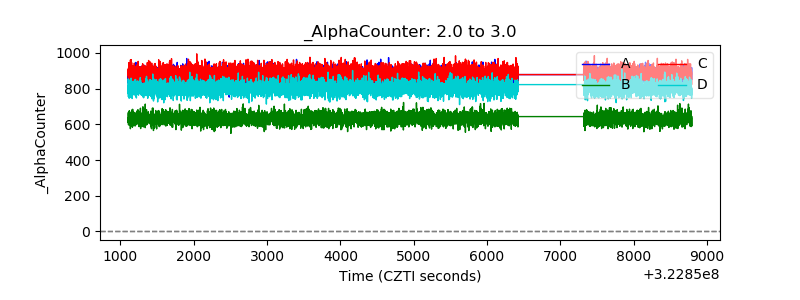 |
| _CPM_Rate | 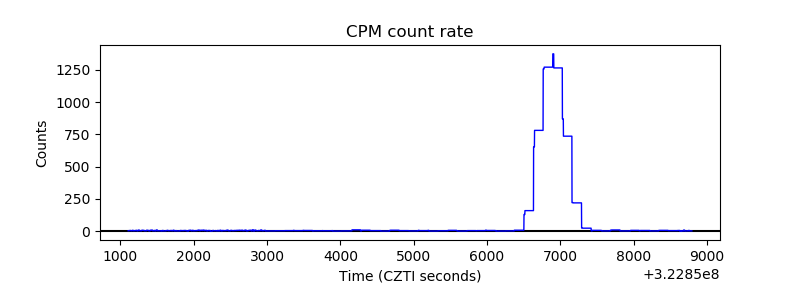 |
| CZT Counter | 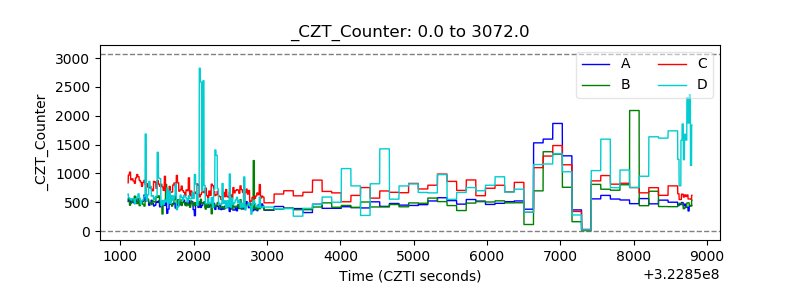 |
| +2.5 Volts monitor |  |
| +5 Volts monitor |  |
| _ROLL_ROT | 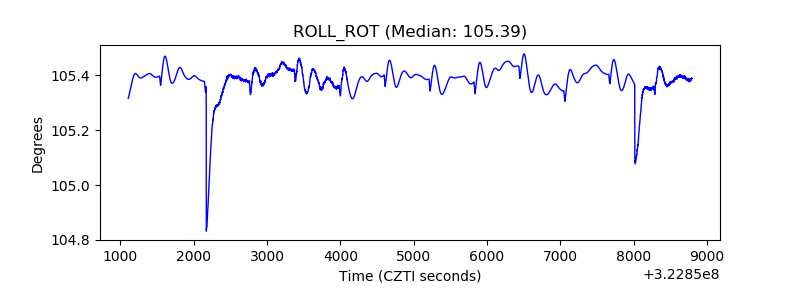 |
| _Roll_DEC | 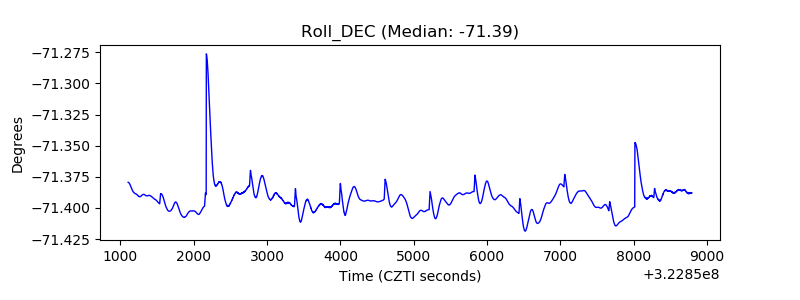 |
| _Roll_RA | 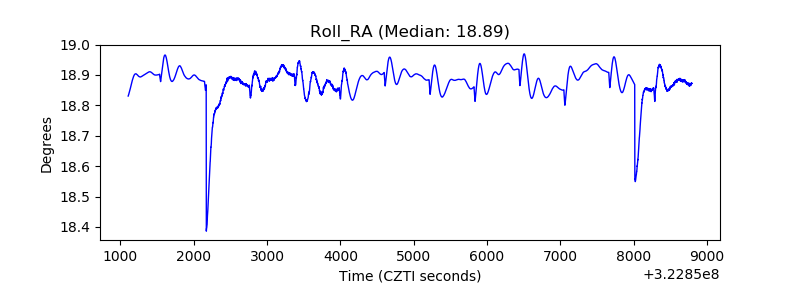 |
| Veto Counter | 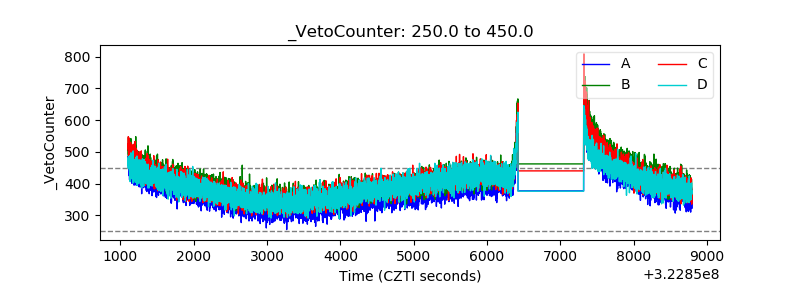 |