| Param | Original file | Final file |
|---|---|---|
| Filename | modeM0/AS1A07_047T08_9000003590_24284cztM0_level2.evt | modeM0/AS1A07_047T08_9000003590_24284cztM0_level2_quad_clean.evt |
| Size (bytes) | 589,040,640 | 120,084,480 |
| Size | 561.8 MB | 114.5 MB |
| Events in quadrant A | 2,910,601 | 837,828 |
| Events in quadrant B | 3,043,471 | 851,047 |
| Events in quadrant C | 4,383,298 | 784,824 |
| Events in quadrant D | 7,081,771 | 729,605 |
| Mode SS | |||
|---|---|---|---|
| Quadrant | BADHDUFLAG | Total packets | Discarded packets |
| A | 0 | 126 | 0 |
| B | 0 | 126 | 0 |
| C | 0 | 126 | 0 |
| D | 0 | 126 | 0 |
| Mode M9 | |||
|---|---|---|---|
| Quadrant | BADHDUFLAG | Total packets | Discarded packets |
| A | 0 | 11 | 0 |
| B | 0 | 11 | 0 |
| C | 0 | 11 | 0 |
| D | 0 | 11 | 0 |
| Mode M0 | |||
|---|---|---|---|
| Quadrant | BADHDUFLAG | Total packets | Discarded packets |
| A | 0 | 12713 | 1 |
| B | 0 | 13066 | 1 |
| C | 0 | 17757 | 1 |
| D | 0 | 25464 | 1 |
| Quadrant | Total seconds | Saturated seconds | Saturation percentage |
|---|---|---|---|
| A | 6211 | 28 | 0.450813% |
| B | 6211 | 38 | 0.611818% |
| C | 6211 | 100 | 1.610047% |
| D | 6211 | 727 | 11.705039% |
Noise dominated data is calculated using 1-second bins in cleaned event files. If a bin has >2000 counts, and if more than 50% of those come from <1% of pixels, then it is considered to be noise-dominated and hence unusable.
| Quadrant | # 1 sec bins | Bins with >0 counts | Bins with >2000 counts | High rate bins dominated by noise | Noise dominated (total time) | Noise dominated (detector-on time) | Marked lightcurve |
|---|---|---|---|---|---|---|---|
| A | 7291 | 6211 | 0 | 0 | 0.00% | 0.00% | 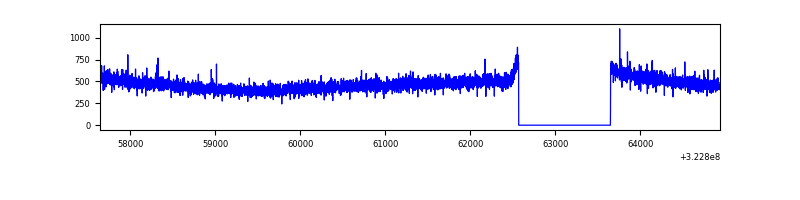 |
| B | 7291 | 6211 | 2 | 2 | 0.03% | 0.03% | 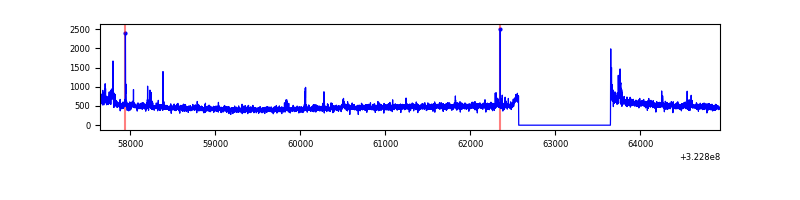 |
| C | 7291 | 6211 | 1 | 1 | 0.01% | 0.02% | 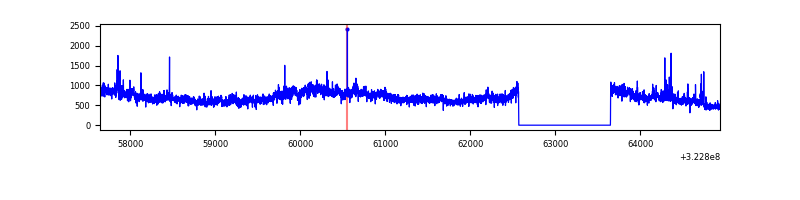 |
| D | 7290 | 6210 | 680 | 680 | 9.33% | 10.95% | 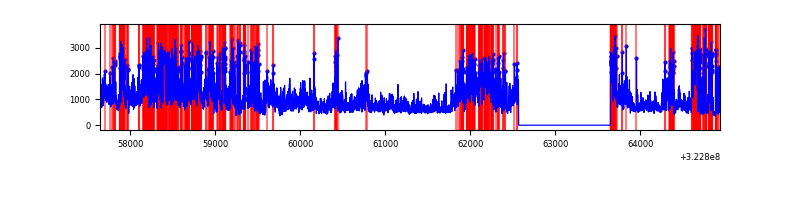 |
Top three noisy pixels from each quadrant. If the there are fewer than three noisy pixels in the level2.evt file, extra rows are filled as -1
| Pixel properties | Quadrant properties | ||||||
|---|---|---|---|---|---|---|---|
| Quadrant | DetID | PixID | Counts | Sigma | Mean | Median | Sigma |
| A | 13 | 254 | 10721 | 65.8 | 754 | 739 | 151.7 |
| A | 3 | 137 | 6668 | 39.08 | 754 | 739 | 151.7 |
| A | 0 | 226 | 6573 | 38.46 | 754 | 739 | 151.7 |
| B | 15 | 33 | 60461 | 424.72 | 751 | 734 | 140.6 |
| B | 0 | 230 | 19815 | 135.68 | 751 | 734 | 140.6 |
| B | 12 | 111 | 16739 | 113.81 | 751 | 734 | 140.6 |
| C | 7 | 247 | 1393338 | 8490.05 | 711 | 714 | 164.0 |
| C | 14 | 238 | 115715 | 701.1 | 711 | 714 | 164.0 |
| C | 2 | 16 | 85910 | 519.39 | 711 | 714 | 164.0 |
| D | 1 | 52 | 1984481 | 11946.04 | 692 | 672 | 166.1 |
| D | 8 | 195 | 1816086 | 10932.0 | 692 | 672 | 166.1 |
| D | 12 | 233 | 495548 | 2980.03 | 692 | 672 | 166.1 |
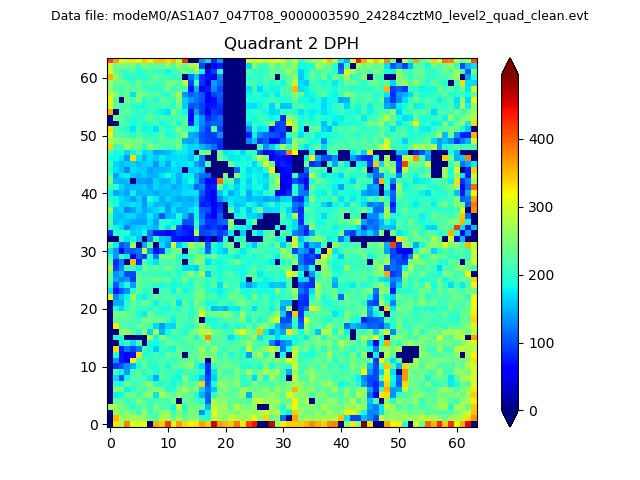
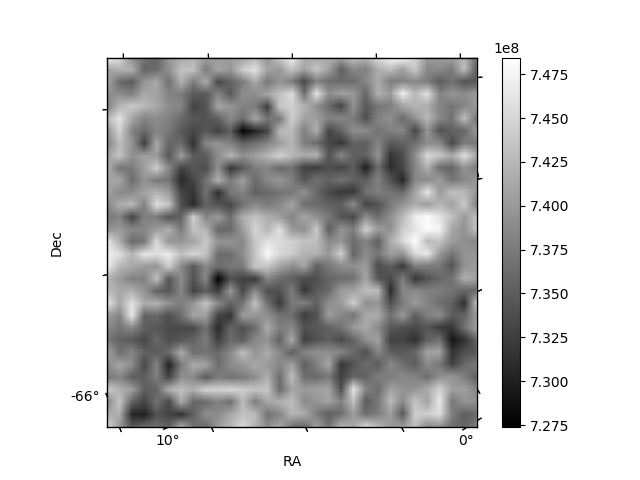
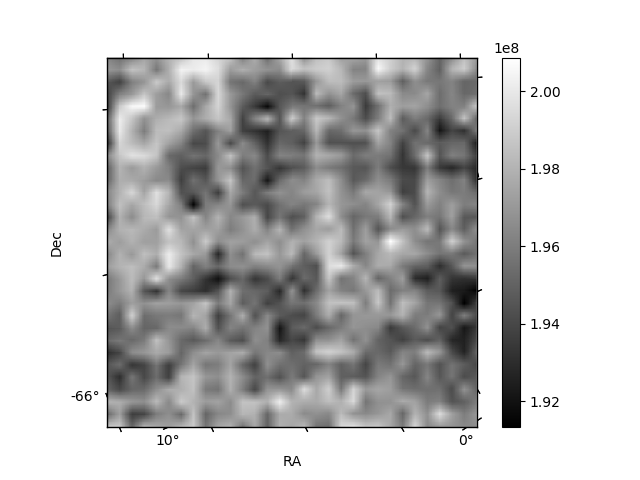
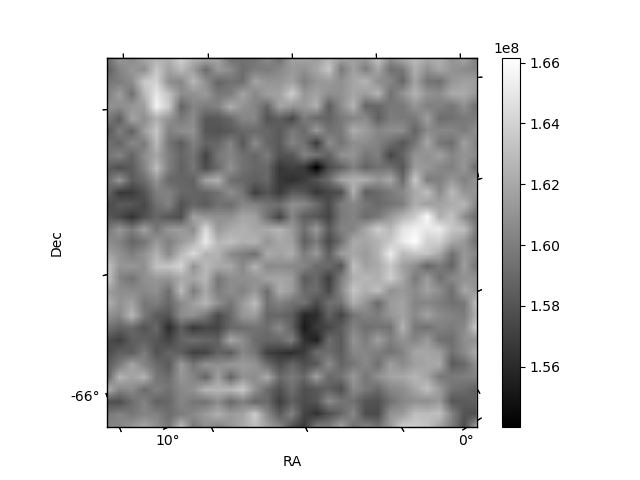
Histogram calculated using DETX and DETY for each event in the final _common_clean file
| Quadrant A | 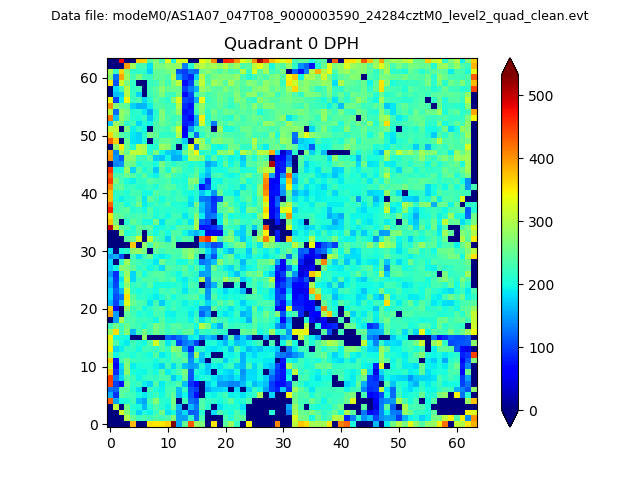 |
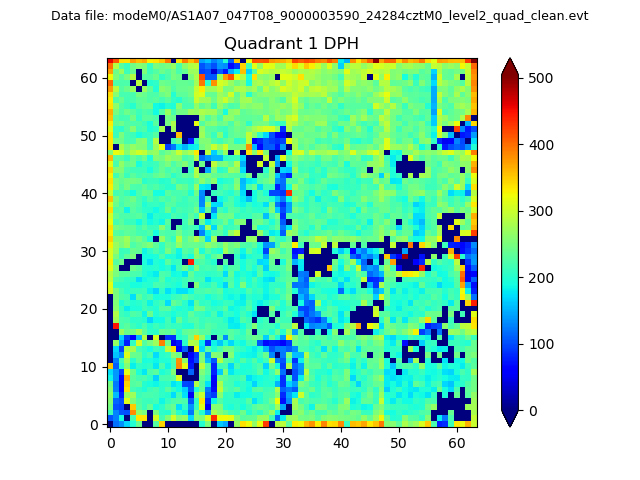 |
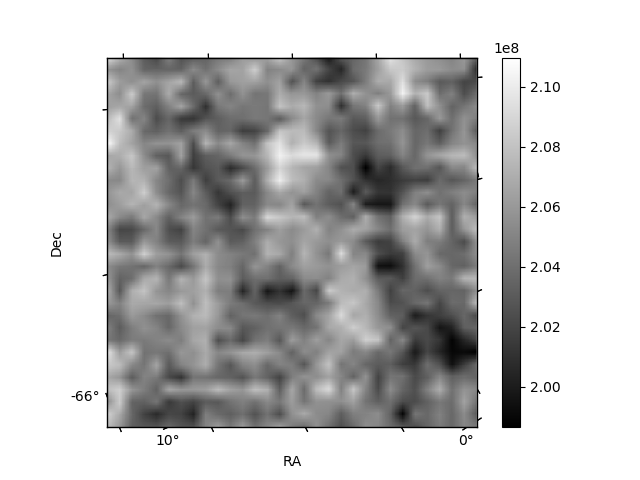
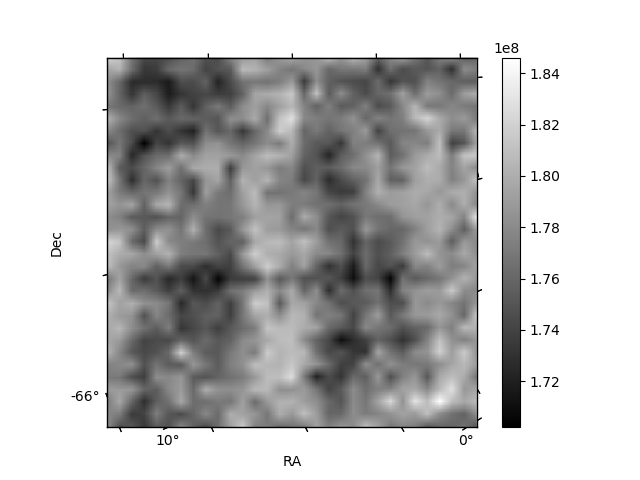
Quadrant B |
|---|---|---|---|
| Quadrant D | 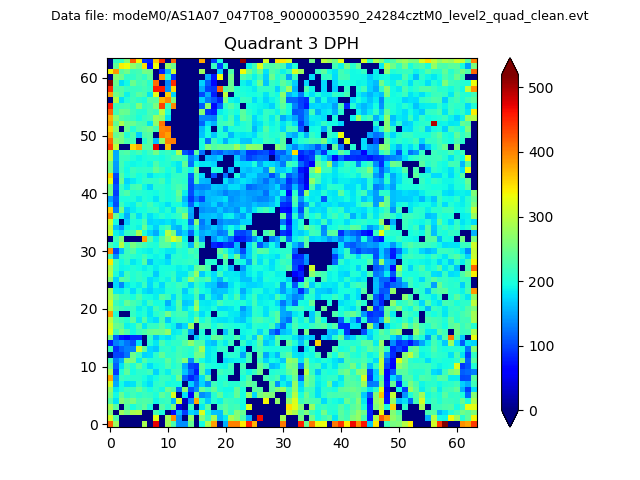 |
 |
Quadrant C |
| Plot type | Count rate plots | Images |
|---|---|---|
| Comparison with Poisson distribution Blue bars denote a histogram of data divided into 1 sec bins. Red curve is a Poisson curve with rate = median count rate of data. |
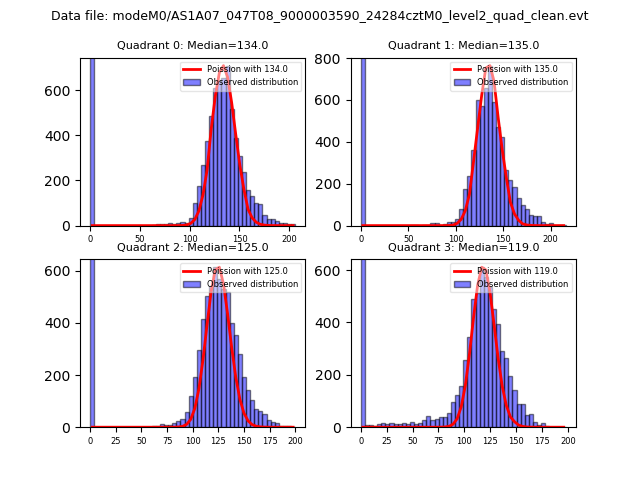 |
 |
| Quadrant-wise count rates Data is divided into 100 sec bins |
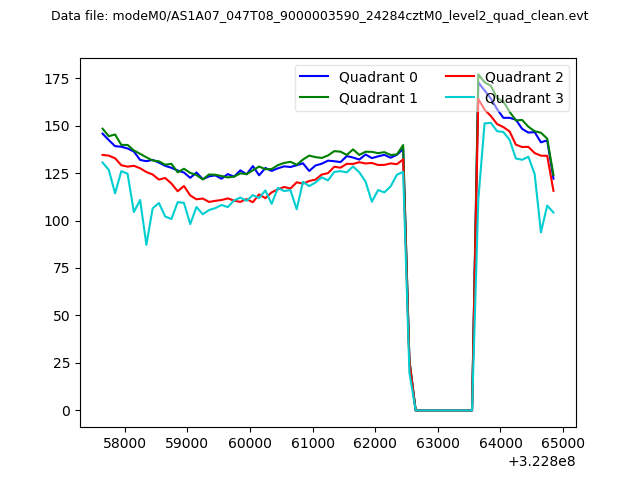 |
|
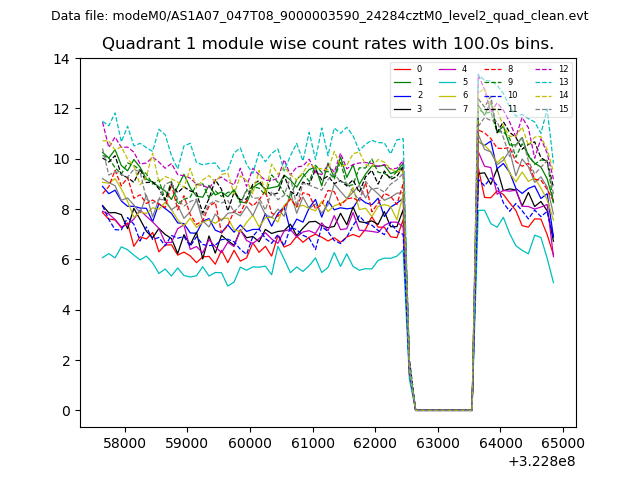
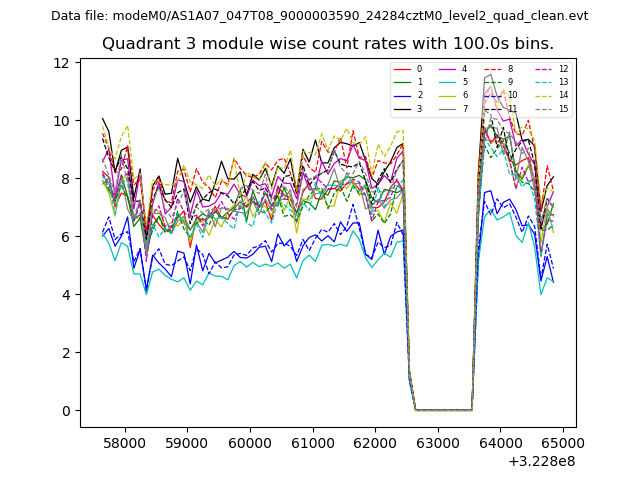
| Module-wise count rates for Quadrant A Data is divided into 100 sec bins |
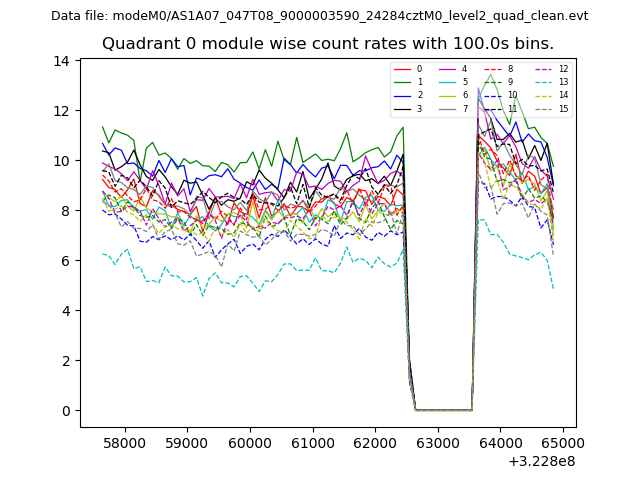 |
 |
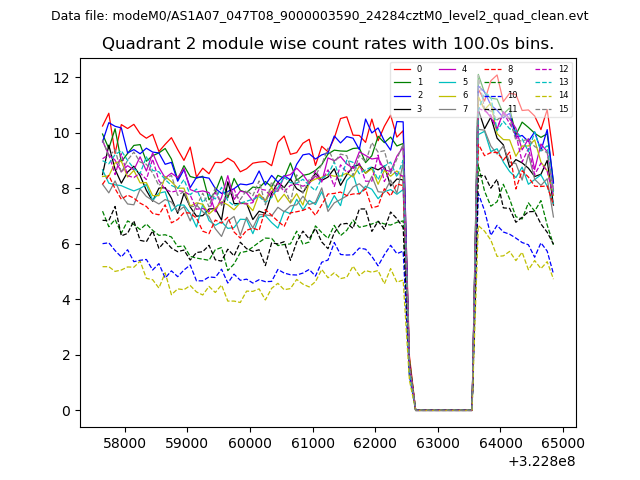
| Module-wise count rates for Quadrant B Data is divided into 100 sec bins |
 |
 |
| Module-wise count rates for Quadrant C Data is divided into 100 sec bins |
 |
 |
| Module-wise count rates for Quadrant D Data is divided into 100 sec bins |
 |
 |
| Parameter | Plot |
|---|---|
| CZT HV Monitor | 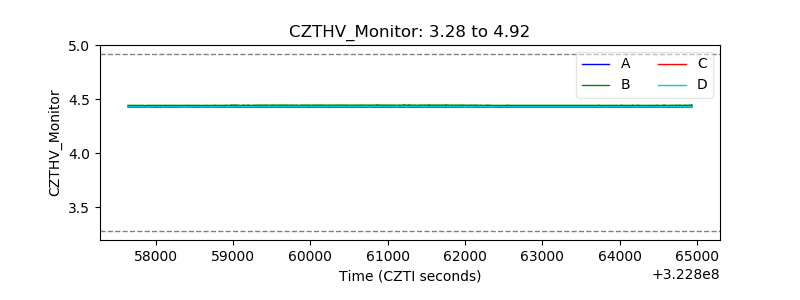 |
| D_VDD | 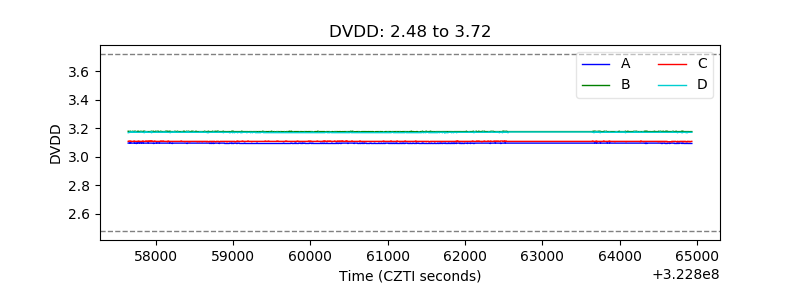 |
| Temperature 1 | 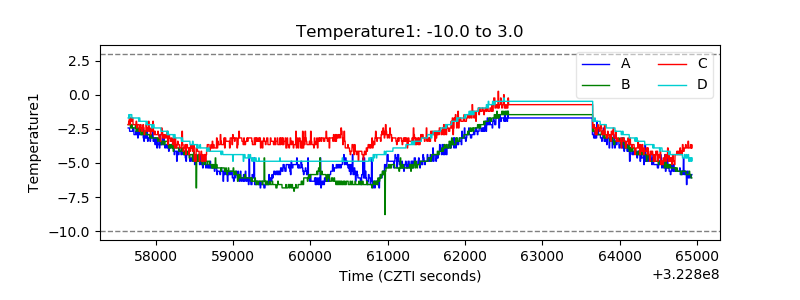 |
| Veto HV Monitor | 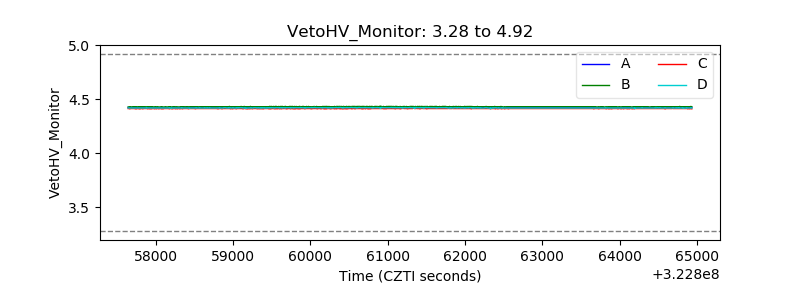 |
| Veto LLD |  |
| Alpha Counter | 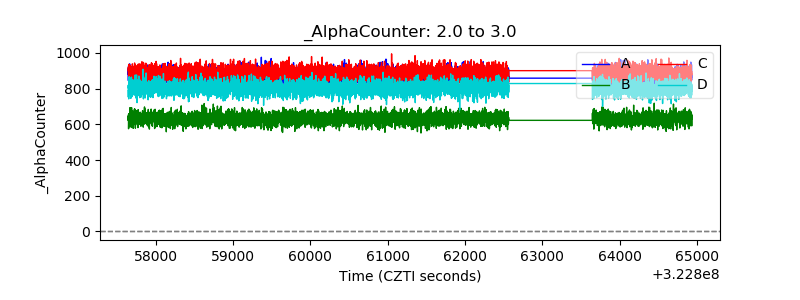 |
| _CPM_Rate | 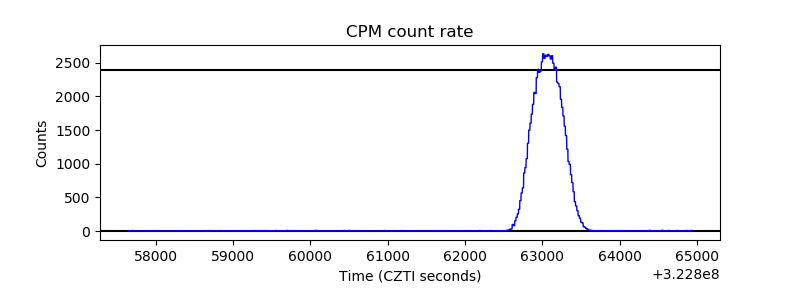 |
| CZT Counter | 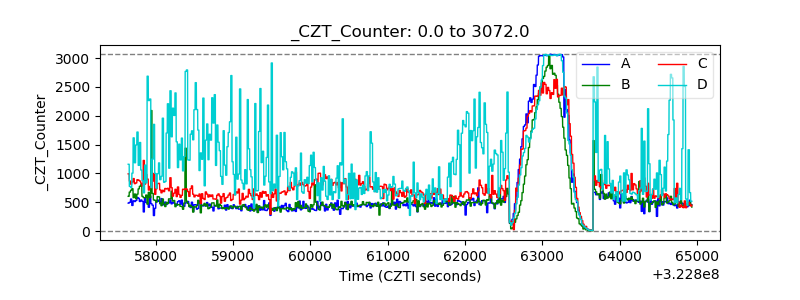 |
| +2.5 Volts monitor |  |
| +5 Volts monitor |  |
| _ROLL_ROT | 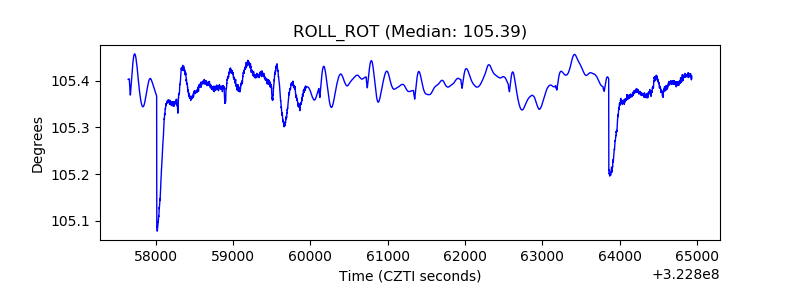 |
| _Roll_DEC | 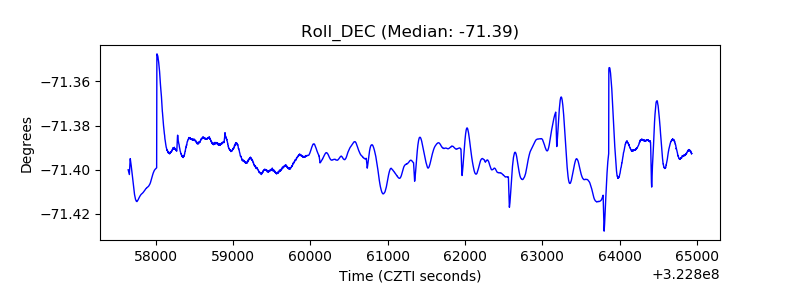 |
| _Roll_RA | 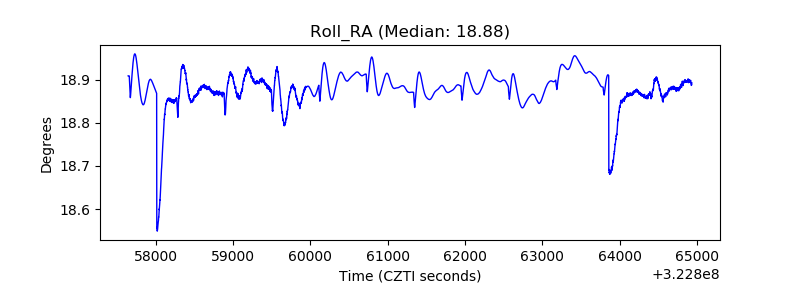 |
| Veto Counter | 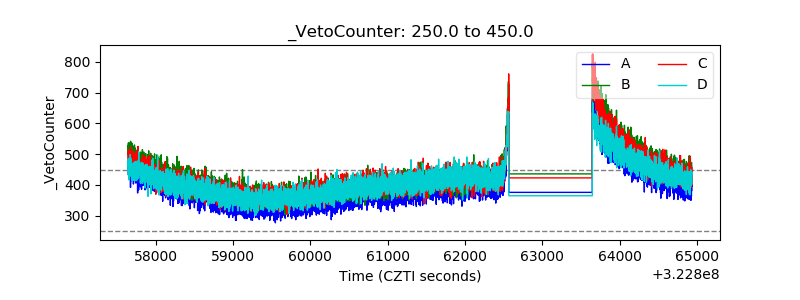 |