| Param | Original file | Final file |
|---|---|---|
| Filename | modeM0/AS1A07_047T08_9000003590_24286cztM0_level2.evt | modeM0/AS1A07_047T08_9000003590_24286cztM0_level2_quad_clean.evt |
| Size (bytes) | 552,700,800 | 129,968,640 |
| Size | 527.1 MB | 123.9 MB |
| Events in quadrant A | 3,076,572 | 912,710 |
| Events in quadrant B | 3,219,419 | 924,117 |
| Events in quadrant C | 3,532,796 | 865,051 |
| Events in quadrant D | 6,484,082 | 795,802 |
| Mode SS | |||
|---|---|---|---|
| Quadrant | BADHDUFLAG | Total packets | Discarded packets |
| A | 0 | 128 | 0 |
| B | 0 | 128 | 0 |
| C | 0 | 128 | 0 |
| D | 0 | 128 | 0 |
| Mode M9 | |||
|---|---|---|---|
| Quadrant | BADHDUFLAG | Total packets | Discarded packets |
| A | 0 | 15 | 0 |
| B | 0 | 16 | 0 |
| C | 0 | 16 | 0 |
| D | 0 | 16 | 0 |
| Mode M0 | |||
|---|---|---|---|
| Quadrant | BADHDUFLAG | Total packets | Discarded packets |
| A | 0 | 13169 | 2 |
| B | 0 | 13545 | 2 |
| C | 0 | 14695 | 2 |
| D | 0 | 23606 | 4 |
| Quadrant | Total seconds | Saturated seconds | Saturation percentage |
|---|---|---|---|
| A | 6284 | 23 | 0.366009% |
| B | 6284 | 82 | 1.304901% |
| C | 6284 | 78 | 1.241248% |
| D | 6283 | 683 | 10.870603% |
Noise dominated data is calculated using 1-second bins in cleaned event files. If a bin has >2000 counts, and if more than 50% of those come from <1% of pixels, then it is considered to be noise-dominated and hence unusable.
| Quadrant | # 1 sec bins | Bins with >0 counts | Bins with >2000 counts | High rate bins dominated by noise | Noise dominated (total time) | Noise dominated (detector-on time) | Marked lightcurve |
|---|---|---|---|---|---|---|---|
| A | 7464 | 6284 | 0 | 0 | 0.00% | 0.00% | 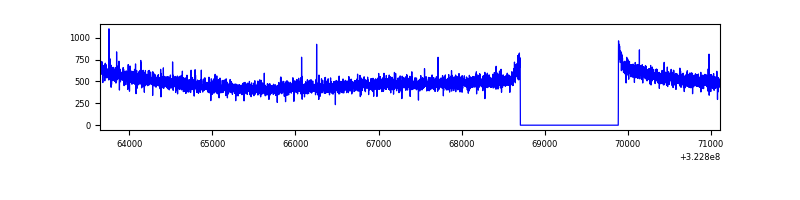 |
| B | 7464 | 6284 | 20 | 20 | 0.27% | 0.32% | 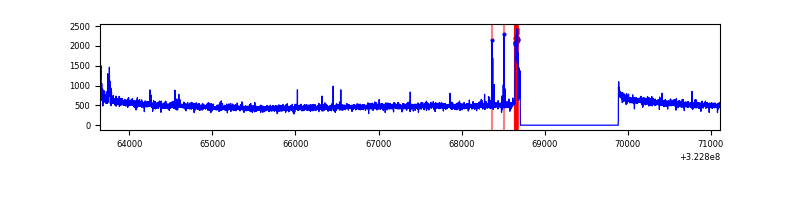 |
| C | 7464 | 6284 | 2 | 2 | 0.03% | 0.03% | 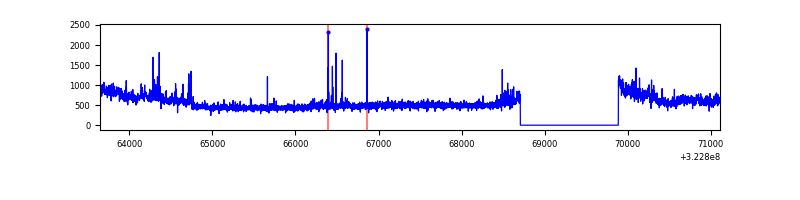 |
| D | 7463 | 6283 | 615 | 615 | 8.24% | 9.79% | 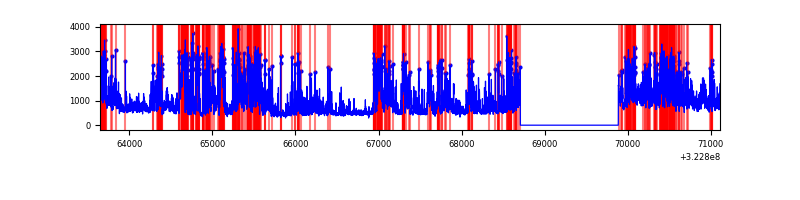 |
Top three noisy pixels from each quadrant. If the there are fewer than three noisy pixels in the level2.evt file, extra rows are filled as -1
| Pixel properties | Quadrant properties | ||||||
|---|---|---|---|---|---|---|---|
| Quadrant | DetID | PixID | Counts | Sigma | Mean | Median | Sigma |
| A | 13 | 254 | 10133 | 58.7 | 798 | 785 | 159.2 |
| A | 3 | 137 | 6916 | 38.5 | 798 | 785 | 159.2 |
| A | 0 | 226 | 6746 | 37.43 | 798 | 785 | 159.2 |
| B | 12 | 17 | 70310 | 476.92 | 795 | 778 | 145.8 |
| B | 15 | 33 | 29854 | 199.43 | 795 | 778 | 145.8 |
| B | 12 | 111 | 17373 | 113.82 | 795 | 778 | 145.8 |
| C | 7 | 247 | 335697 | 1926.97 | 758 | 763 | 173.8 |
| C | 14 | 238 | 124514 | 711.98 | 758 | 763 | 173.8 |
| C | 2 | 16 | 113944 | 651.16 | 758 | 763 | 173.8 |
| D | 1 | 52 | 2316074 | 13132.03 | 734 | 712 | 176.3 |
| D | 8 | 195 | 1070238 | 6066.03 | 734 | 712 | 176.3 |
| D | 1 | 239 | 121687 | 686.13 | 734 | 712 | 176.3 |
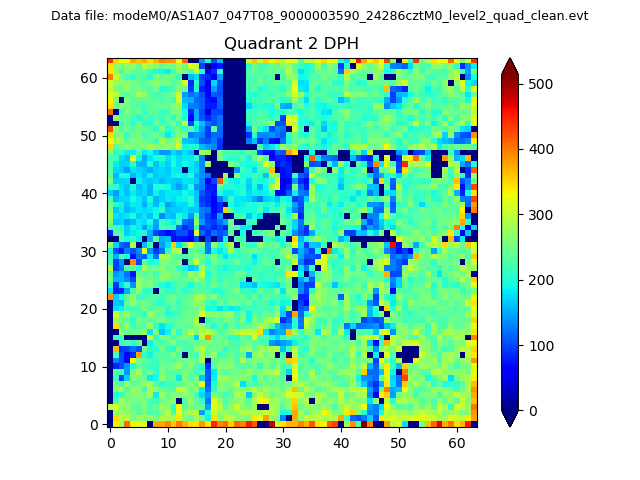
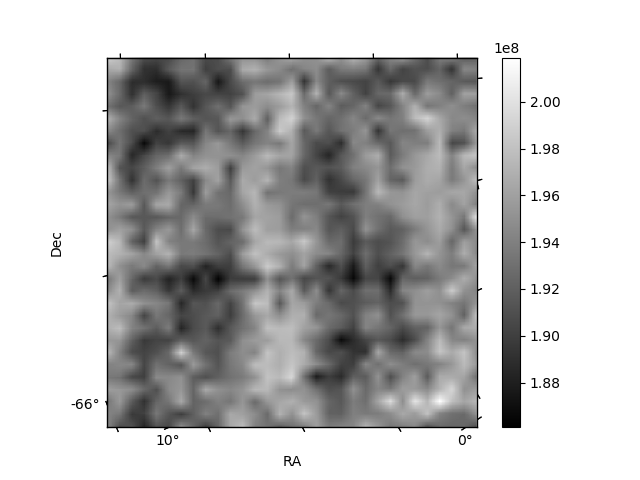
Histogram calculated using DETX and DETY for each event in the final _common_clean file
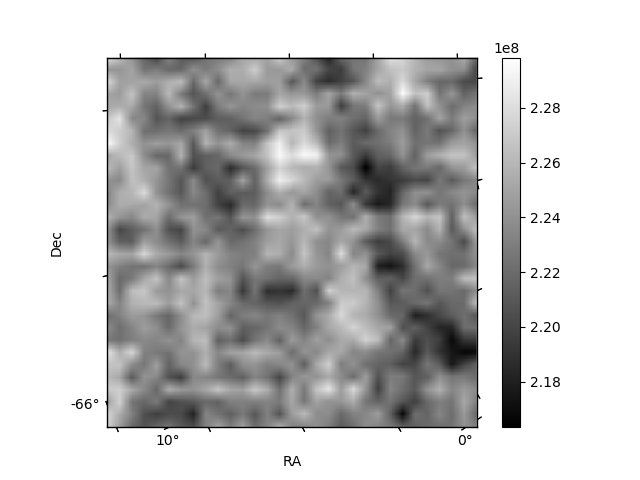
| Quadrant A | 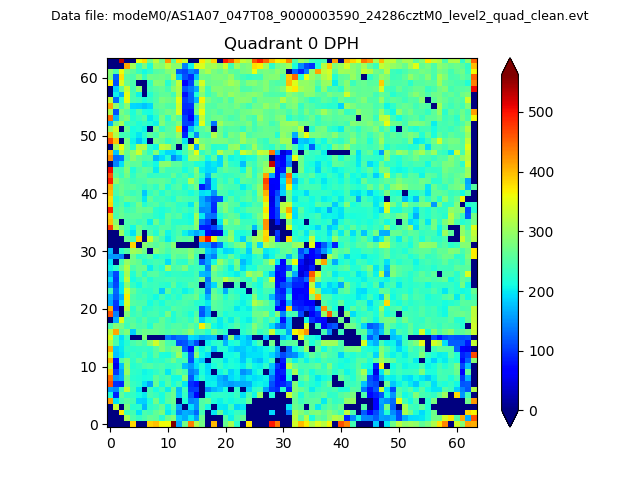 |
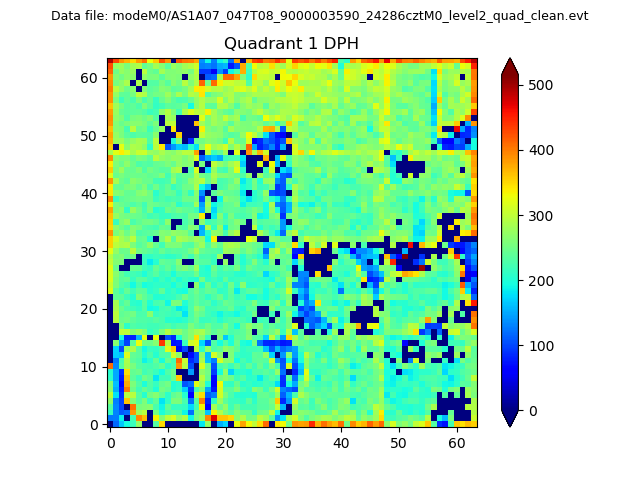 |
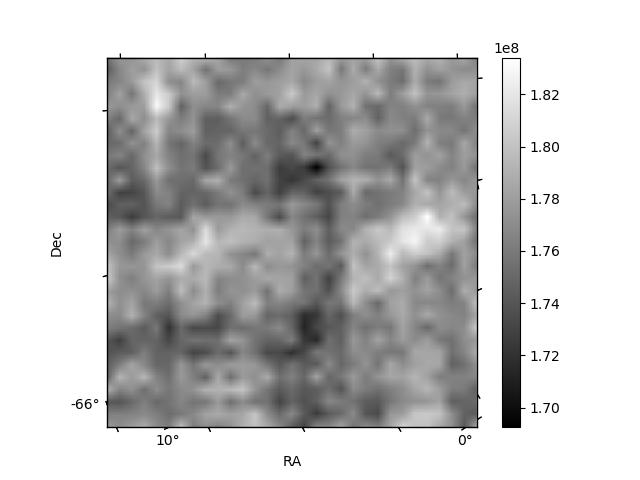
Quadrant B |
|---|---|---|---|
| Quadrant D | 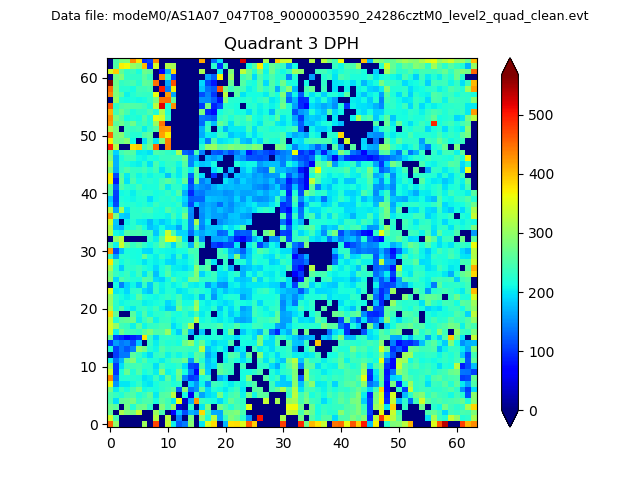 |
 |
Quadrant C |
| Plot type | Count rate plots | Images |
|---|---|---|
| Comparison with Poisson distribution Blue bars denote a histogram of data divided into 1 sec bins. Red curve is a Poisson curve with rate = median count rate of data. |
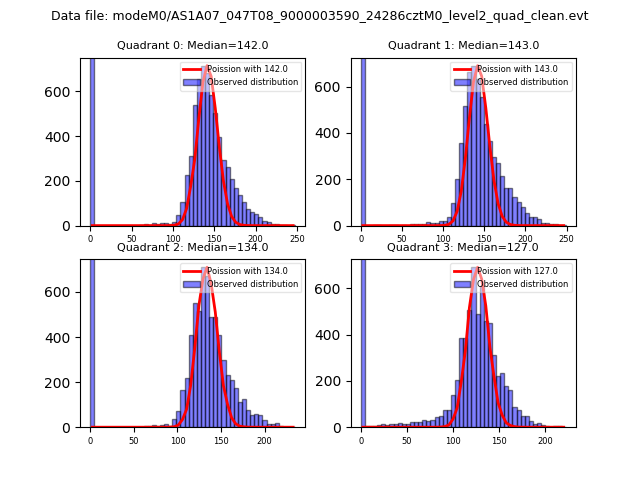 |
 |
| Quadrant-wise count rates Data is divided into 100 sec bins |
 |
|
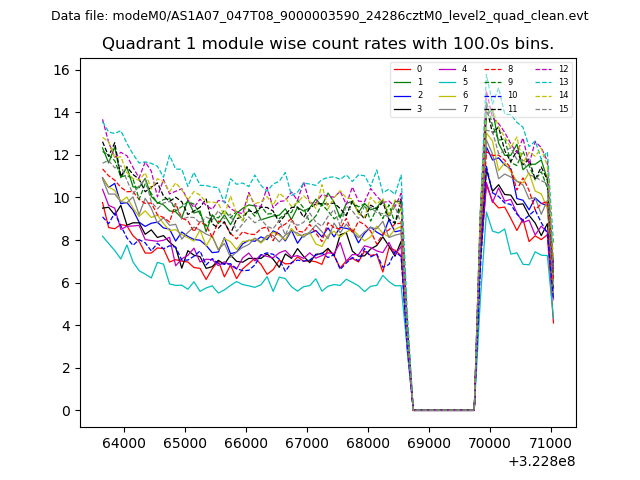
| Module-wise count rates for Quadrant A Data is divided into 100 sec bins |
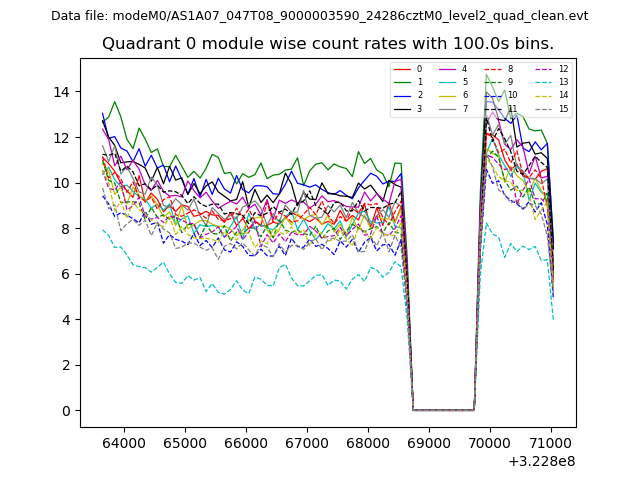 |
 |
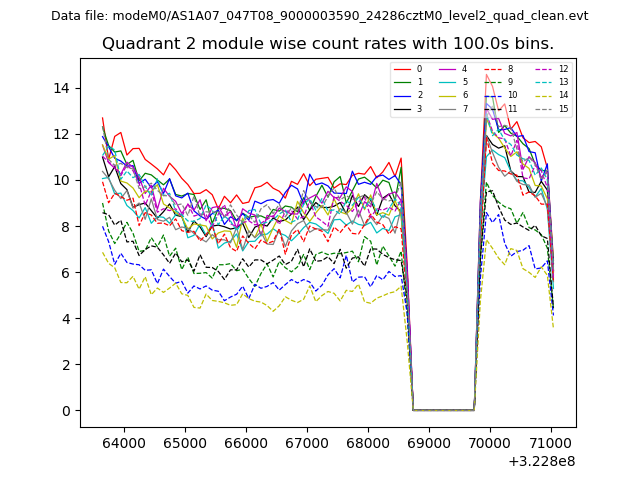
| Module-wise count rates for Quadrant B Data is divided into 100 sec bins |
 |
 |
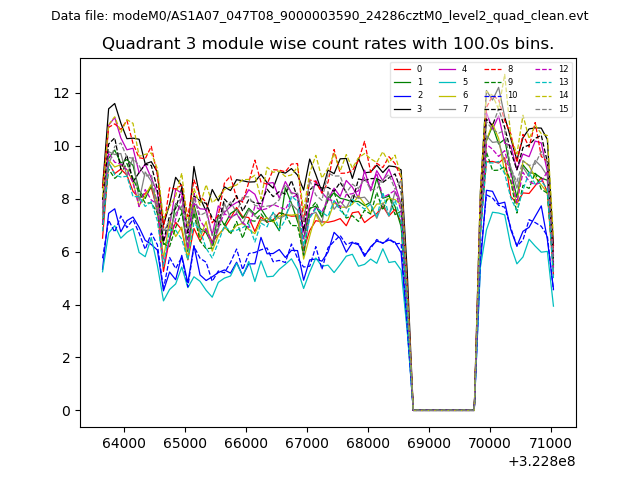
| Module-wise count rates for Quadrant C Data is divided into 100 sec bins |
 |
 |
| Module-wise count rates for Quadrant D Data is divided into 100 sec bins |
 |
 |
| Parameter | Plot |
|---|---|
| CZT HV Monitor | 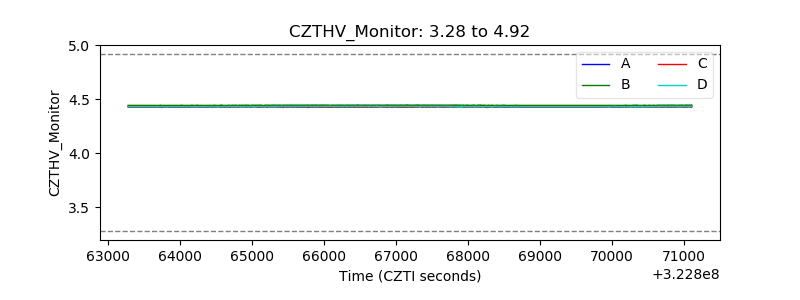 |
| D_VDD | 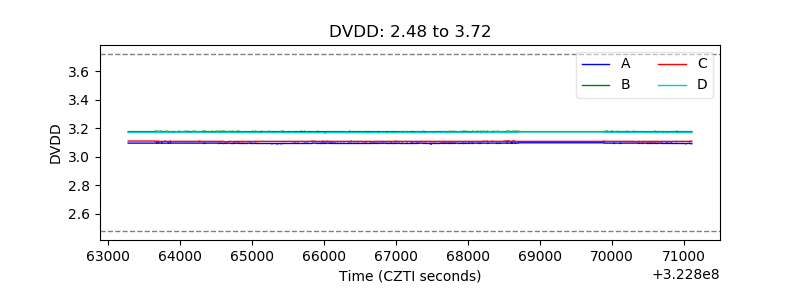 |
| Temperature 1 | 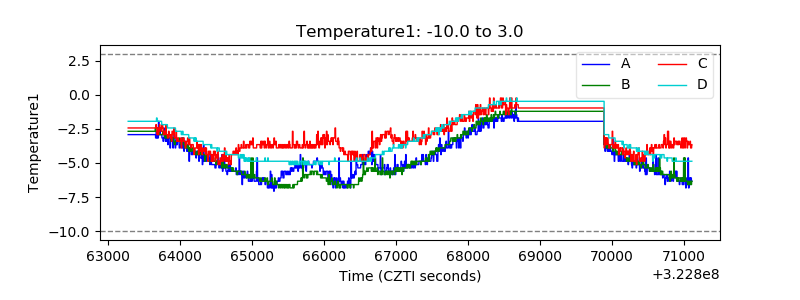 |
| Veto HV Monitor |  |
| Veto LLD |  |
| Alpha Counter | 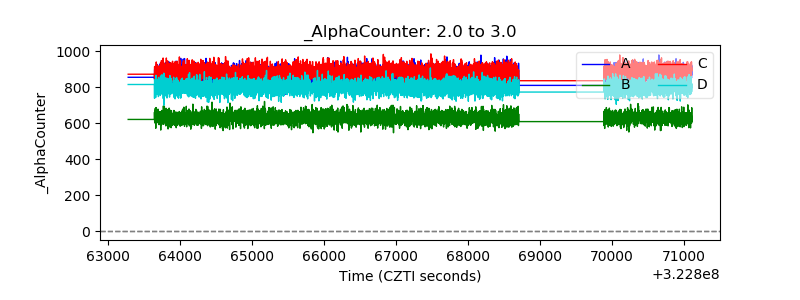 |
| _CPM_Rate | 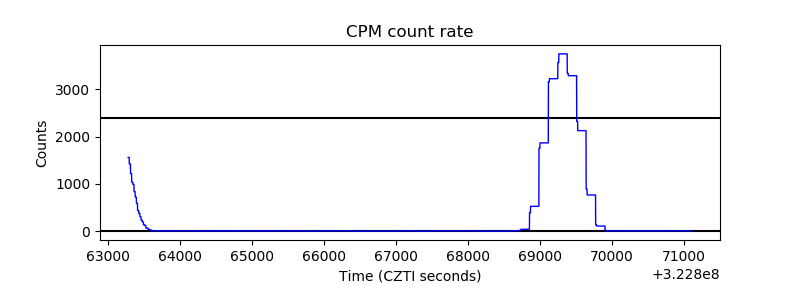 |
| CZT Counter | 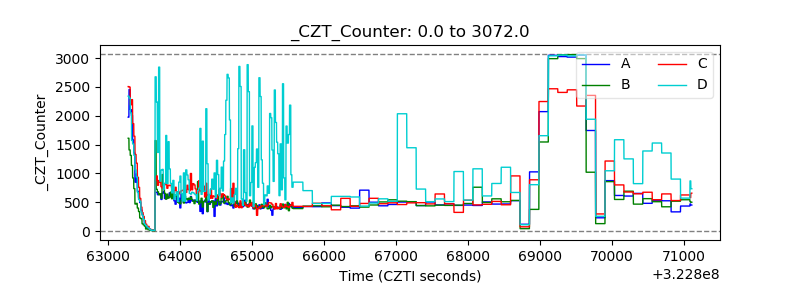 |
| +2.5 Volts monitor |  |
| +5 Volts monitor | 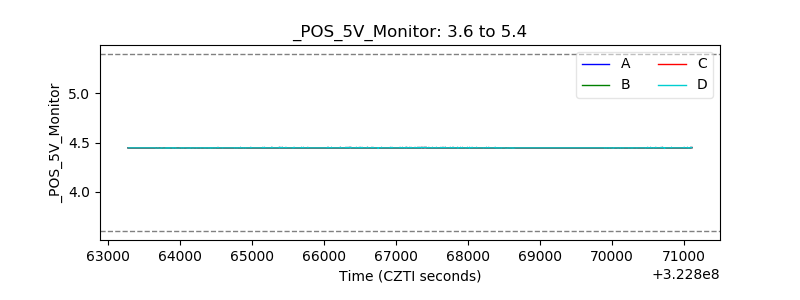 |
| _ROLL_ROT | 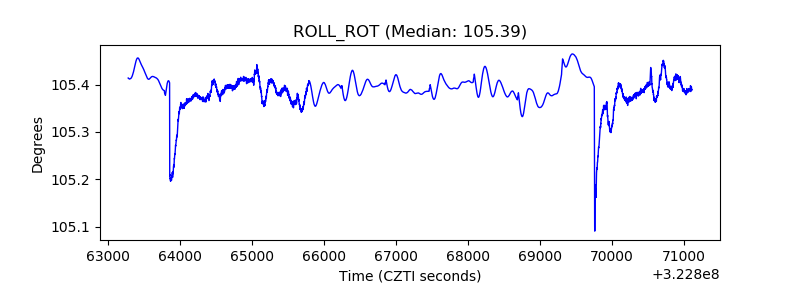 |
| _Roll_DEC |  |
| _Roll_RA | 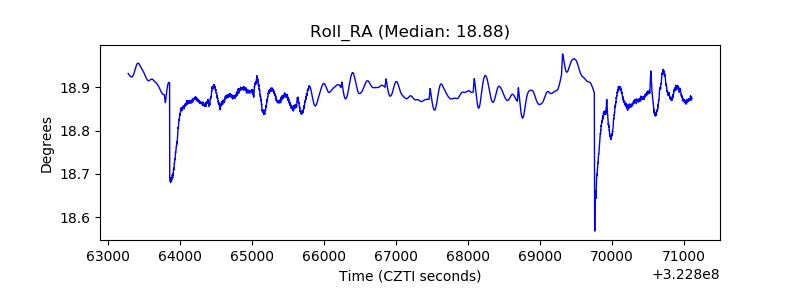 |
| Veto Counter |  |