| Param | Original file | Final file |
|---|---|---|
| Filename | modeM0/AS1A07_047T08_9000003590_24287cztM0_level2.evt | modeM0/AS1A07_047T08_9000003590_24287cztM0_level2_quad_clean.evt |
| Size (bytes) | 554,267,520 | 136,117,440 |
| Size | 528.6 MB | 129.8 MB |
| Events in quadrant A | 3,132,637 | 948,515 |
| Events in quadrant B | 3,188,181 | 973,902 |
| Events in quadrant C | 3,610,594 | 916,380 |
| Events in quadrant D | 6,440,026 | 856,177 |
| Mode SS | |||
|---|---|---|---|
| Quadrant | BADHDUFLAG | Total packets | Discarded packets |
| A | 0 | 124 | 0 |
| B | 0 | 124 | 0 |
| C | 0 | 124 | 0 |
| D | 0 | 124 | 0 |
| Mode M9 | |||
|---|---|---|---|
| Quadrant | BADHDUFLAG | Total packets | Discarded packets |
| A | 0 | 23 | 0 |
| B | 0 | 24 | 0 |
| C | 0 | 24 | 0 |
| D | 0 | 24 | 0 |
| Mode M0 | |||
|---|---|---|---|
| Quadrant | BADHDUFLAG | Total packets | Discarded packets |
| A | 0 | 13073 | 2 |
| B | 0 | 13269 | 2 |
| C | 0 | 14651 | 2 |
| D | 0 | 23475 | 2 |
| Quadrant | Total seconds | Saturated seconds | Saturation percentage |
|---|---|---|---|
| A | 6130 | 14 | 0.228385% |
| B | 6130 | 37 | 0.603589% |
| C | 6130 | 83 | 1.353997% |
| D | 6130 | 415 | 6.769984% |
Noise dominated data is calculated using 1-second bins in cleaned event files. If a bin has >2000 counts, and if more than 50% of those come from <1% of pixels, then it is considered to be noise-dominated and hence unusable.
| Quadrant | # 1 sec bins | Bins with >0 counts | Bins with >2000 counts | High rate bins dominated by noise | Noise dominated (total time) | Noise dominated (detector-on time) | Marked lightcurve |
|---|---|---|---|---|---|---|---|
| A | 7425 | 6131 | 0 | 0 | 0.00% | 0.00% |  |
| B | 7425 | 6131 | 2 | 2 | 0.03% | 0.03% |  |
| C | 7425 | 6130 | 2 | 2 | 0.03% | 0.03% |  |
| D | 7425 | 6130 | 336 | 336 | 4.53% | 5.48% |  |
Top three noisy pixels from each quadrant. If the there are fewer than three noisy pixels in the level2.evt file, extra rows are filled as -1
| Pixel properties | Quadrant properties | ||||||
|---|---|---|---|---|---|---|---|
| Quadrant | DetID | PixID | Counts | Sigma | Mean | Median | Sigma |
| A | 13 | 254 | 10220 | 59.02 | 811 | 799 | 159.6 |
| A | 0 | 226 | 6843 | 37.86 | 811 | 799 | 159.6 |
| A | 3 | 137 | 6494 | 35.68 | 811 | 799 | 159.6 |
| B | 12 | 111 | 17062 | 109.51 | 813 | 797 | 148.5 |
| B | 11 | 111 | 15082 | 96.18 | 813 | 797 | 148.5 |
| B | 14 | 111 | 13478 | 85.38 | 813 | 797 | 148.5 |
| C | 7 | 247 | 364410 | 2039.62 | 782 | 787 | 178.3 |
| C | 14 | 238 | 128301 | 715.25 | 782 | 787 | 178.3 |
| C | 2 | 16 | 67893 | 376.41 | 782 | 787 | 178.3 |
| D | 8 | 195 | 2297876 | 12632.99 | 768 | 747 | 181.8 |
| D | 1 | 52 | 1167281 | 6415.32 | 768 | 747 | 181.8 |
| D | 12 | 233 | 31429 | 168.73 | 768 | 747 | 181.8 |
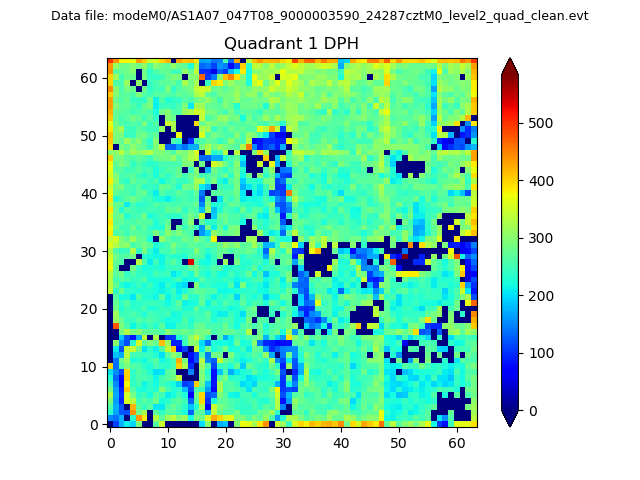
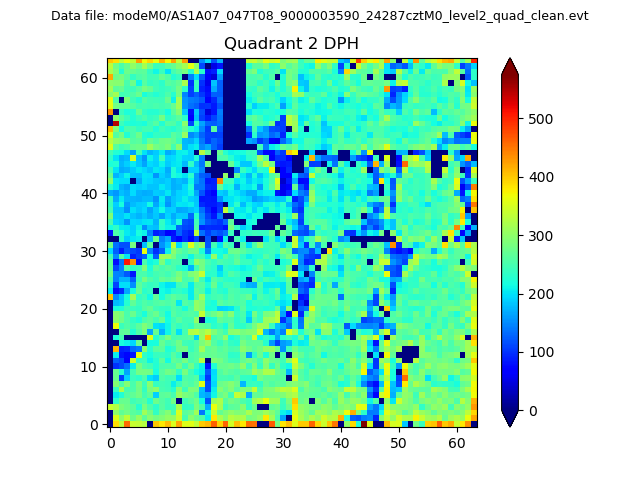
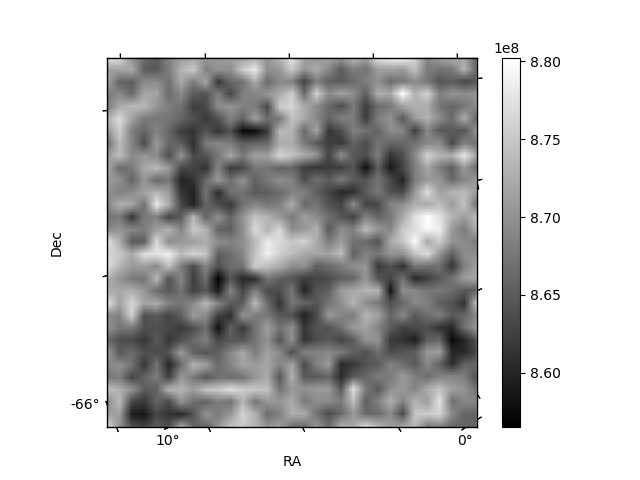
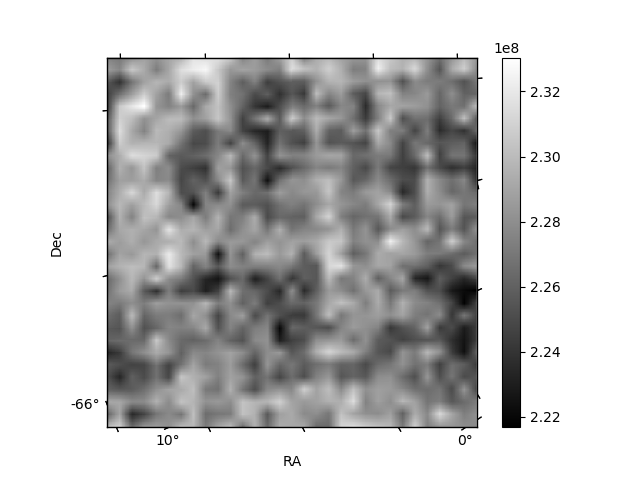
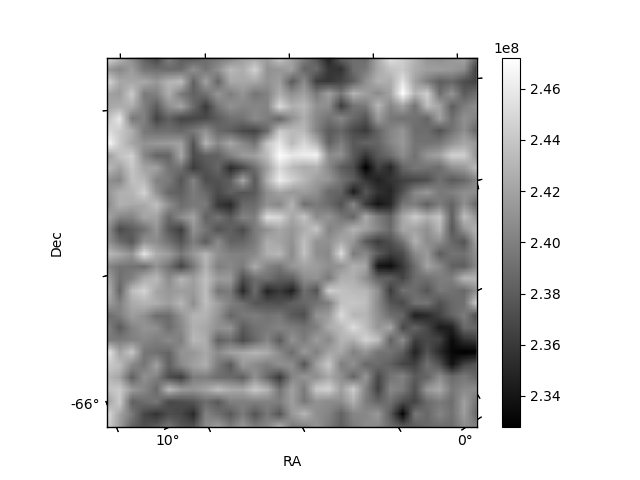
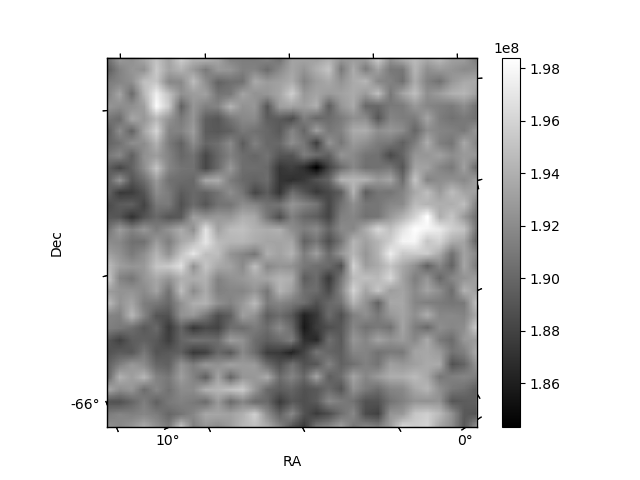
Histogram calculated using DETX and DETY for each event in the final _common_clean file
| Quadrant A | 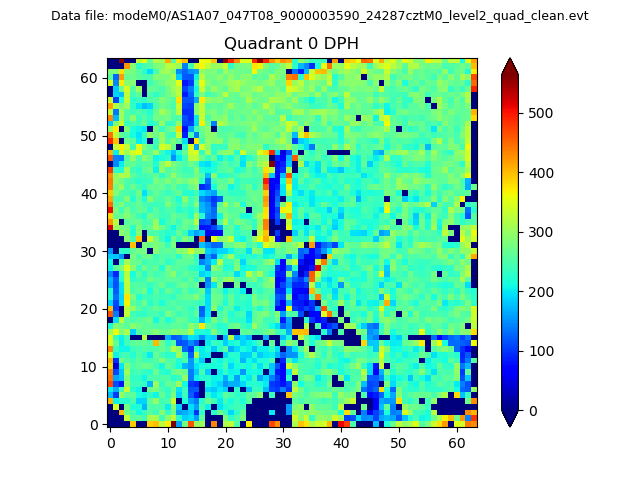 |
 |
Quadrant B |
|---|---|---|---|
| Quadrant D | 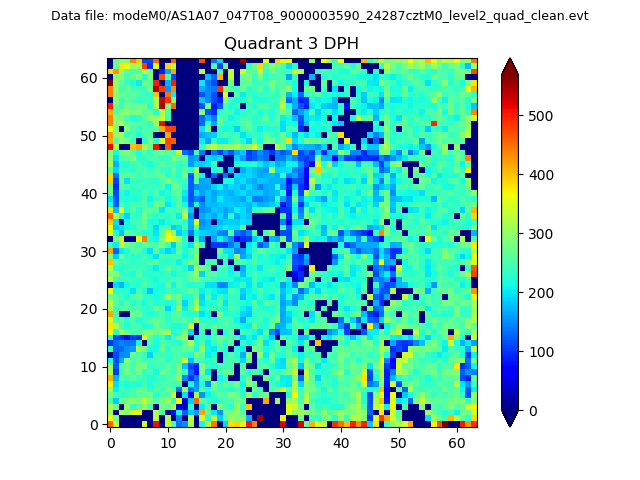 |
 |
Quadrant C |
| Plot type | Count rate plots | Images |
|---|---|---|
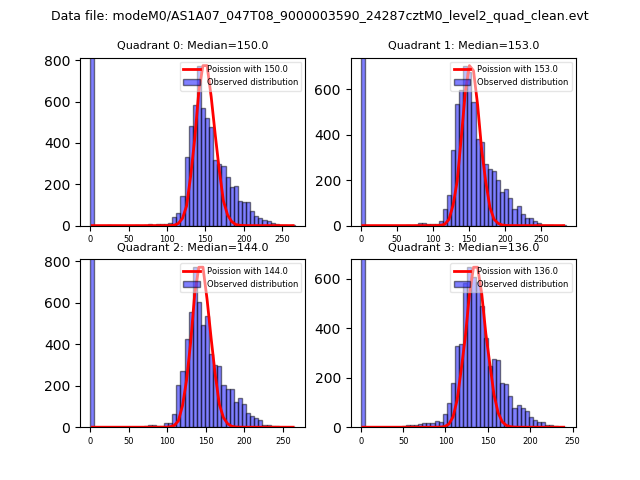
| Comparison with Poisson distribution Blue bars denote a histogram of data divided into 1 sec bins. Red curve is a Poisson curve with rate = median count rate of data. |
 |
 |
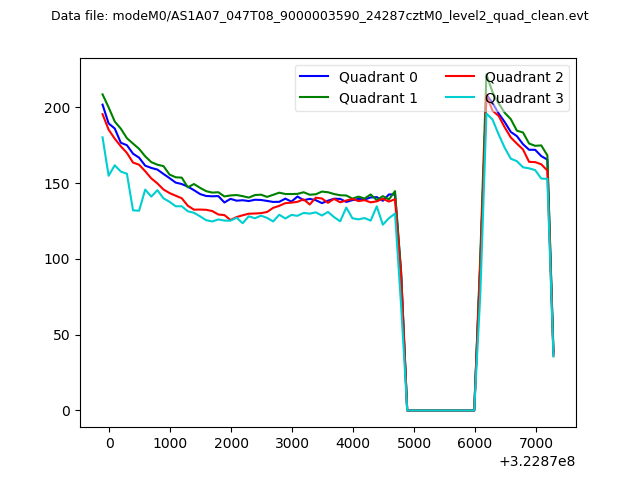
| Quadrant-wise count rates Data is divided into 100 sec bins |
 |
|
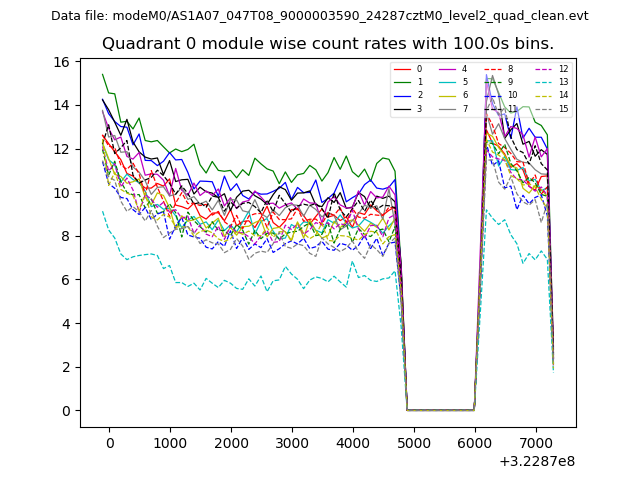
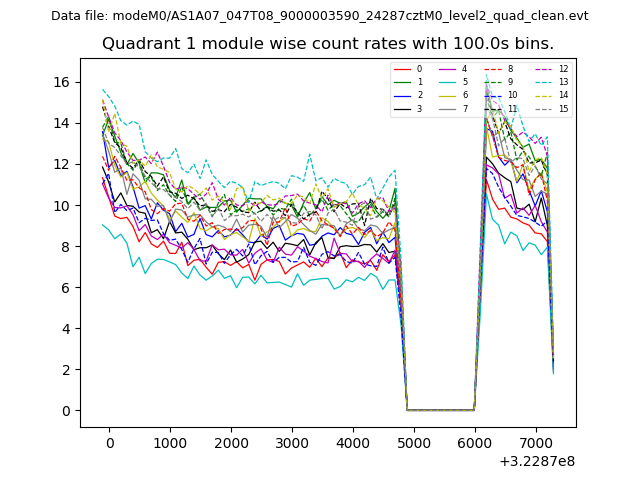
| Module-wise count rates for Quadrant A Data is divided into 100 sec bins |
 |
 |
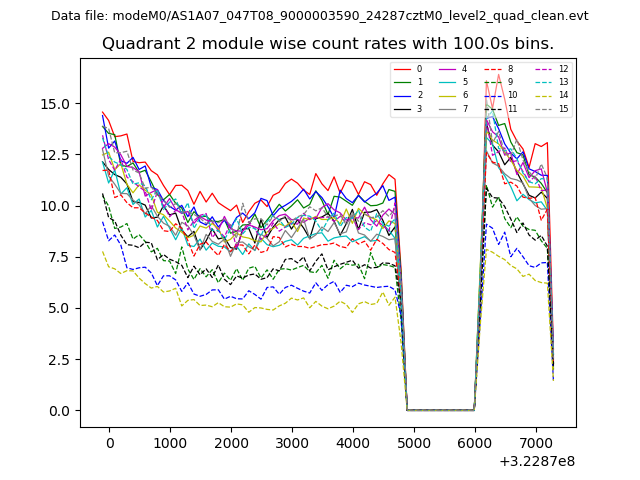
| Module-wise count rates for Quadrant B Data is divided into 100 sec bins |
 |
 |
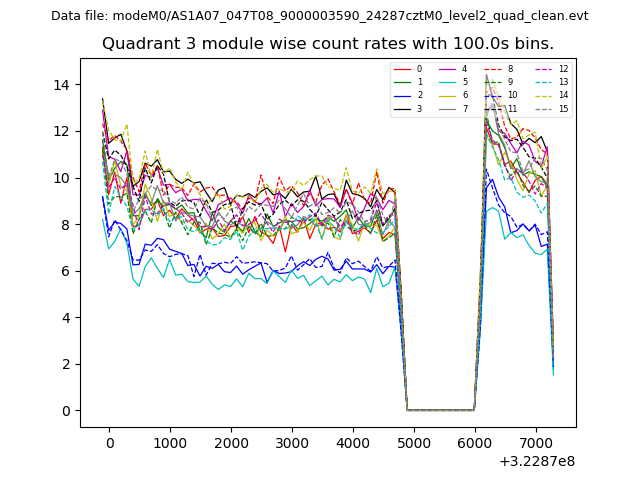
| Module-wise count rates for Quadrant C Data is divided into 100 sec bins |
 |
 |
| Module-wise count rates for Quadrant D Data is divided into 100 sec bins |
 |
 |
| Parameter | Plot |
|---|---|
| CZT HV Monitor | 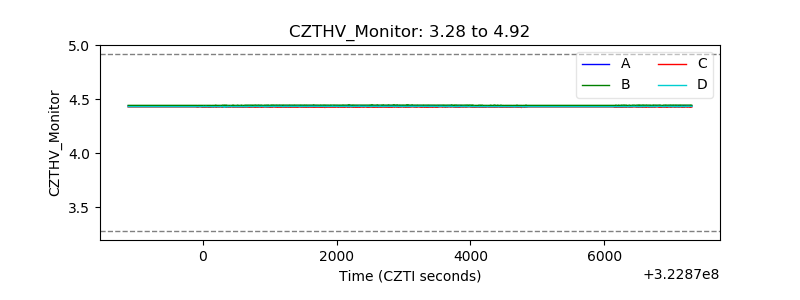 |
| D_VDD | 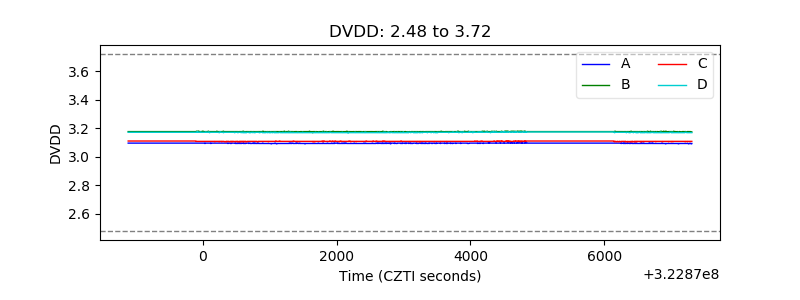 |
| Temperature 1 | 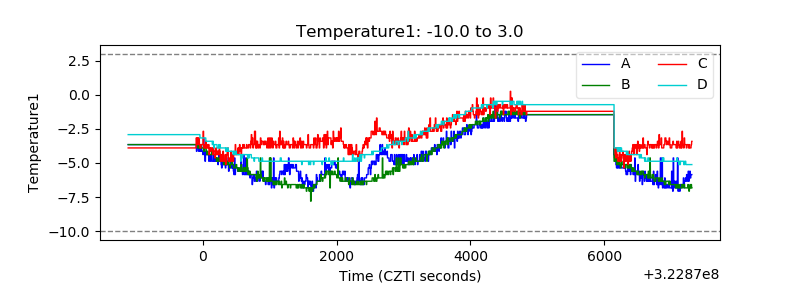 |
| Veto HV Monitor | 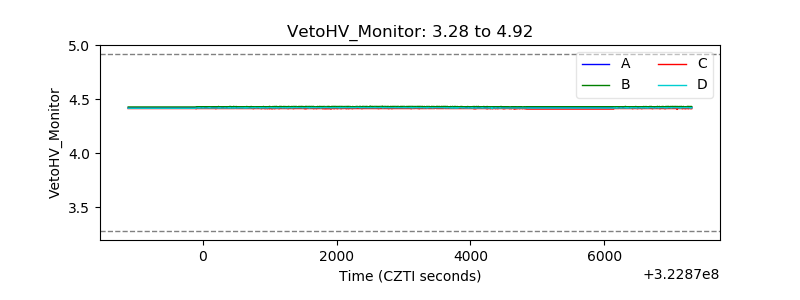 |
| Veto LLD | 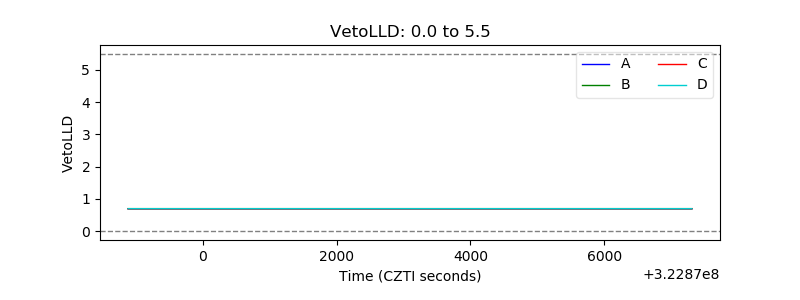 |
| Alpha Counter | 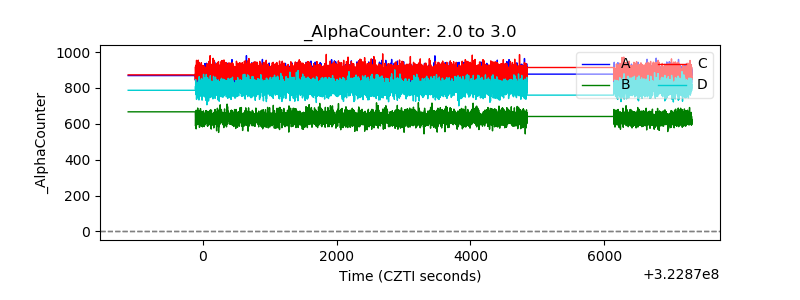 |
| _CPM_Rate | 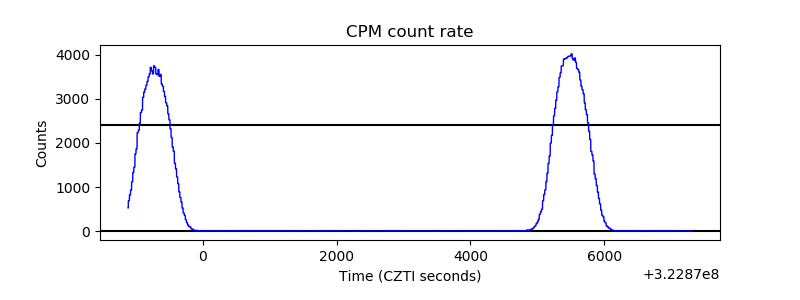 |
| CZT Counter | 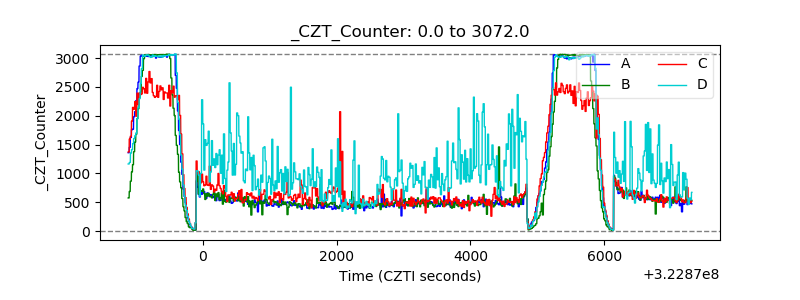 |
| +2.5 Volts monitor |  |
| +5 Volts monitor |  |
| _ROLL_ROT | 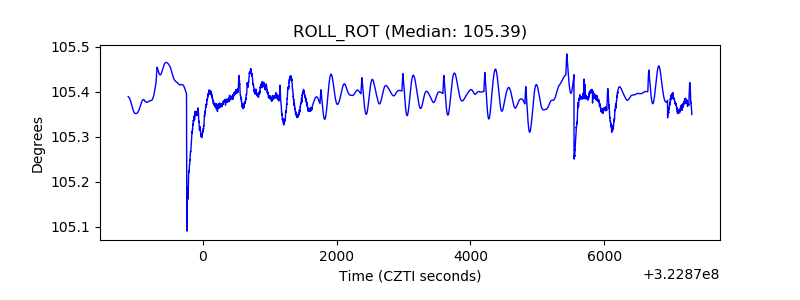 |
| _Roll_DEC | 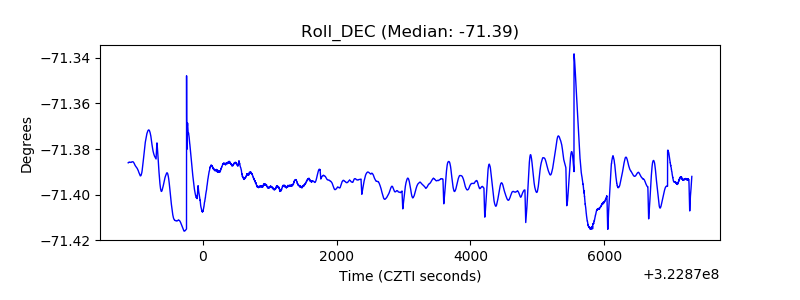 |
| _Roll_RA | 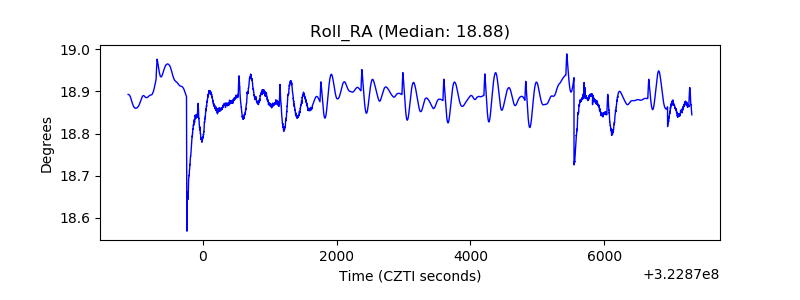 |
| Veto Counter | 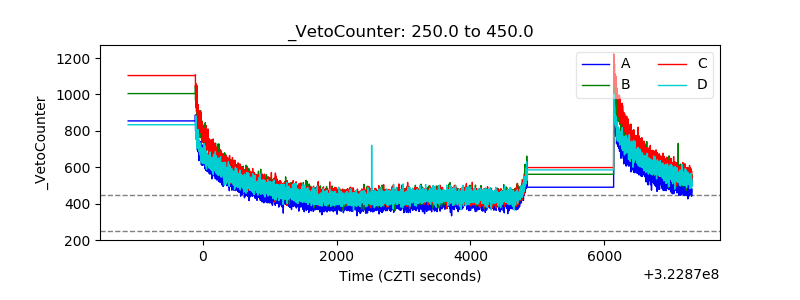 |