| Param | Original file | Final file |
|---|---|---|
| Filename | modeM0/AS1A07_047T08_9000003590_24288cztM0_level2.evt | modeM0/AS1A07_047T08_9000003590_24288cztM0_level2_quad_clean.evt |
| Size (bytes) | 534,407,040 | 151,796,160 |
| Size | 509.7 MB | 144.8 MB |
| Events in quadrant A | 3,429,528 | 1,055,650 |
| Events in quadrant B | 3,542,633 | 1,084,130 |
| Events in quadrant C | 3,628,193 | 1,024,134 |
| Events in quadrant D | 5,142,280 | 979,130 |
| Mode SS | |||
|---|---|---|---|
| Quadrant | BADHDUFLAG | Total packets | Discarded packets |
| A | 0 | 132 | 0 |
| B | 0 | 132 | 0 |
| C | 0 | 132 | 0 |
| D | 0 | 132 | 0 |
| Mode M9 | |||
|---|---|---|---|
| Quadrant | BADHDUFLAG | Total packets | Discarded packets |
| A | 0 | 21 | 0 |
| B | 0 | 22 | 0 |
| C | 0 | 22 | 0 |
| D | 0 | 22 | 0 |
| Mode M0 | |||
|---|---|---|---|
| Quadrant | BADHDUFLAG | Total packets | Discarded packets |
| A | 0 | 14030 | 2 |
| B | 0 | 14434 | 2 |
| C | 0 | 14616 | 2 |
| D | 0 | 19849 | 2 |
| Quadrant | Total seconds | Saturated seconds | Saturation percentage |
|---|---|---|---|
| A | 6524 | 61 | 0.935009% |
| B | 6524 | 104 | 1.594114% |
| C | 6524 | 116 | 1.778050% |
| D | 6524 | 158 | 2.421827% |
Noise dominated data is calculated using 1-second bins in cleaned event files. If a bin has >2000 counts, and if more than 50% of those come from <1% of pixels, then it is considered to be noise-dominated and hence unusable.
| Quadrant | # 1 sec bins | Bins with >0 counts | Bins with >2000 counts | High rate bins dominated by noise | Noise dominated (total time) | Noise dominated (detector-on time) | Marked lightcurve |
|---|---|---|---|---|---|---|---|
| A | 7869 | 6524 | 0 | 0 | 0.00% | 0.00% | 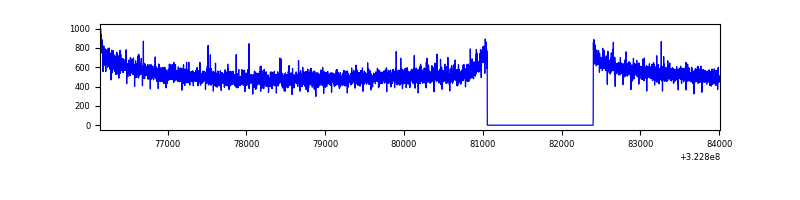 |
| B | 7869 | 6524 | 3 | 3 | 0.04% | 0.05% | 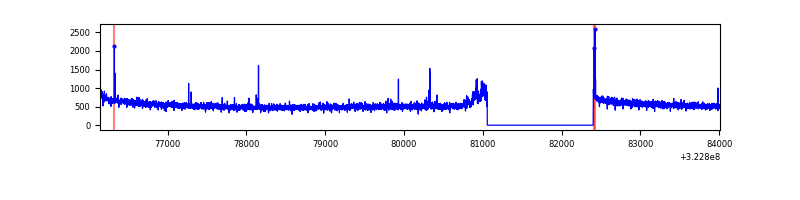 |
| C | 7869 | 6524 | 0 | 0 | 0.00% | 0.00% | 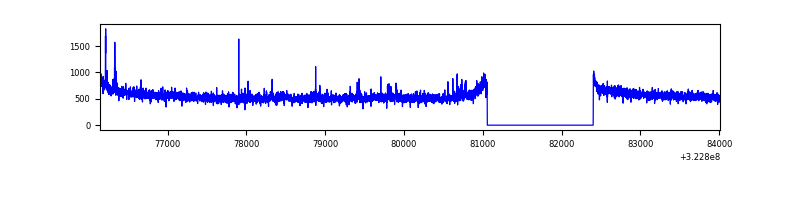 |
| D | 7869 | 6524 | 104 | 104 | 1.32% | 1.59% | 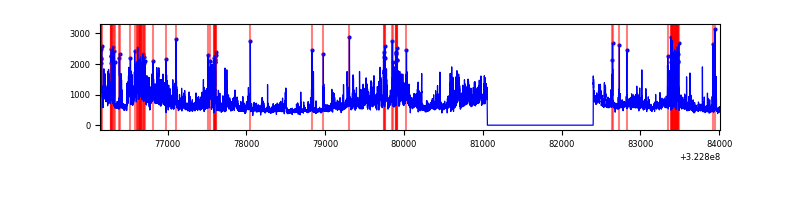 |
Top three noisy pixels from each quadrant. If the there are fewer than three noisy pixels in the level2.evt file, extra rows are filled as -1
| Pixel properties | Quadrant properties | ||||||
|---|---|---|---|---|---|---|---|
| Quadrant | DetID | PixID | Counts | Sigma | Mean | Median | Sigma |
| A | 2 | 79 | 12707 | 69.02 | 886 | 870 | 171.5 |
| A | 13 | 254 | 10856 | 58.23 | 886 | 870 | 171.5 |
| A | 0 | 226 | 7511 | 38.72 | 886 | 870 | 171.5 |
| B | 15 | 33 | 50990 | 311.57 | 889 | 871 | 160.9 |
| B | 12 | 111 | 18249 | 108.03 | 889 | 871 | 160.9 |
| B | 11 | 111 | 16125 | 94.83 | 889 | 871 | 160.9 |
| C | 14 | 238 | 142405 | 722.94 | 864 | 872 | 195.8 |
| C | 2 | 16 | 96793 | 489.96 | 864 | 872 | 195.8 |
| C | 7 | 247 | 15533 | 74.89 | 864 | 872 | 195.8 |
| D | 1 | 52 | 1010533 | 4955.61 | 861 | 839 | 203.7 |
| D | 8 | 195 | 802953 | 3936.8 | 861 | 839 | 203.7 |
| D | 12 | 233 | 40786 | 196.06 | 861 | 839 | 203.7 |
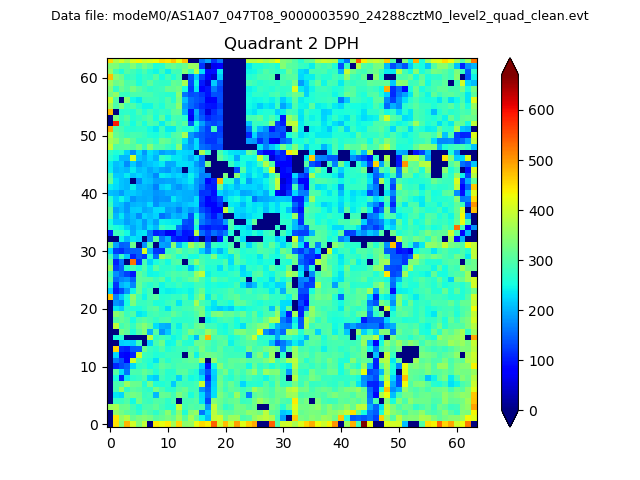
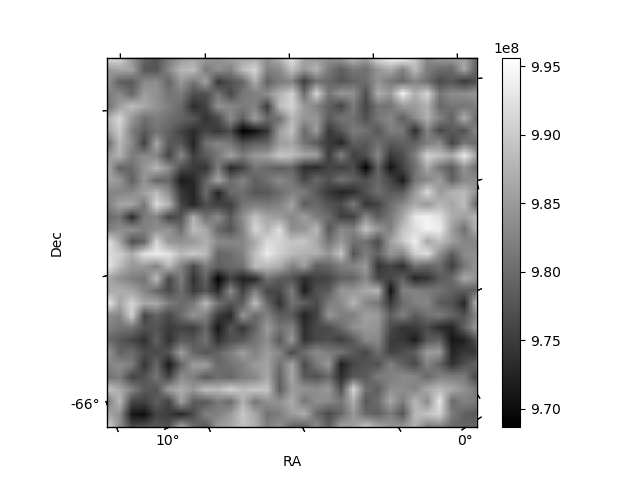
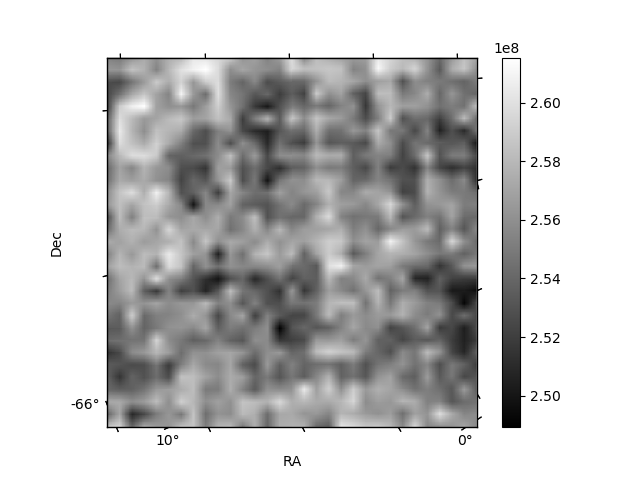
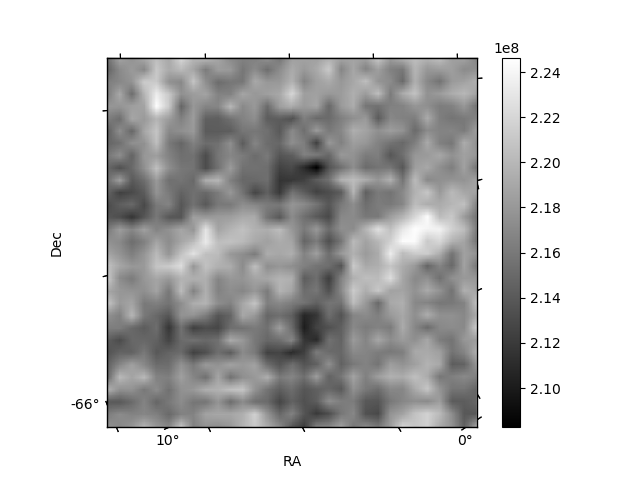
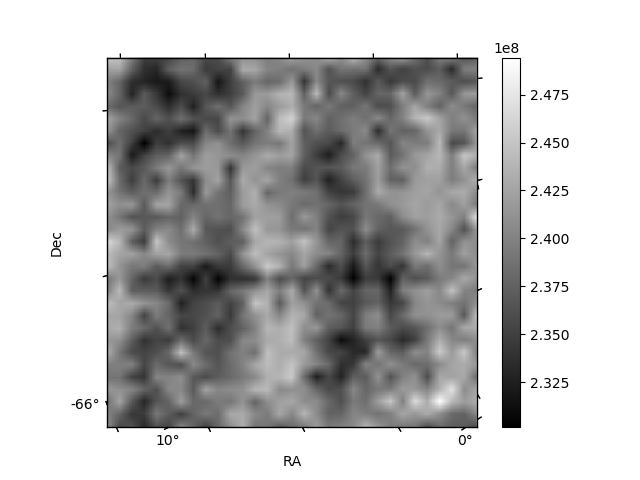
Histogram calculated using DETX and DETY for each event in the final _common_clean file
| Quadrant A | 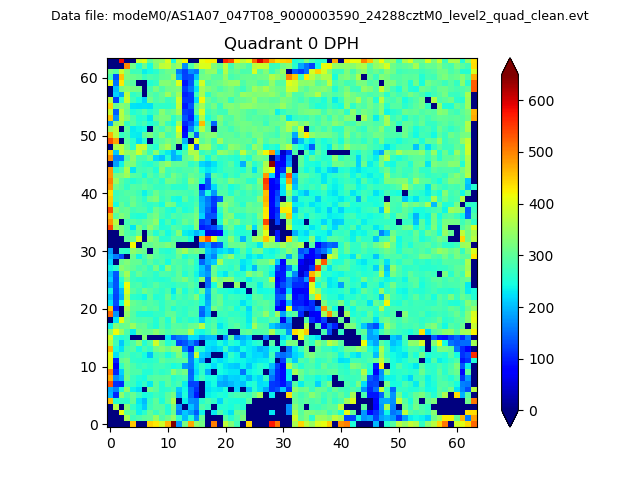 |
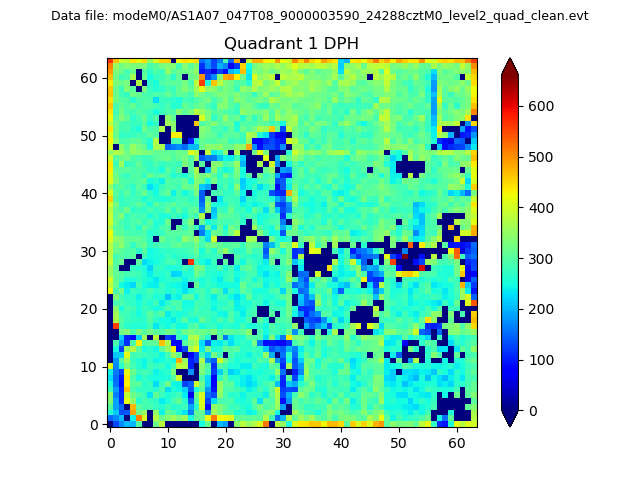 |
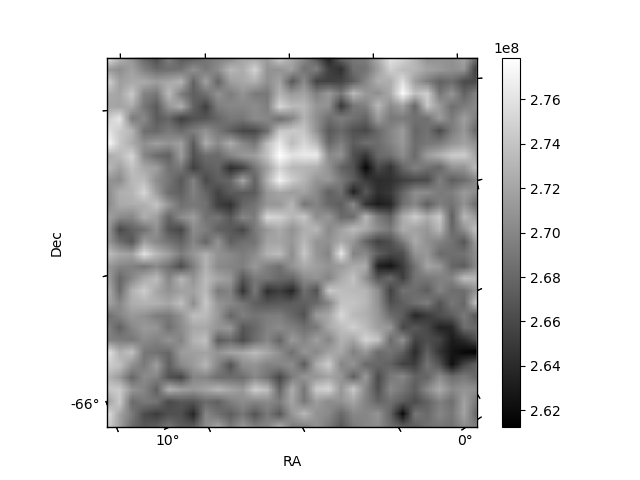
Quadrant B |
|---|---|---|---|
| Quadrant D | 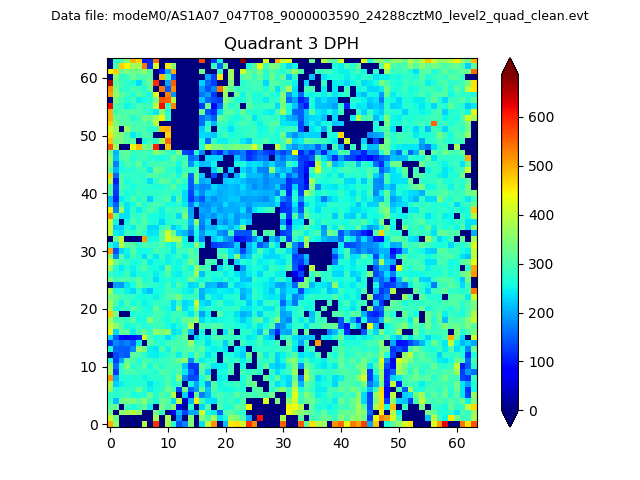 |
 |
Quadrant C |
| Plot type | Count rate plots | Images |
|---|---|---|
| Comparison with Poisson distribution Blue bars denote a histogram of data divided into 1 sec bins. Red curve is a Poisson curve with rate = median count rate of data. |
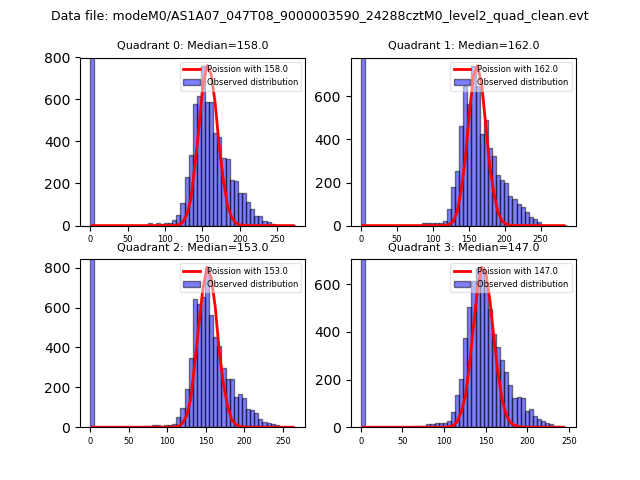 |
 |
| Quadrant-wise count rates Data is divided into 100 sec bins |
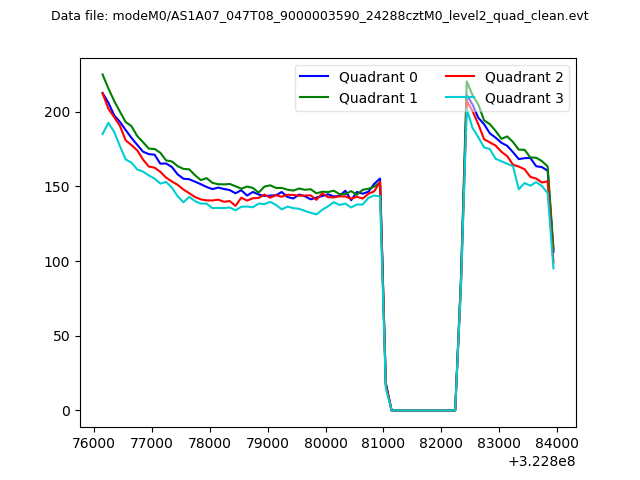 |
|
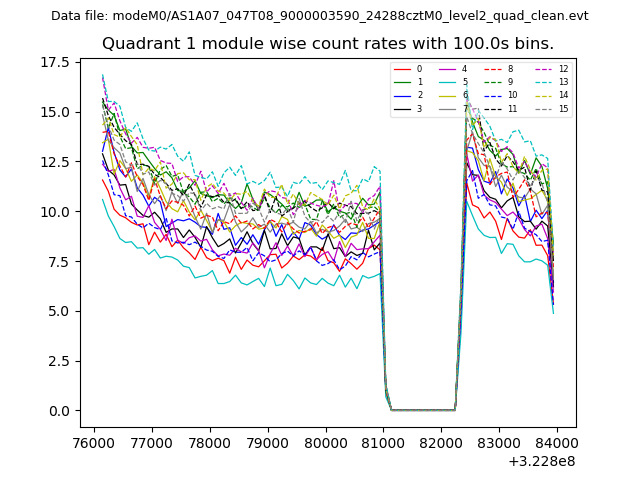
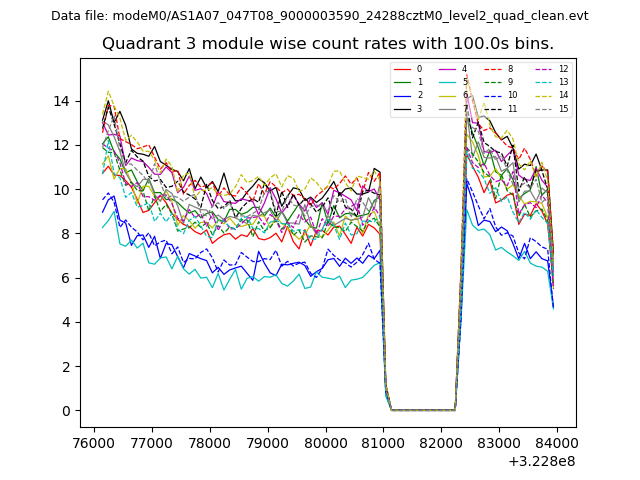
| Module-wise count rates for Quadrant A Data is divided into 100 sec bins |
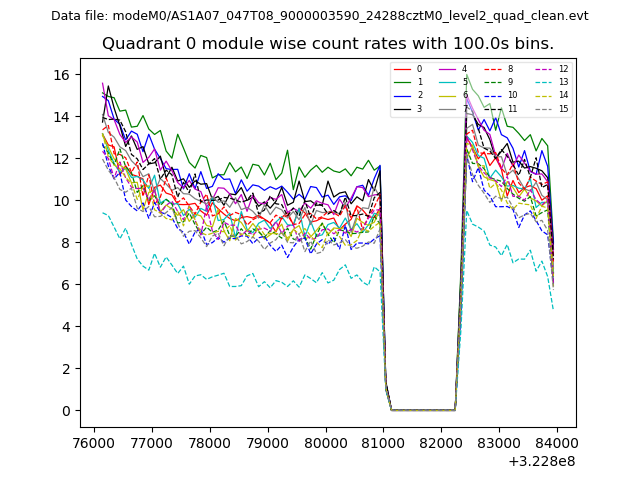 |
 |
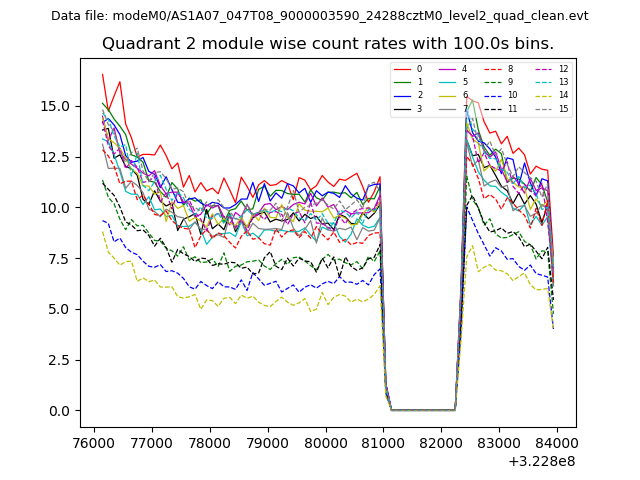
| Module-wise count rates for Quadrant B Data is divided into 100 sec bins |
 |
 |
| Module-wise count rates for Quadrant C Data is divided into 100 sec bins |
 |
 |
| Module-wise count rates for Quadrant D Data is divided into 100 sec bins |
 |
 |
| Parameter | Plot |
|---|---|
| CZT HV Monitor | 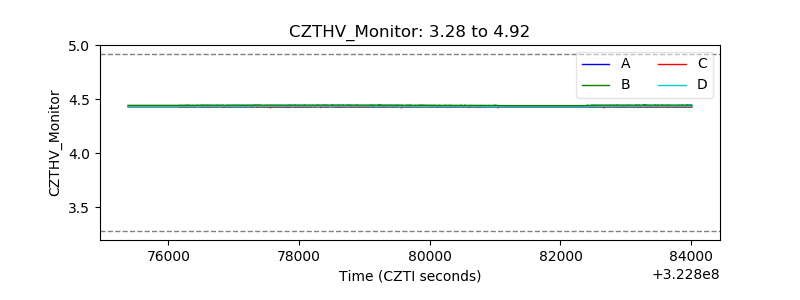 |
| D_VDD | 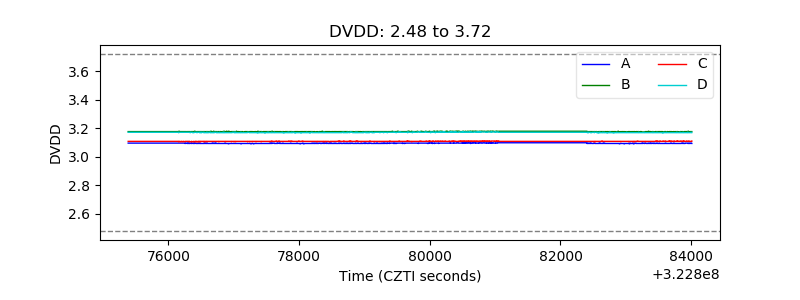 |
| Temperature 1 | 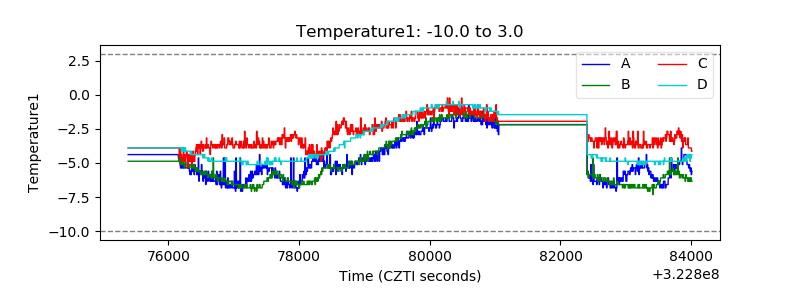 |
| Veto HV Monitor | 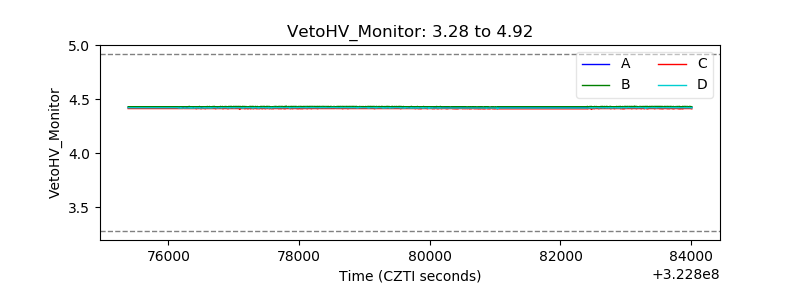 |
| Veto LLD | 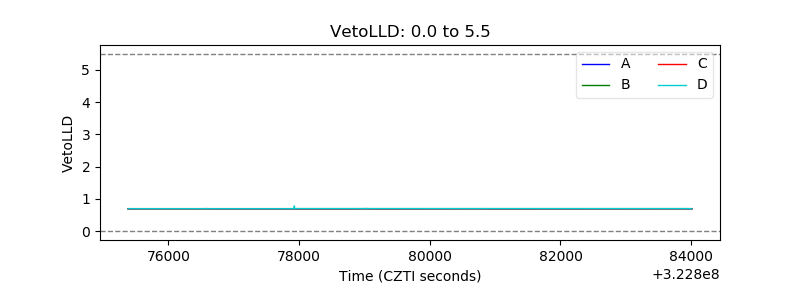 |
| Alpha Counter | 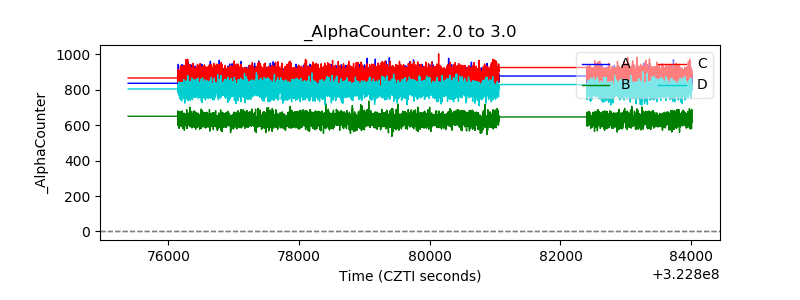 |
| _CPM_Rate | 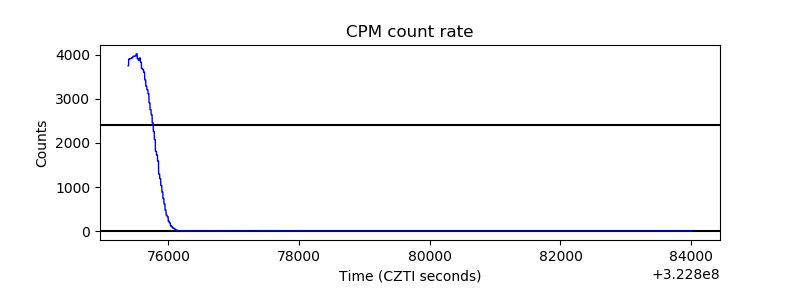 |
| CZT Counter | 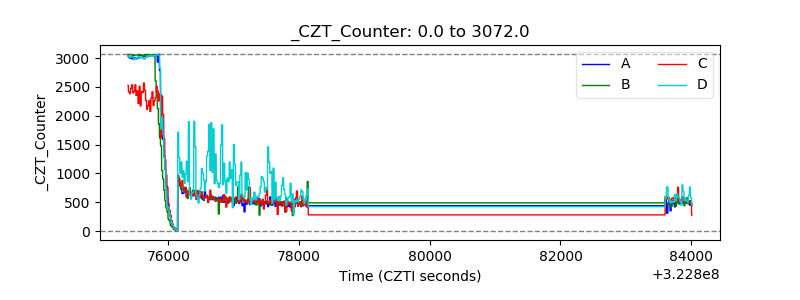 |
| +2.5 Volts monitor |  |
| +5 Volts monitor |  |
| _ROLL_ROT | 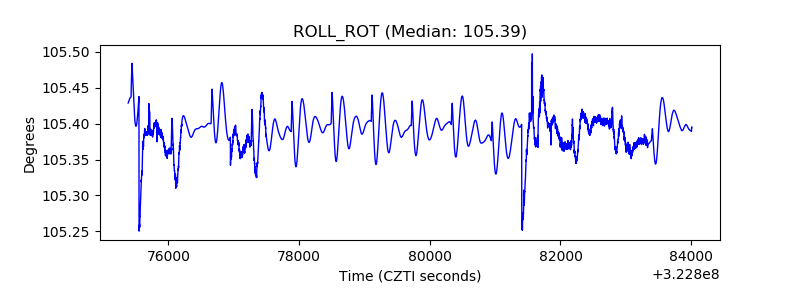 |
| _Roll_DEC | 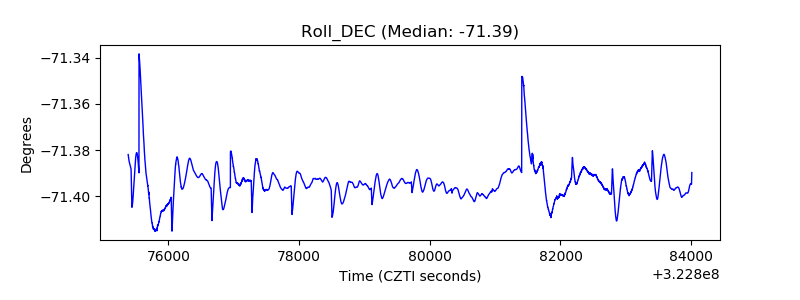 |
| _Roll_RA | 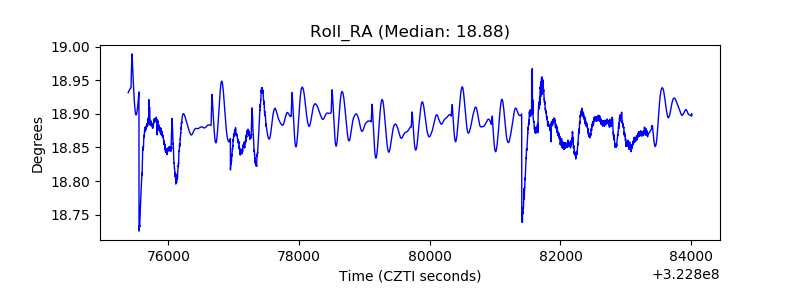 |
| Veto Counter | 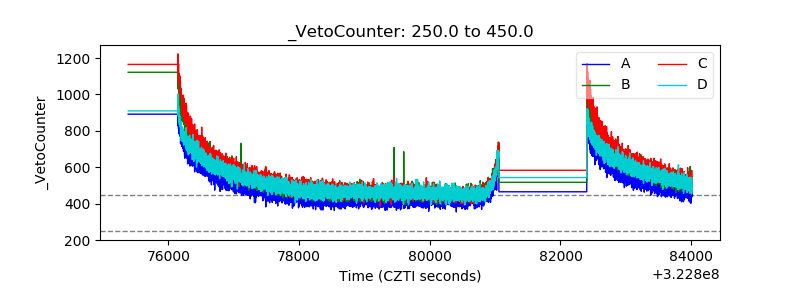 |