| Param | Original file | Final file |
|---|---|---|
| Filename | modeM0/AS1A07_047T08_9000003590_24289cztM0_level2.evt | modeM0/AS1A07_047T08_9000003590_24289cztM0_level2_quad_clean.evt |
| Size (bytes) | 535,538,880 | 141,966,720 |
| Size | 510.7 MB | 135.4 MB |
| Events in quadrant A | 3,213,912 | 990,189 |
| Events in quadrant B | 3,341,771 | 1,012,883 |
| Events in quadrant C | 3,519,820 | 963,083 |
| Events in quadrant D | 5,727,171 | 905,059 |
| Mode SS | |||
|---|---|---|---|
| Quadrant | BADHDUFLAG | Total packets | Discarded packets |
| A | 0 | 124 | 0 |
| B | 0 | 124 | 0 |
| C | 0 | 124 | 0 |
| D | 0 | 124 | 0 |
| Mode M9 | |||
|---|---|---|---|
| Quadrant | BADHDUFLAG | Total packets | Discarded packets |
| A | 0 | 19 | 0 |
| B | 0 | 20 | 0 |
| C | 0 | 20 | 0 |
| D | 0 | 20 | 0 |
| Mode M0 | |||
|---|---|---|---|
| Quadrant | BADHDUFLAG | Total packets | Discarded packets |
| A | 0 | 13085 | 2 |
| B | 0 | 13606 | 2 |
| C | 0 | 14219 | 2 |
| D | 0 | 21289 | 2 |
| Quadrant | Total seconds | Saturated seconds | Saturation percentage |
|---|---|---|---|
| A | 6148 | 22 | 0.357840% |
| B | 6148 | 53 | 0.862069% |
| C | 6147 | 98 | 1.594274% |
| D | 6147 | 420 | 6.832601% |
Noise dominated data is calculated using 1-second bins in cleaned event files. If a bin has >2000 counts, and if more than 50% of those come from <1% of pixels, then it is considered to be noise-dominated and hence unusable.
| Quadrant | # 1 sec bins | Bins with >0 counts | Bins with >2000 counts | High rate bins dominated by noise | Noise dominated (total time) | Noise dominated (detector-on time) | Marked lightcurve |
|---|---|---|---|---|---|---|---|
| A | 7553 | 6149 | 0 | 0 | 0.00% | 0.00% | 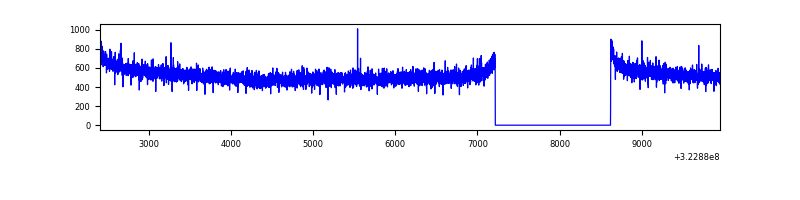 |
| B | 7553 | 6149 | 6 | 6 | 0.08% | 0.10% | 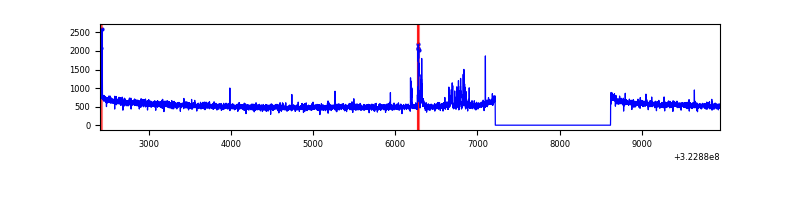 |
| C | 7552 | 6148 | 15 | 15 | 0.20% | 0.24% | 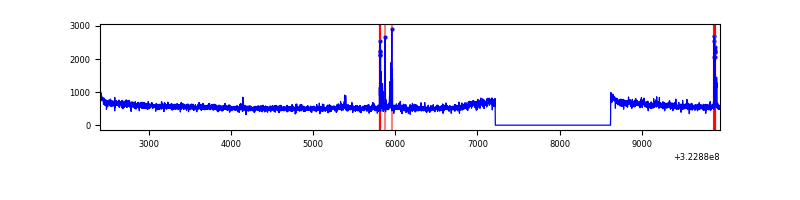 |
| D | 7552 | 6147 | 338 | 338 | 4.48% | 5.50% | 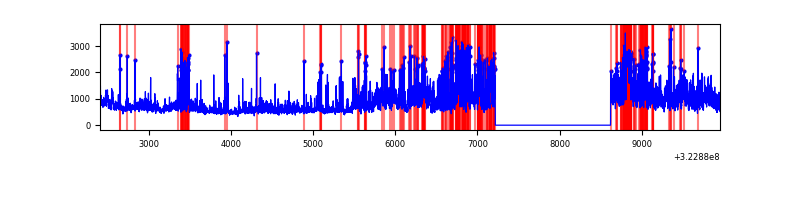 |
Top three noisy pixels from each quadrant. If the there are fewer than three noisy pixels in the level2.evt file, extra rows are filled as -1
| Pixel properties | Quadrant properties | ||||||
|---|---|---|---|---|---|---|---|
| Quadrant | DetID | PixID | Counts | Sigma | Mean | Median | Sigma |
| A | 13 | 254 | 10246 | 57.28 | 833 | 817 | 164.6 |
| A | 0 | 226 | 7250 | 39.08 | 833 | 817 | 164.6 |
| A | 3 | 137 | 6530 | 34.71 | 833 | 817 | 164.6 |
| B | 12 | 17 | 76917 | 501.99 | 833 | 817 | 151.6 |
| B | 12 | 111 | 17268 | 108.52 | 833 | 817 | 151.6 |
| B | 11 | 111 | 15165 | 94.65 | 833 | 817 | 151.6 |
| C | 14 | 238 | 133241 | 719.54 | 813 | 822 | 184.0 |
| C | 2 | 16 | 116425 | 628.16 | 813 | 822 | 184.0 |
| C | 7 | 247 | 98931 | 533.11 | 813 | 822 | 184.0 |
| D | 1 | 52 | 1682841 | 8787.59 | 800 | 781 | 191.4 |
| D | 8 | 195 | 947744 | 4947.22 | 800 | 781 | 191.4 |
| D | 12 | 233 | 54024 | 278.16 | 800 | 781 | 191.4 |
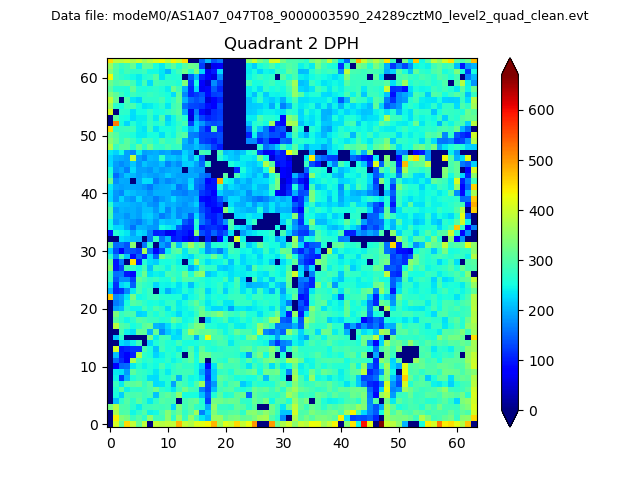
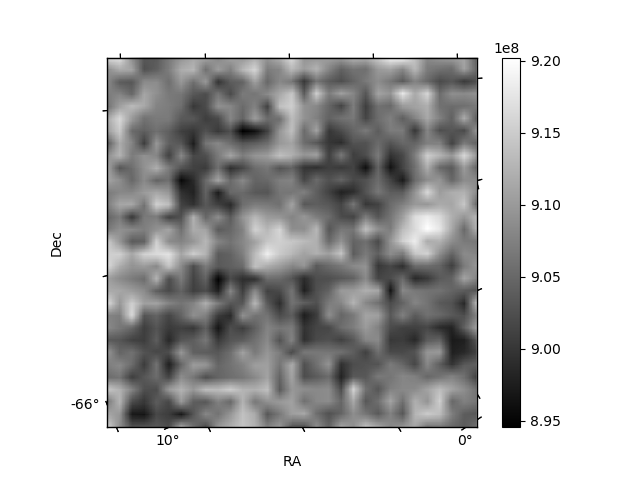
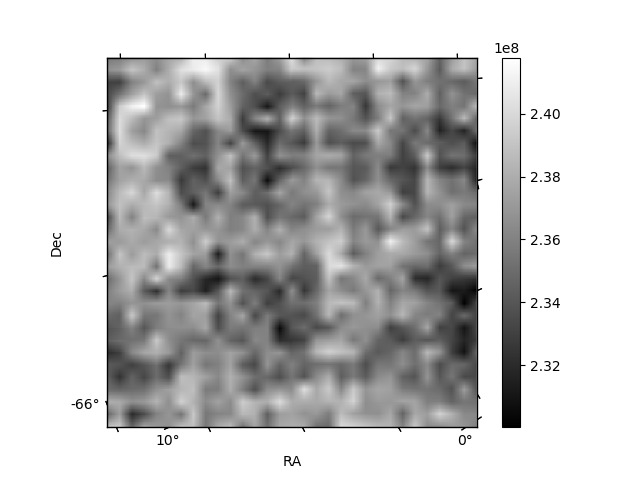
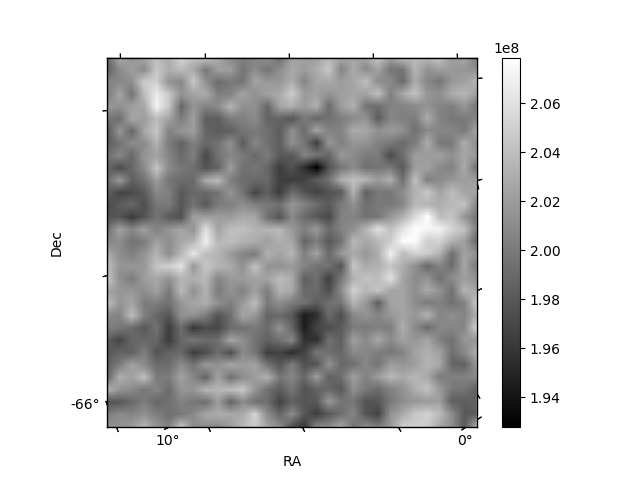
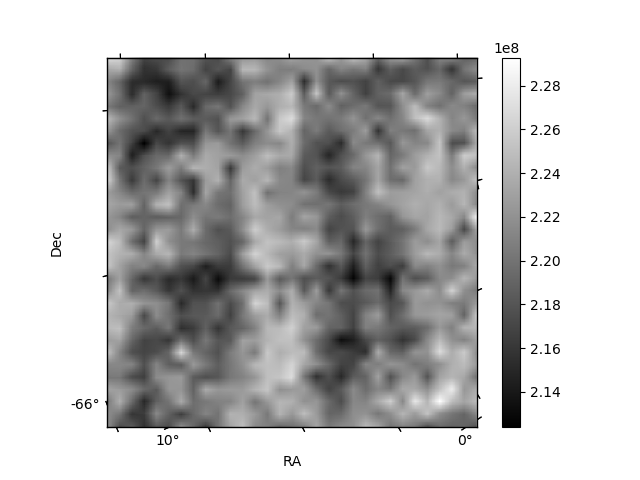
Histogram calculated using DETX and DETY for each event in the final _common_clean file
| Quadrant A | 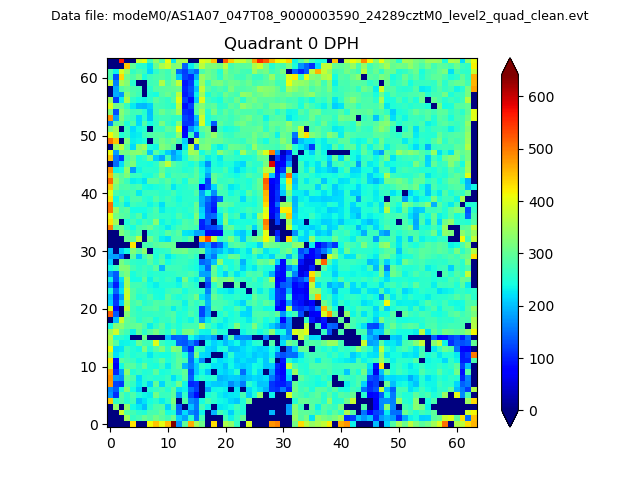 |
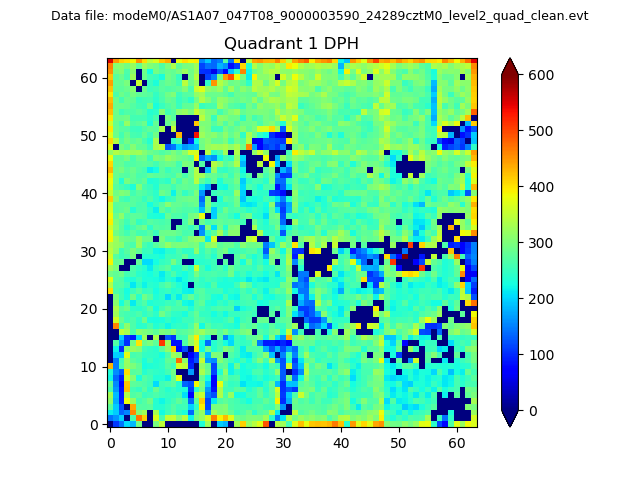 |
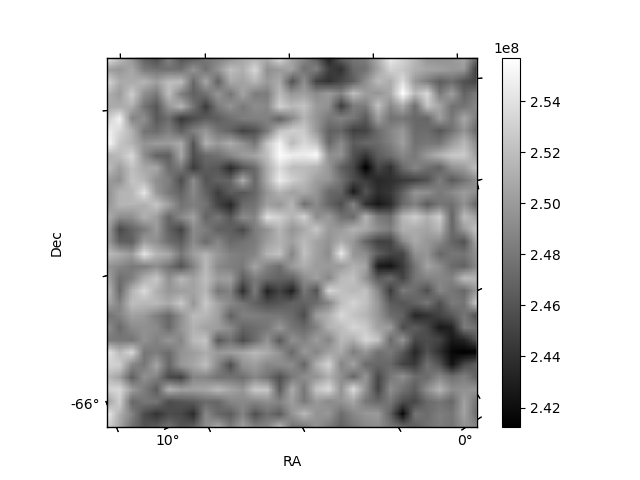
Quadrant B |
|---|---|---|---|
| Quadrant D | 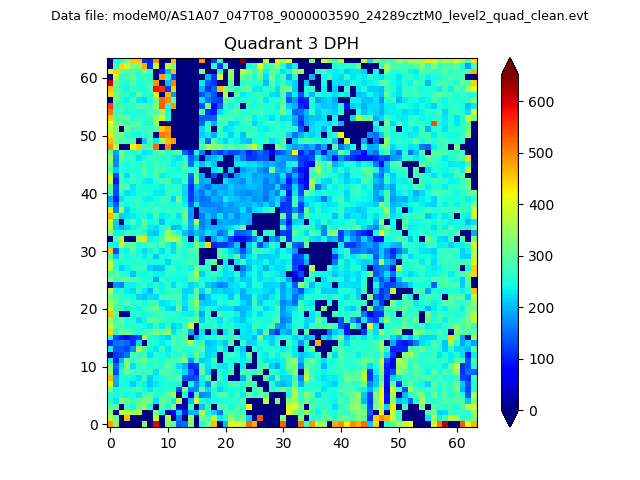 |
 |
Quadrant C |
| Plot type | Count rate plots | Images |
|---|---|---|
| Comparison with Poisson distribution Blue bars denote a histogram of data divided into 1 sec bins. Red curve is a Poisson curve with rate = median count rate of data. |
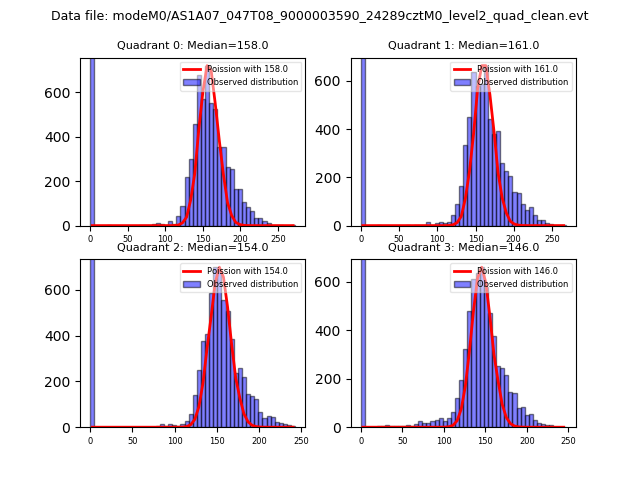 |
 |
| Quadrant-wise count rates Data is divided into 100 sec bins |
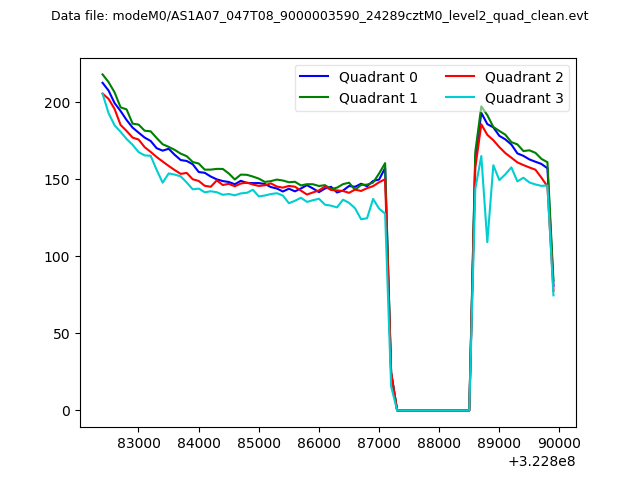 |
|
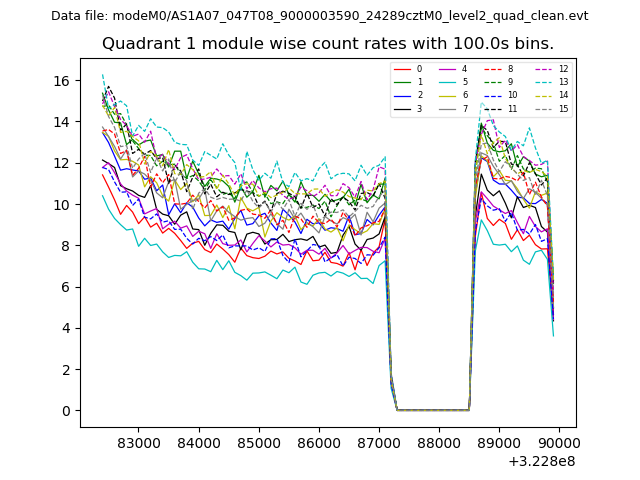
| Module-wise count rates for Quadrant A Data is divided into 100 sec bins |
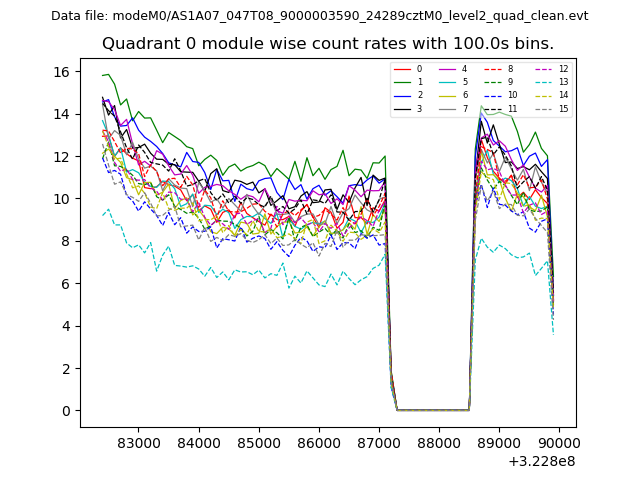 |
 |
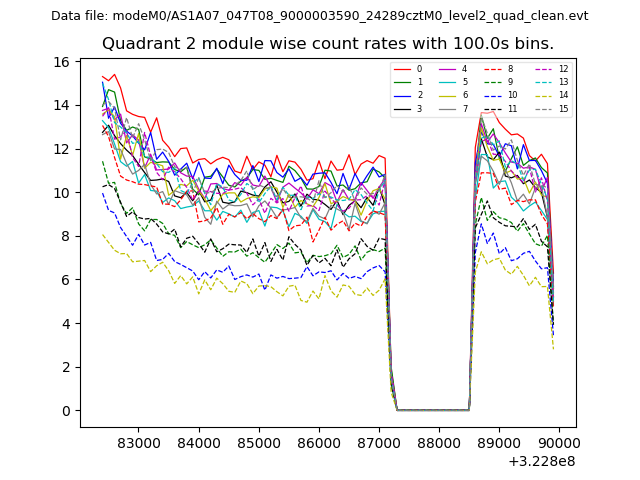
| Module-wise count rates for Quadrant B Data is divided into 100 sec bins |
 |
 |
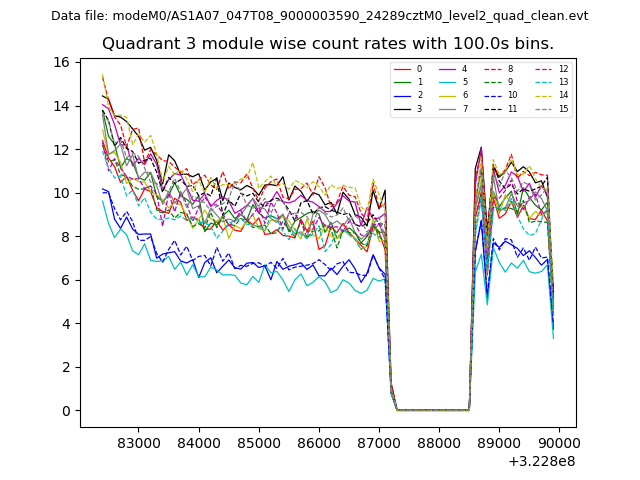
| Module-wise count rates for Quadrant C Data is divided into 100 sec bins |
 |
 |
| Module-wise count rates for Quadrant D Data is divided into 100 sec bins |
 |
 |
| Parameter | Plot |
|---|---|
| CZT HV Monitor | 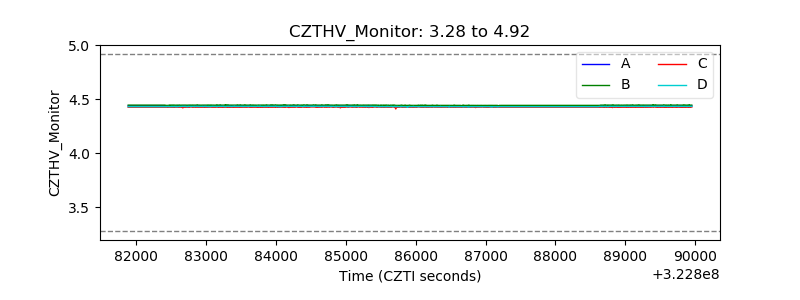 |
| D_VDD | 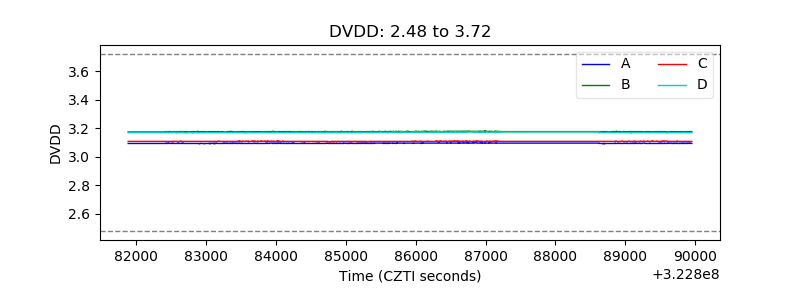 |
| Temperature 1 | 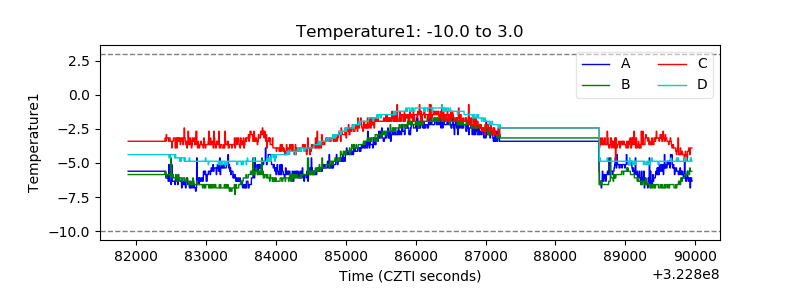 |
| Veto HV Monitor | 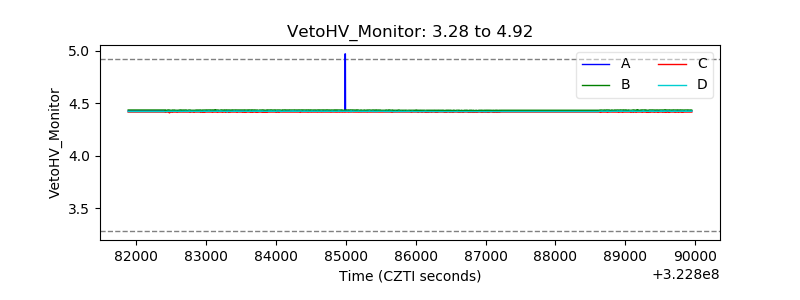 |
| Veto LLD | 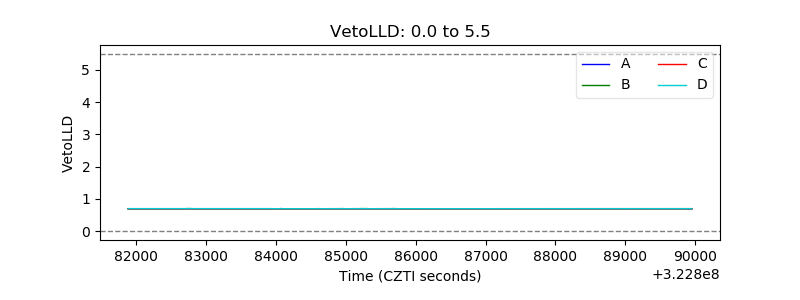 |
| Alpha Counter | 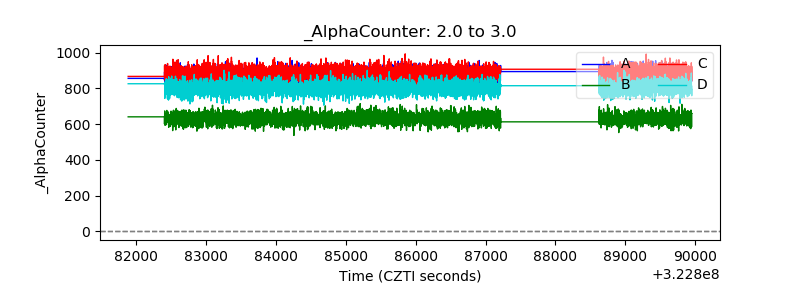 |
| _CPM_Rate | 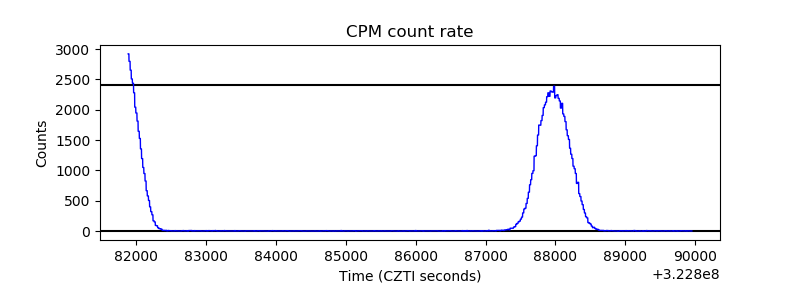 |
| CZT Counter | 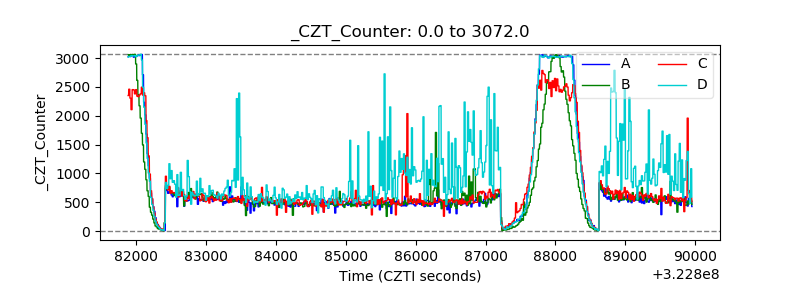 |
| +2.5 Volts monitor |  |
| +5 Volts monitor |  |
| _ROLL_ROT |  |
| _Roll_DEC |  |
| _Roll_RA | 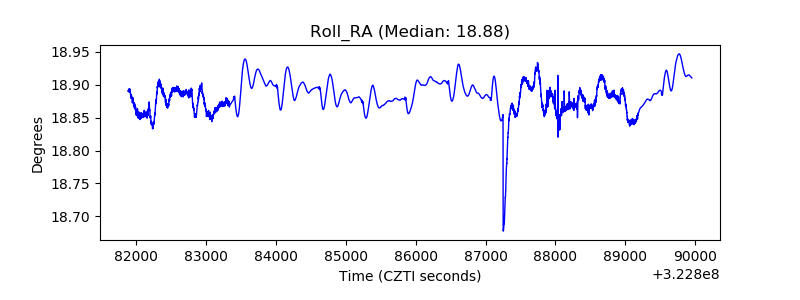 |
| Veto Counter | 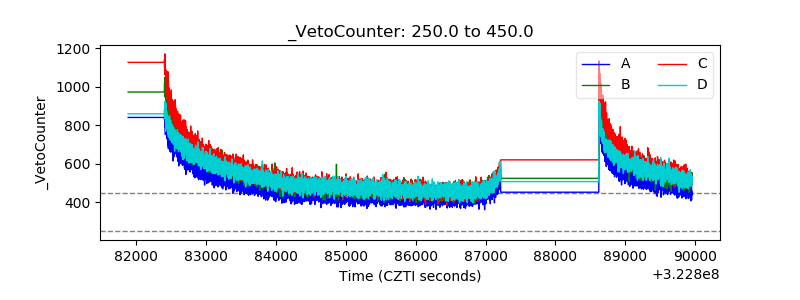 |