| Param | Original file | Final file |
|---|---|---|
| Filename | modeM0/AS1A07_047T08_9000003590_24290cztM0_level2.evt | modeM0/AS1A07_047T08_9000003590_24290cztM0_level2_quad_clean.evt |
| Size (bytes) | 592,819,200 | 142,050,240 |
| Size | 565.4 MB | 135.5 MB |
| Events in quadrant A | 3,290,229 | 987,735 |
| Events in quadrant B | 3,587,531 | 1,006,233 |
| Events in quadrant C | 3,927,203 | 958,985 |
| Events in quadrant D | 6,709,767 | 897,115 |
| Mode SS | |||
|---|---|---|---|
| Quadrant | BADHDUFLAG | Total packets | Discarded packets |
| A | 0 | 132 | 0 |
| B | 0 | 132 | 0 |
| C | 0 | 132 | 0 |
| D | 0 | 132 | 0 |
| Mode M9 | |||
|---|---|---|---|
| Quadrant | BADHDUFLAG | Total packets | Discarded packets |
| A | 0 | 13 | 0 |
| B | 0 | 14 | 0 |
| C | 0 | 14 | 0 |
| D | 0 | 14 | 0 |
| Mode M0 | |||
|---|---|---|---|
| Quadrant | BADHDUFLAG | Total packets | Discarded packets |
| A | 0 | 13553 | 2 |
| B | 0 | 14468 | 2 |
| C | 0 | 16012 | 2 |
| D | 0 | 24547 | 2 |
| Quadrant | Total seconds | Saturated seconds | Saturation percentage |
|---|---|---|---|
| A | 6483 | 52 | 0.802098% |
| B | 6483 | 150 | 2.313744% |
| C | 6483 | 171 | 2.637668% |
| D | 6483 | 507 | 7.820453% |
Noise dominated data is calculated using 1-second bins in cleaned event files. If a bin has >2000 counts, and if more than 50% of those come from <1% of pixels, then it is considered to be noise-dominated and hence unusable.
| Quadrant | # 1 sec bins | Bins with >0 counts | Bins with >2000 counts | High rate bins dominated by noise | Noise dominated (total time) | Noise dominated (detector-on time) | Marked lightcurve |
|---|---|---|---|---|---|---|---|
| A | 7718 | 6483 | 0 | 0 | 0.00% | 0.00% | 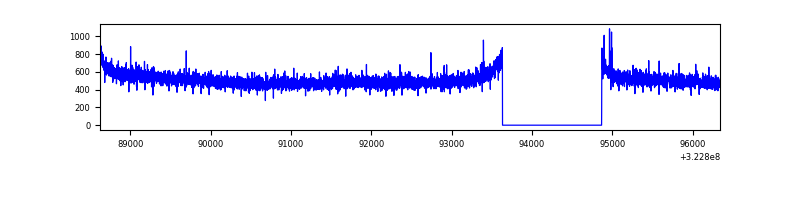 |
| B | 7718 | 6484 | 39 | 39 | 0.51% | 0.60% | 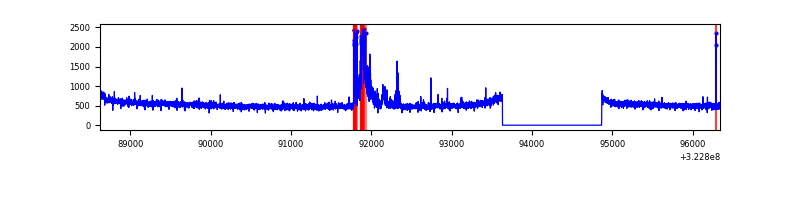 |
| C | 7718 | 6483 | 12 | 12 | 0.16% | 0.19% | 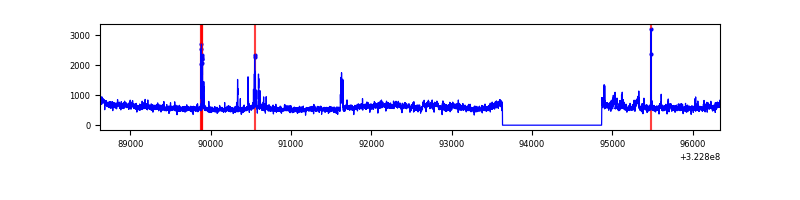 |
| D | 7718 | 6483 | 416 | 416 | 5.39% | 6.42% | 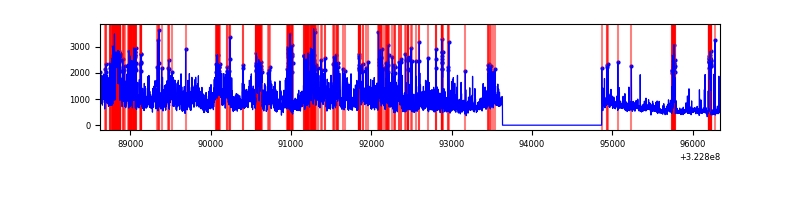 |
Top three noisy pixels from each quadrant. If the there are fewer than three noisy pixels in the level2.evt file, extra rows are filled as -1
| Pixel properties | Quadrant properties | ||||||
|---|---|---|---|---|---|---|---|
| Quadrant | DetID | PixID | Counts | Sigma | Mean | Median | Sigma |
| A | 13 | 254 | 10015 | 54.79 | 851 | 835 | 167.6 |
| A | 0 | 226 | 7082 | 37.28 | 851 | 835 | 167.6 |
| A | 3 | 137 | 6911 | 36.26 | 851 | 835 | 167.6 |
| B | 12 | 17 | 256085 | 1636.77 | 849 | 830 | 156.0 |
| B | 12 | 111 | 18051 | 110.43 | 849 | 830 | 156.0 |
| B | 11 | 111 | 16081 | 97.79 | 849 | 830 | 156.0 |
| C | 7 | 247 | 387812 | 2045.17 | 830 | 837 | 189.2 |
| C | 2 | 16 | 164668 | 865.85 | 830 | 837 | 189.2 |
| C | 14 | 238 | 136778 | 718.45 | 830 | 837 | 189.2 |
| D | 8 | 195 | 1851897 | 9515.53 | 817 | 794 | 194.5 |
| D | 1 | 52 | 1669323 | 8577.02 | 817 | 794 | 194.5 |
| D | 12 | 218 | 42043 | 212.04 | 817 | 794 | 194.5 |
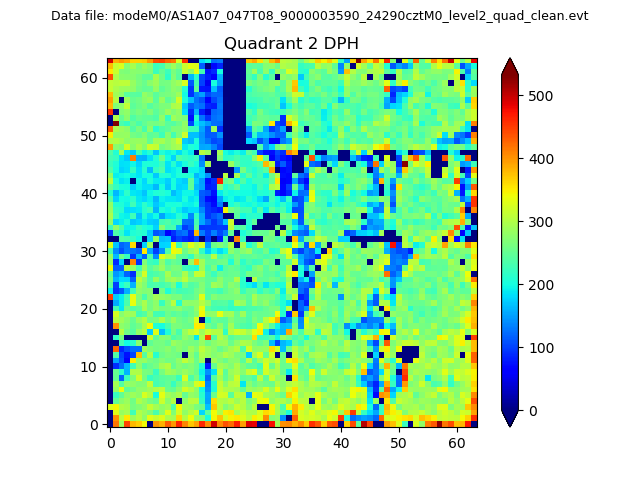
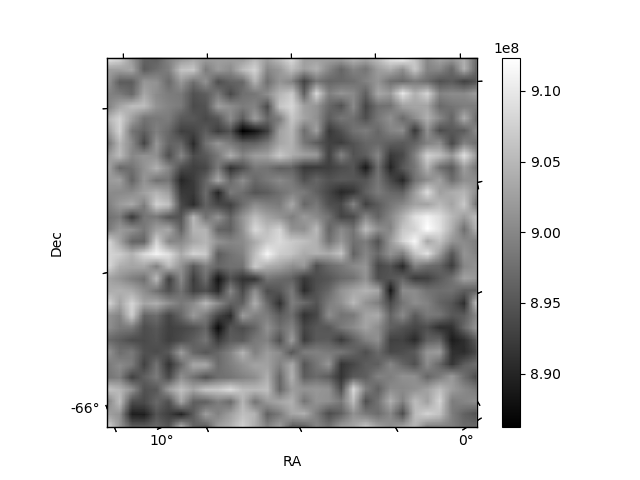
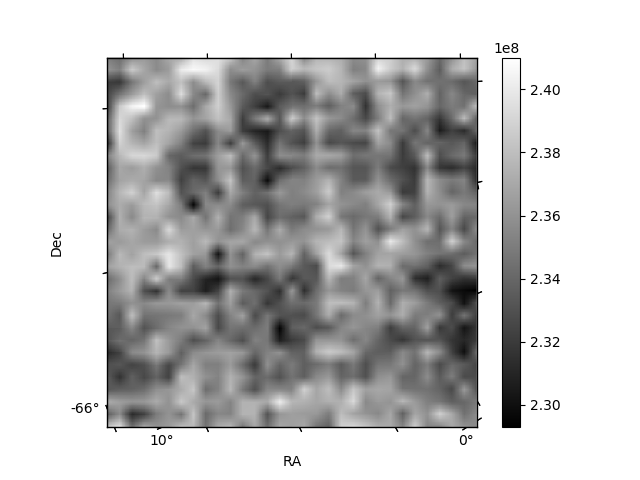
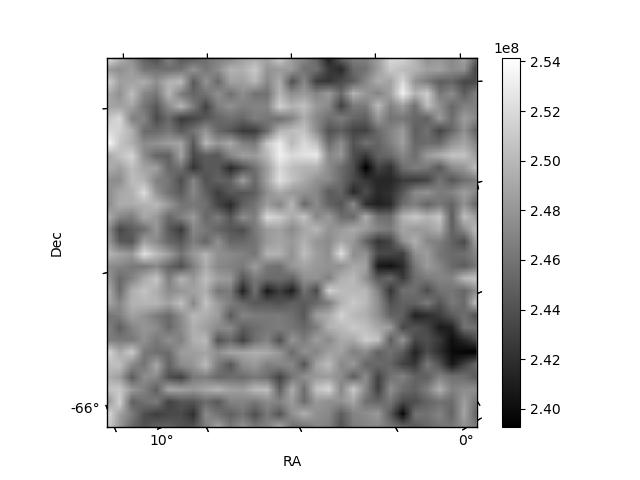
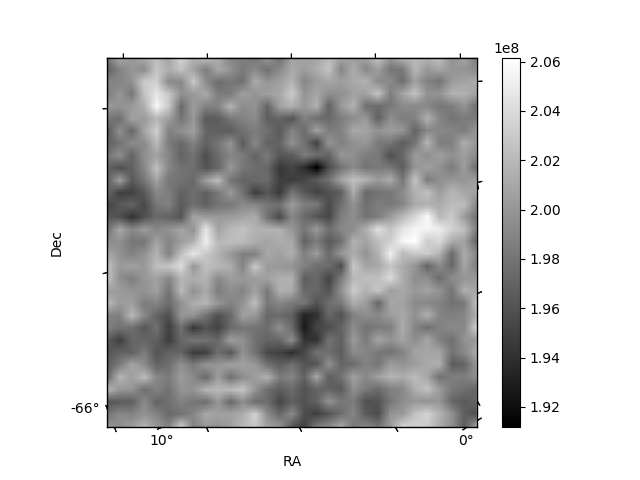
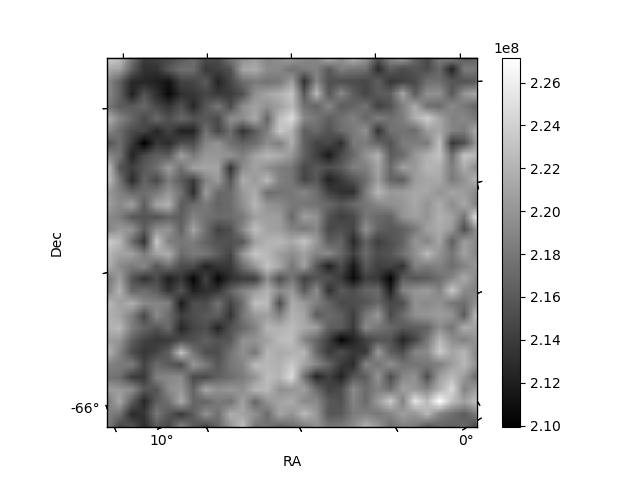
Histogram calculated using DETX and DETY for each event in the final _common_clean file
| Quadrant A | 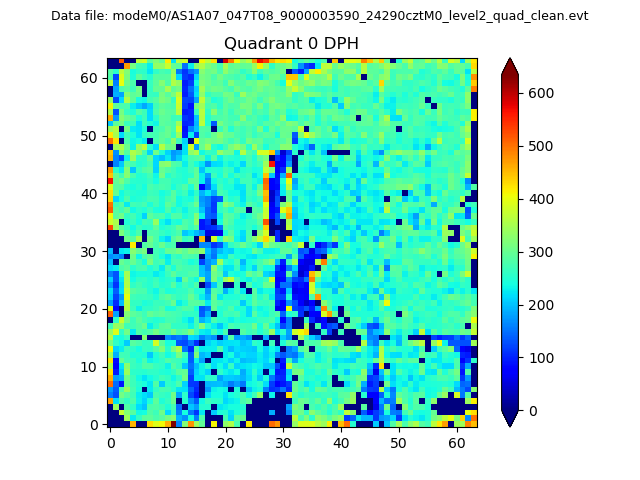 |
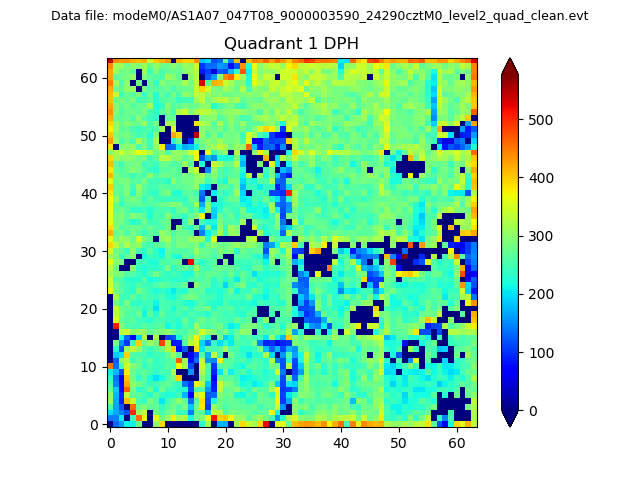 |
Quadrant B |
|---|---|---|---|
| Quadrant D | 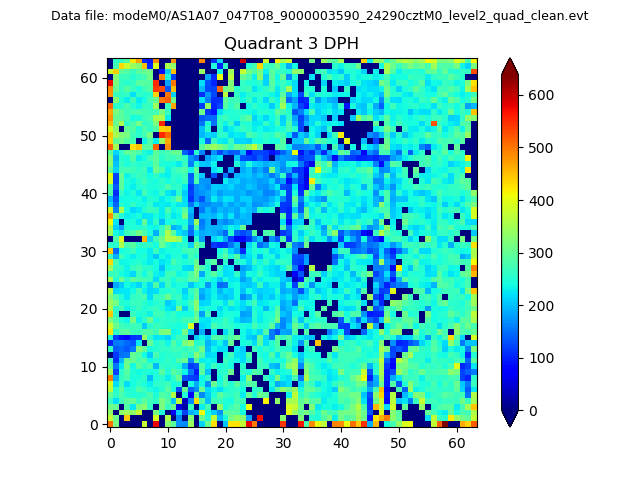 |
 |
Quadrant C |
| Plot type | Count rate plots | Images |
|---|---|---|
| Comparison with Poisson distribution Blue bars denote a histogram of data divided into 1 sec bins. Red curve is a Poisson curve with rate = median count rate of data. |
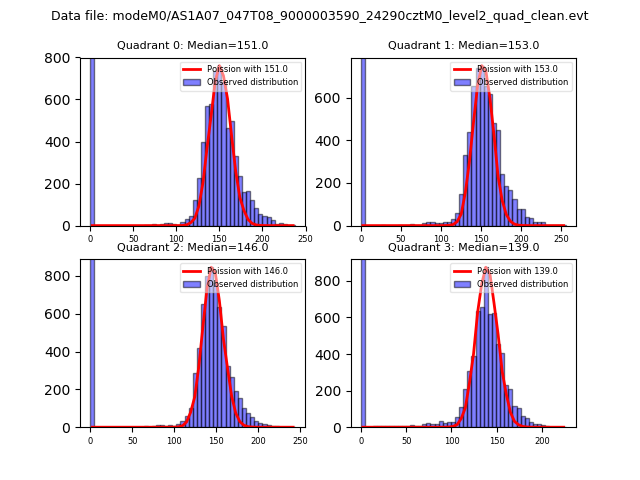 |
 |
| Quadrant-wise count rates Data is divided into 100 sec bins |
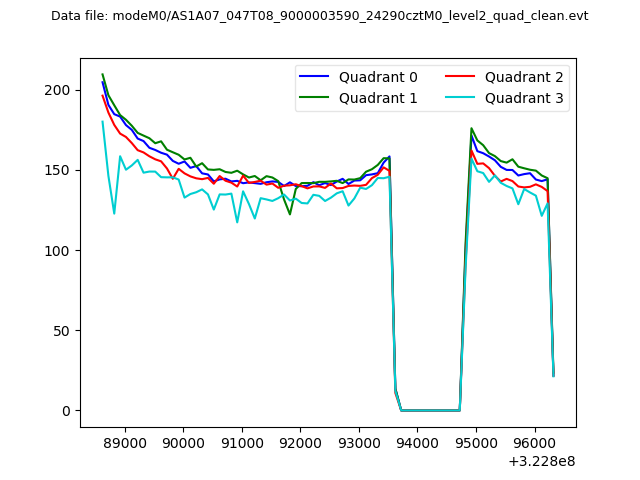 |
|
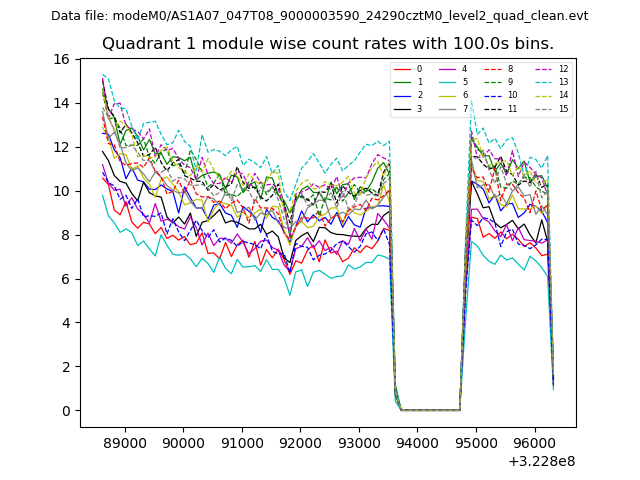
| Module-wise count rates for Quadrant A Data is divided into 100 sec bins |
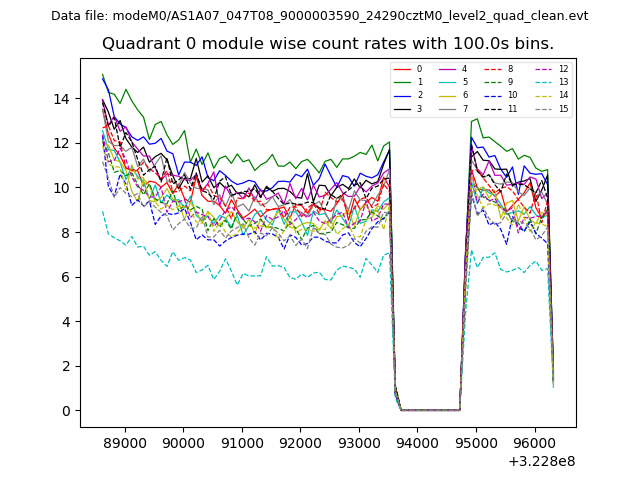 |
 |
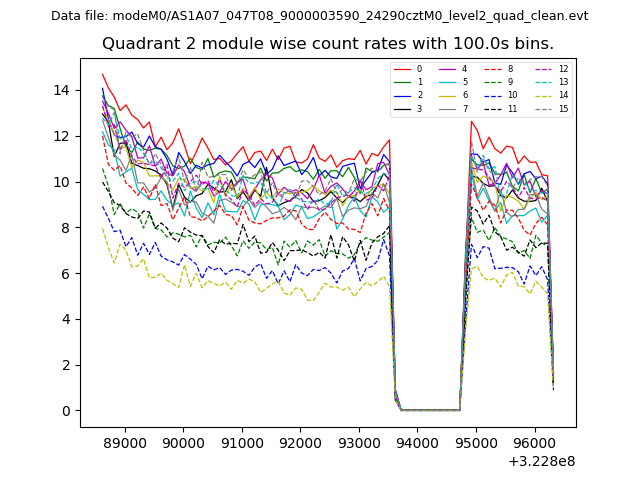
| Module-wise count rates for Quadrant B Data is divided into 100 sec bins |
 |
 |
| Module-wise count rates for Quadrant C Data is divided into 100 sec bins |
 |
 |
| Module-wise count rates for Quadrant D Data is divided into 100 sec bins |
 |
 |
| Parameter | Plot |
|---|---|
| CZT HV Monitor |  |
| D_VDD | 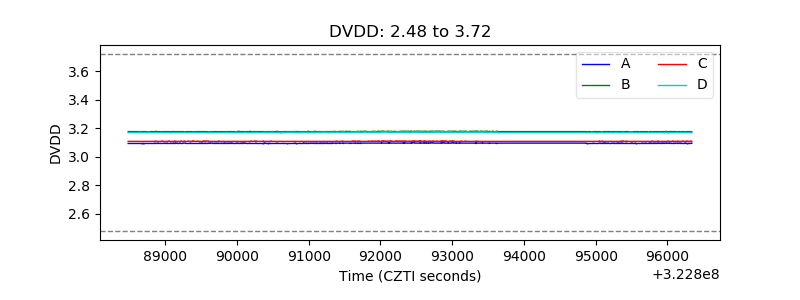 |
| Temperature 1 | 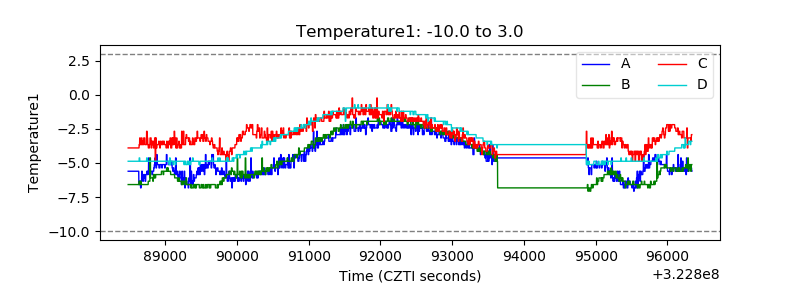 |
| Veto HV Monitor | 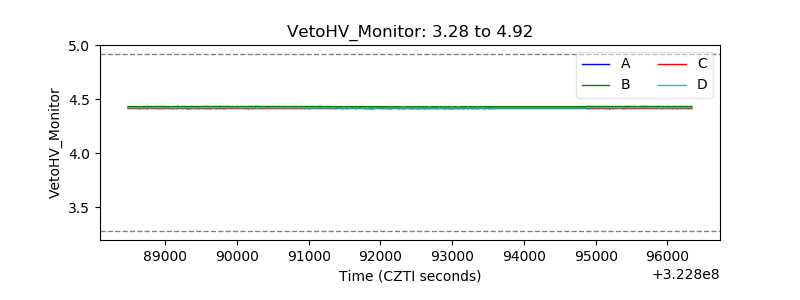 |
| Veto LLD | 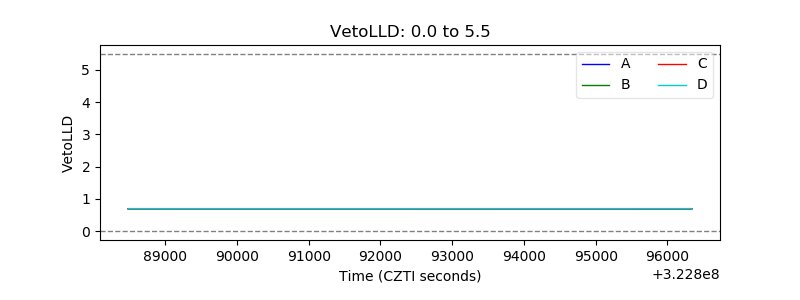 |
| Alpha Counter | 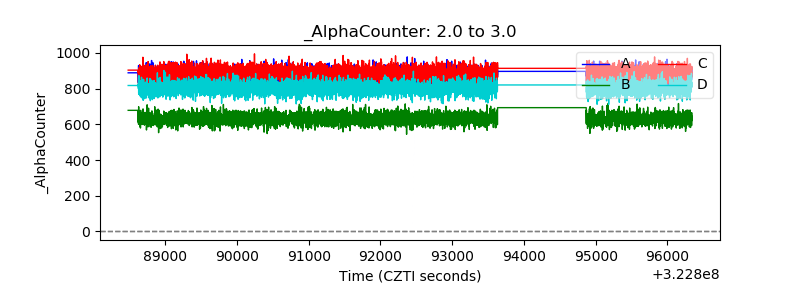 |
| _CPM_Rate | 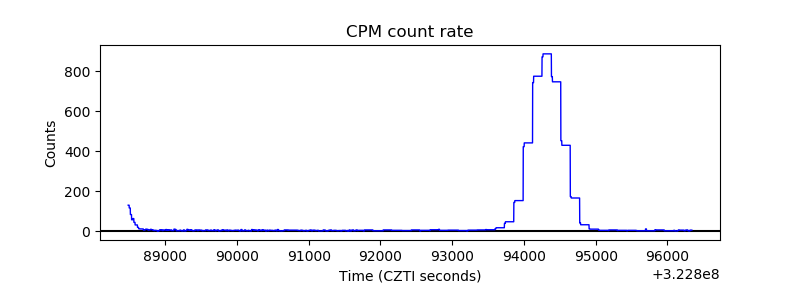 |
| CZT Counter | 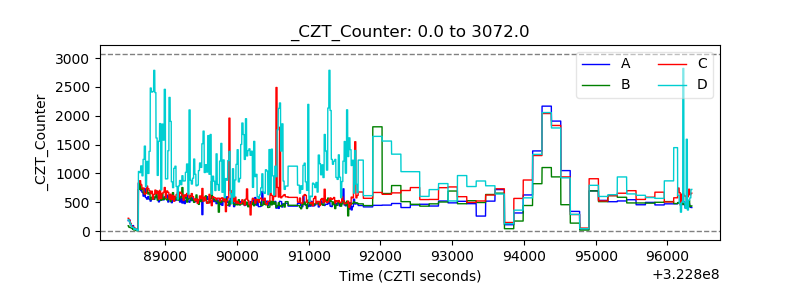 |
| +2.5 Volts monitor |  |
| +5 Volts monitor |  |
| _ROLL_ROT | 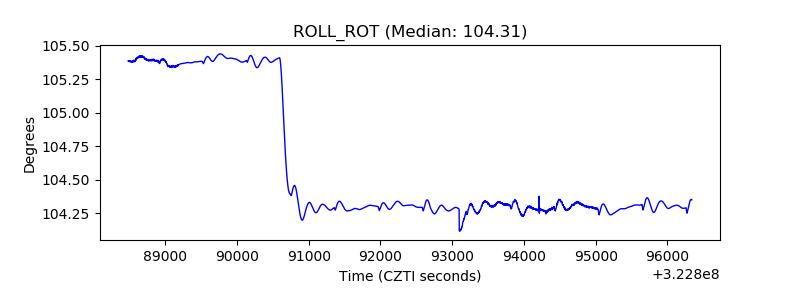 |
| _Roll_DEC | 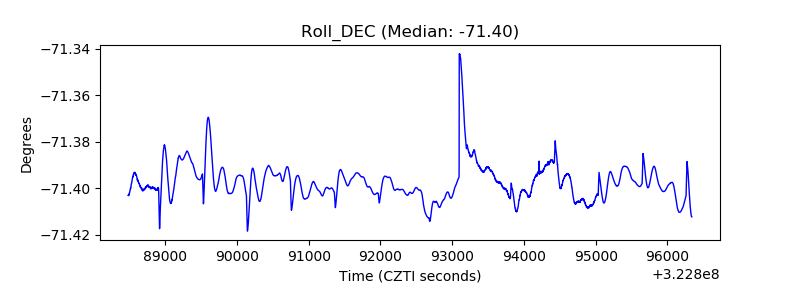 |
| _Roll_RA | 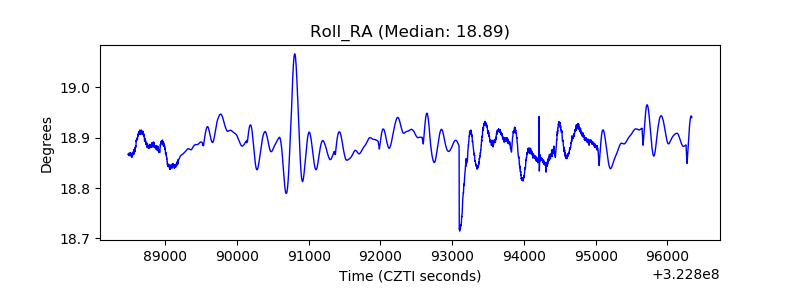 |
| Veto Counter | 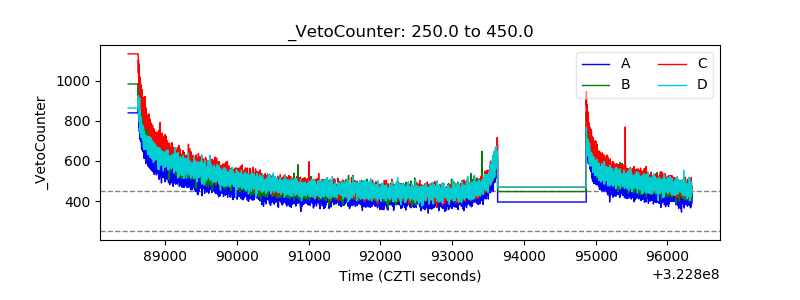 |